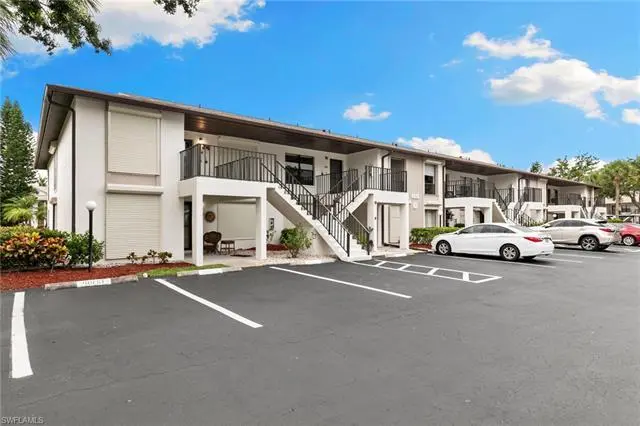
236 Pebble Beach Cir Unit A202 · Lely, FL
Flood risk 9/10 · Severe
- FEMA flood zone
- AE
- Chance of flooding over 30 yrs
- 0.99%
- Est. flood insurance / yr
- $1,737 – $8,500
Fire risk 4/10 · Minor
- Est. fire insurance / yr
- $947 – $1,759
Heat risk 9/10 · Severe
- Hot days now (above 107°F)
- 5 days/yr
- Hot days in 30 yrs
- 18 days/yr
Wind risk 10/10 · Severe
- Chance of severe wind over 30 yrs
- 99.0%
Air-quality risk 2/10 · Minimal
- Unhealthy air days now
- 2 days/yr
- Unhealthy air days in 30 yrs
- 2 days/yr
Risk factors via First Street. Map © Google.
Why this score? — see what drove the C- grade
The composite is a weighted blend of 9 inputs, each scored 0–100. Each bar is that input's sub-score; the figure is the points it added to the 100-point composite (weight × sub-score).
- Cash flow +18.8/30.0
- ARV discount +7.5/15.0
- 1% rule +7.2/10.0
- DSCR +5.9/10.0
- Schools +5.0/10.0
- Rent growth +3.9/5.0
- Livability +3.3/5.0
- Condition / age +2.5/5.0
- Appreciation +0.0/10.0
$270,000
🖨 Deal sheet (PDF) 📄 Offer letter ✓ Due diligence
Listing remarks MLS
Discover a bright and inviting two-bedroom, two-bath residence in the highly sought-after Abbington Village at Lely Golf Estates, offering the perfect blend of comfort and prime Naples convenience. Ideally located with quick access to downtown Naples, the U.S. Open Pickleball Center, world-class dining, boutique shopping, cultural attractions, and Naples' renowned white-sand beaches, this home places you in the heart of it all. The residence features desirable eastern exposure and a spacious living and dining area that opens to a screened lanai with peaceful garden views, perfect for relaxing or entertaining. The kitchen is equipped with stainless steel appliances, granite countertops, and contemporary lighting, combining style and functionality. Additional highlights include in-unit laundry, extra storage, and a reserved covered carport parking spot just steps from the door. Residents enjoy resort-style amenities including an in-ground pool, beautifully maintained grounds, a paved outdoor gathering area with grill, and a pet-friendly atmosphere. Whether used as a full-time residence, seasonal retreat, or investment property, this home delivers effortless living in one of Naples' most desirable communities.
Key facts
- Extra storage
- Screened lanai
- In-unit laundry
Tags
Property features AI
Finance
- Other: Part of a multi-unit complex with 68 units; 8 units in the building; 1 floor with 2 units per floor
- Financial info: Total annual recurring HOA fees reported; Total one-time HOA fees reported
- HOA & community: Non-gated community; Community pool; Professional management; Quarterly condo fee (reported); Maintenance covers irrigation water, lawn/land maintenance, manager, recreation facilities, reserves, and street maintenance
Exterior
- Parking: Detached carport (1 space)
- Utilities: Central water; Central sewer; Cable available
- Home design: Residential property; Low rise (1-3 stories); Built in 1990; Rear exposure to the east; Located in LELY GOLF ESTATES (Abbington Village, unit 202)
- Construction: Concrete block construction
- Exterior features: Stucco exterior finish; Double hung windows; Shingle roof; Zero lot line; Pool/club view; Reclaimed irrigation; Deeded restrictions limiting vehicle types and prohibiting commercial use
Interior
- Kitchen: Dishwasher; Disposal; Microwave; Refrigerator
- Bedrooms: 2 bedrooms
- Flooring: Carpet; Tile
- Bathrooms: 2 full bathrooms; Master bathroom with shower only
- Heating & cooling: Central electric heat; Central electric cooling; Ceiling fans
- Interior features: Cable prewire; Smoke detectors; Vaulted ceiling; Great room floor plan; Dining area combined with living room; Screened lanai/porch; Partially furnished
- Laundry & utility: Washer and dryer in residence; Laundry in residence
Neighborhood map
What this means for you Summary
Snapshot
- This is a 2-bed/2.0-bath condo listed at $270k.
Deal economics
- At list price, monthly cash flow is $-153 ($-2k/yr) — negative.
- To cash-flow at today's rent, offer at most $243k (10.0% below list).
- Meets the 1% rule at list price ($3k rent vs $270k).
- Recommended offer: $243k (10.0% below list) — sets the bar for cash-flow.
Location & tenants
- Location reads 66/100 on livability (#586 in FL) — a middle-class / working-renter tenant base. Strengths: crime A+, housing A+; Watch: health & safety D, amenities F, commute F.
- Collier (suburban): math 60% / reading 56% proficiency, ranked #16 of 73 in FL (top 22%) — acceptable for families but not a draw, mixed tenant base, ~2y average lease.
- Zoned schools: Lely Elementary School (math 45% / reading 46%, grade D-, #1,247 of 2,144 statewide, top 59%, 499 students, 62% FRL); Manatee Middle School (math 61% / reading 43%, grade C+, #217 of 571 statewide, top 40%, 749 students, 64% FRL); Lely High School (math 40% / reading 39%, grade F, #304 of 667 statewide, top 47%, 1,504 students, 54% FRL).
- Zoned-school proficiency averages 46% at this address vs 58% district-wide (-12 pts) — the specific schools serving this property underperform the Collier average; the district grade overstates school quality for this exact location.
- Market conditions: Rents rising fast (+5.6%/yr); 598 active listings in the ZIP; 40 comparable units currently listed for rent nearby; rentals at typical pace (median 25d on market — plan ~3-4 weeks tenant-placement turnaround); solid renter incomes; 3,520 units permitted in Collier County in 2024 (959 in 5+ unit buildings).
- At $3,307/mo this rent would consume 49% of the median local household income ($82k/yr) (locally 954% of renters already pay >50% of income on rent) — very limited rent-growth headroom before tenants either downsize or default.
Forward outlook
- Local home prices are declining (-3.0%/yr); year-one equity from $2k of loan paydown is wiped out by about $8k of value loss. Plan a longer hold.
- Collier County population projected at +30% by 2050 — long-run rental-demand tailwind backs the buy-and-hold thesis.
Negotiation context
- Only 13 days on market — expect competitive offers; lowballing is unlikely to land.
- 2 sale attempts with the ask held roughly flat each time — persistent listings suggest the price (not the market) is what's stuck; bring a comps-based counter.
Risks & watch-outs
- Watch-outs: flood insurance adds $427/mo.
- Climate carrying-cost: in FEMA flood zone AE (mandatory federal flood insurance); severe wind risk, 99% chance of damaging wind over 30y; extreme-heat days projected 5→18/yr by 2055 (HVAC capex compounding) — expect insurance premiums to compound above CPI over the hold.
Questions for the listing agent
- What do current leases actually rent for vs. the listed asking? Can we see a recent rent roll and the last 12 months of T-12 income?
- What's the actual annual flood-insurance premium (NFIP or private), and is the property in a SFHA with mandatory coverage?
- What does the HOA fee cover, when was the last increase, and are there any pending special assessments or reserve-fund shortfalls?
- Any open or pending special assessments — roof, HVAC, plumbing, elevator, façade? What's the per-unit balance and payoff schedule, and is the seller paying it off at close or rolling it to the buyer?
- Is there a deadline driving the sale (1031 exchange, divorce, estate, relocation)? That informs how much negotiation room exists.
- Schools are D-rated, which usually means shorter tenancies and higher turnover. Who's the typical renter profile here, and what's been the actual vacancy rate?
- What's the average days-on-market for RENTAL listings here right now (not sales)? A rising rental-DOM trend means longer vacancies and softer asking-rent achievability than the comps imply.
- What's the recent tenant-quality profile in this submarket — average credit score on applications, eviction rate, late-payment / NSF rate, and stable-employment percentage? A property-management company in the area should have these aggregated.
- How much new apartment / multifamily construction is in the pipeline within 1–3 miles? Heavy new supply (>2% of stock underway) typically softens rents 12–24 months out; light construction supports rent growth.
Investment metrics
- 1% rule
- 1.22% ✓
- Cap rate
- 7.51%
- Cash-on-cash
- 4.35%
- DSCR
- 1.19
- GRM
- 6.8
CMA / ARV
No comps found within radius.
Projected returns pro-forma
-3.0% appreciation · 5.59% rent growth · sell at horizon
- IRR
- -15.8%
- Equity multiple
- 0.42×
- Total profit
- $-44,027
- Equity at exit
- $40,258
- IRR
- -1.7%
- Equity multiple
- 0.87×
- Total profit
- $-10,150
- Equity at exit
- $23,345
Cash invested: $75,600 (down + closing). Projections, not guarantees.
Landlord ↔ Tenant lean methodology
- Overall (STATE)
- 87 Strongly Landlord-Friendly
- State Florida
- 87 Strongly Landlord-Friendly · R+3
- County
- — inherits STATE
- City
- — inherits STATE
ZIP-level market 34113
- Rents YoY
- 5.6%
- Active inventory
- 598
- Price-to-rent
- 6.8×
Monthly cashflow live
- Estimated rent
- $3,307 medium interval (Pro) →
- Mortgage (P&I)
- −$1,416
- Tax from tax record
- −$209 /mo · $2,508/yr
- Insurance
- −$112
- Flood insurance flood zone
- −$427 /mo · $5,118/yr
- HOA
- −$601
- Vacancy / Maint / Mgmt
- −$694
- Net cashflow
- $-153
Break-even live
Sensitivity live
| Price | -10% $0 | -5% $-76 | +0% $-153 | +5% $-229 | +10% $-305 |
|---|---|---|---|---|---|
| Rent | -10% $-414 | -5% $-283 | +0% $-153 | +5% $-22 | +10% $109 |
| Rate | -1.0pp $-17 | -0.5pp $-84 | base $-153 | +0.5pp $-223 | +1.0pp $-294 |
UW: 25.0% down · 7.5% · 30yr · 1.5% tax · 5.0% vac · 8.0% maint · 8.0% mgmt
Financing live
Cash to close
- Down payment
- $67,500
- Closing costs
- $8,100
- Reserves months
- —
- Total cash needed
- —
Loan-product check · same deal, 3 products live
Conventional
25% down · 7.5% · 30yr
- Down + closing
- —
- Monthly P&I
- —
- Monthly cashflow
- —
- DSCR
- —
- Eligible?
- —
Personal DTI + credit; lowest rate.
DSCR
20% down · 8.5% · 30yr
- Down + closing
- —
- Monthly P&I
- —
- Monthly cashflow
- —
- DSCR
- —
- Eligible?
- —
No personal income docs; deal must DSCR.
Hard money
10% down · 12.0% · 12mo
- Down + closing
- —
- Monthly P&I
- —
- Monthly cashflow
- —
- DSCR
- —
- Eligible?
- —
Short-term bridge; refi at stabilization.
Rent comps 40 comps
| Address | Beds | Baths | Sqft | Rent | $/sqft | DOM | Units | Dist |
|---|---|---|---|---|---|---|---|---|
| 248 Pebble Beach Cir Unit G201 Naples, FL | 2.0 | 2.0 | 1163 | $2,300 | $1.98 | 25d | 1 | 0.05mi |
| 332 Bradstrom Cir #201 Naples, FL | 2.0 | 2.0 | 1257 | $2,200 | $1.75 | 25d | 1 | 0.19mi |
| 326 Bradstrom Cir Unit 103F Naples, FL | 2.0 | 2.0 | 1113 | $1,800 | $1.62 | 25d | 1 | 0.20mi |
| 326 Bradstrom Cir Unit 204F Naples, FL | 3.0 | 2.0 | 1200 | $3,500 | $2.92 | 25d | 1 | 0.20mi |
| 5293 Dixie Dr Unit 1546039P Naples, FL | 2.0 | 2.0 | 1130 | $1,561 | $1.38 | 15d | 1 | 0.20mi |
| 315 Saint Andrews Blvd Unit A25 Naples, FL | 2.0 | 2.0 | 1126 | $1,530 | $1.36 | 25d | 1 | 0.26mi |
| 452 Bristle Cone Ln #27 Naples, FL | 2.0 | 2.0 | 1129 | $2,000 | $1.77 | 25d | 1 | 0.29mi |
| 7124 Saona Ct Naples, FL | 2.0 | 2.0 | 1387 | $8,000 | $5.77 | 25d | 1 | 0.36mi |
| 6984 Saona Ct Naples, FL | 2.0 | 2.0 | 1472 | $7,500 | $5.10 | 25d | 1 | 0.37mi |
| 7162 Saona Ct Naples, FL | 2.0 | 2.0 | 1482 | $9,000 | $6.07 | 25d | 1 | 0.38mi |
| 7110 Cayo Coco Ln Naples, FL | 2.0 | 2.0 | 1387 | $9,250 | $6.67 | 25d | 1 | 0.41mi |
| 7197 Saona Ct Unit 1545994P Naples, FL | 2.0 | 2.0 | 1291 | $4,152 | $3.22 | 15d | 1 | 0.41mi |
| 7213 Saona Ct Naples, FL | 2.0 | 2.0 | 1308 | $7,500 | $5.73 | 25d | 1 | 0.42mi |
| 7138 Cayo Coco Ln Naples, FL | 2.0 | 2.0 | 1205 | $6,500 | $5.39 | 25d | 1 | 0.43mi |
| 7142 Cayo Coco Ln Naples, FL | 2.0 | 2.0 | 1490 | $10,000 | $6.71 | 25d | 1 | 0.43mi |
| 7242 Saona Ct Naples, FL | 2.0 | 2.0 | 1204 | $7,750 | $6.44 | 25d | 1 | 0.46mi |
| 7289 Saona Ct Naples, FL | 2.0 | 2.0 | 1411 | $10,000 | $7.09 | 25d | 1 | 0.48mi |
| 7204 Cayo Coco Ln Naples, FL | 2.0 | 2.0 | 1308 | $7,500 | $5.73 | 25d | 1 | 0.48mi |
| 7286 Saona Ct Naples, FL | 2.0 | 2.0 | 1205 | $10,000 | $8.30 | 25d | 1 | 0.49mi |
| 7263 Cayo Coco Ln Naples, FL | 2.0 | 2.0 | 1321 | $6,500 | $4.92 | 25d | 1 | 0.55mi |
| 7299 Cayo Coco Ln Naples, FL | 2.0 | 2.0 | 1476 | $6,500 | $4.40 | 25d | 1 | 0.55mi |
| 7259 Cayo Coco Ln Naples, FL | 2.0 | 2.0 | 1411 | $6,500 | $4.61 | 25d | 1 | 0.55mi |
| 190 Pebble Beach Blvd #301 Naples, FL | 2.0 | 2.0 | 954 | $1,700 | $1.78 | 25d | 1 | 0.58mi |
| 240 Pebble Beach Blvd #702 Naples, FL | 2.0 | 2.0 | 1090 | $4,000 | $3.67 | 25d | 1 | 0.58mi |
| 232 Pebble Beach Blvd #104 Naples, FL | 3.0 | 2.0 | 1298 | $1,975 | $1.52 | 25d | 1 | 0.65mi |
| 520 Augusta Blvd Unit B204 Naples, FL | 3.0 | 2.0 | 1294 | $2,200 | $1.70 | 25d | 1 | 0.66mi |
| 265 Deerwood Cir Naples, FL | 2.0 | 2.0 | 1179 | $5,000 | $4.24 | 25d | 1 | 0.72mi |
| 413 Augusta Blvd #302 Naples, FL | 2.0 | 2.0 | 1390 | $5,500 | $3.96 | 23d | 1 | 0.76mi |
| 555 Augusta Blvd Unit 3-1 Naples, FL | 2.0 | 2.0 | 1249 | $4,200 | $3.36 | 25d | 1 | 0.84mi |
| 5499 Rattlesnake Hammock Rd Naples, FL | 2.0 | 2.0 | 1071 | $1,775 | $1.66 | 15d | 2 | 0.88mi |
| 5419 Rattlesnake Hammock Rd Unit 307F Naples, FL | 2.0 | 2.0 | 1071 | $1,950 | $1.82 | 15d | 1 | 0.88mi |
| 9509 Avellino Way Naples, FL | 2.0 | 2.0 | 1434 | $7,350 | $5.13 | 15d | 2 | 0.88mi |
| 575 Augusta Blvd Naples, FL | 3.0 | 2.0 | 1500 | $2,100 | $1.40 | 25d | 1 | 0.88mi |
| 9509 Avellino Way #1815 Naples, FL | 2.0 | 2.0 | 1454 | $7,500 | $5.16 | 25d | 1 | 0.88mi |
| 5535 Rattlesnake Hammock Rd #302 Naples, FL | 2.0 | 2.0 | 1205 | $2,800 | $2.32 | 25d | 1 | 0.89mi |
| 5651 Rattlesnake Hammock Rd Unit C-108 Naples, FL | 2.0 | 2.0 | 1054 | $1,800 | $1.71 | 25d | 1 | 0.91mi |
| 5635 Rattlesnake Hammock Rd Apt 203D Naples, FL | 2.0 | 2.0 | 1054 | $1,700 | $1.61 | 23d | 1 | 0.91mi |
| 9510 Avellino Way #1926 Naples, FL | 3.0 | 2.0 | 1454 | $8,000 | $5.50 | 25d | 1 | 0.92mi |
| 9513 Avellino Way #2024 Naples, FL | 2.0 | 2.0 | 1454 | $7,000 | $4.81 | 25d | 1 | 0.93mi |
| 605 Augusta Blvd #14 Naples, FL | 2.0 | 2.0 | 1125 | $4,000 | $3.56 | 25d | 1 | 0.94mi |
HOA detail condo
- Monthly dues
- $601 · $7,212/yr
- Likely covers
- landscapingpool
- Assessments
- None detected in remarks — confirm with the listing agent.
Listing history 9 events
-
2026-06-21days on market $270,000 Active 13 DOM
-
2026-06-18days on market $270,000 Active 10 DOM
-
2026-06-17days on market $270,000 Active 9 DOM
-
2026-06-16days on market $270,000 Active 8 DOM
-
2026-06-15days on market $270,000 Active 7 DOM
-
2026-06-14days on market $270,000 Active 5 DOM
-
2026-06-10days on market $270,000 Active 2 DOM
-
2026-06-09remarks 693-char remark
-
2026-06-09$270,000 Active 1 DOM
ⓘ Source: listings_history table (triggers on properties + properties_extension) + one-shot
backfill from property_details.listing_events for pre-trigger history.
Tax reassessment forecast FL · Resets to sale price
- Current annual tax
- $2,508 · $209/mo
- Projected year-2 tax
- $2,508 · $209/mo
- Expected delta
- $0/yr ($0/mo · 0.0%)
ⓘ Screening estimate from a state-policy table — verify with the county assessor before closing.
Climate risk First Street
- Flood 9/10 Extreme FEMA zone AE · 99% chance over 30 yrs
- Wildfire 4/10 Moderate
- Heat 9/10 Extreme 5 d/yr ≥107°F today · 18 d/yr by 30 yrs out
- Wind 10/10 Extreme 99% chance of damaging wind over 30 yrs
- Air quality 2/10 Low 2 unhealthy d/yr today · 2 by 30 yrs out
Nearby sold comps map
Loading sold comps map…
Walkable amenities ~0.75 mi
Loading nearby amenities…
Taxation est. · year 1
- Rental income
- $39,681
- − Mortgage interest
- −$15,124
- − Property taxes
- −$2,508
- − Insurance
- −$6,469
- − Repairs & maintenance
- −$3,174
- − Management
- −$3,174
- − HOA
- −$7,212
- − Depreciation
- −$7,855
- Taxable loss
- −$5,835
- Est. tax savings @ 24.0%
- +$1,400
- After-tax cash flow
- $-431/yr
For passive investors: Depreciation is non-cash, so a rental often shows a tax loss while cash-flowing — sheltering income. Rental losses are passive: they offset passive income freely, and up to $25,000/yr can offset ordinary (W-2) income if you actively participate and your MAGI is under $100k (phasing out to $0 by $150k); unused losses carry forward. On sale, claimed depreciation is recaptured at up to 25%, and gains may owe capital-gains tax (a 1031 exchange can defer both). Figures are a year-1 estimate at your 24.0% rate — not tax advice; consult a CPA.
Schools (NCES district)
- District
- Collier
- NCES district ID
- 1200330
- Math proficiency
- 60% ▼ -4.00%
- Reading proficiency
- 56% ▼ -2.00%
- Median HH income
- $58,275
- Composite
- 50.23/100
- National rank
- #1892
- State rank
- #16 of 73 in FL
Livability — Lely
- Score
- 66/100
- State rank
- #586
- US rank
- #11224
Category grades
Schools grade is shown separately in the Schools card above.
Census & demographics
- Census place
- Lely, FL
- County
- Collier County · 396,295 people
- Metro
- Naples-Marco Island, FL
- Population (ZIP)
- 26,056
- Household income
- $81,674
- Rent vs Own
- Severe rent burden
- 954.0
Population outlook (Collier County) Hauer SSP2
- Today (2025)
- 420,858 people
- By 2030
- 450,054 · +6.9%
- By 2040
- 502,232 · +19.3%
- By 2050
- 544,932 · +29.5%
- By 2075
- 627,203 · +49.0%
- By 2100
- 659,015 · +56.6%
Race, ethnicity, and origin ACS 2023
- Neighborhood character
- Diverse neighborhood (Simpson 0.59)
- Race & ethnicity
- White 56% Hispanic / Latino 28% Black 12% Two or more races 11% Asian 2%
- Hispanic origin (detail)
- Mexican 17% Puerto Rican 3% Cuban 2%
- Common ancestry
- Hispanic 10% Romanian 3% Lithuanian 2%
- Foreign-born
- 26% · Canada, Jamaica, Vietnam
- Languages at home
- 63% English-only · Spanish 24% French/Haitian/Cajun 9% Other Indo-European 2%
Political lean MEDSL · Collier
- 2024 margin
- Solid R (+33.1) · D 33.1% · R 66.2%
- 2008→2024 swing
- -10.6pp toward R · 2008: -22.5pp · 2024: -33.1pp
- All cycles
- 2024: R+33.1 2020: R+24.7 2016: R+26.0 2012: R+30.1 2008: R+22.5
Not yet ingested
- Civics
- —
Market trends
- HPI YoY
- ▼ -194.86%
- Current HPI
- 279.4232
- Rent YoY
- ▲ 5.59%
- Metro
- Naples-Marco Island, FL
- State GDP YoY
- ▲ 3.28%
- F500 in state
- 36
Industry mix (Fortune 500 HQ in FL)
| Industry | F500 HQs | Revenue |
|---|---|---|
| Industrial Technology | 2 | $29B |
|
||
| Insurance | 2 | $17B |
|
||
| Retail | 1 | $60B |
|
||
| Technology Distribution | 1 | $58B |
|
||
| Homebuilding | 1 | $35B |
|
||
| Technology Manufacturing | 1 | $35B |
|
||
Price history
+0.0% since first listed2 events — show timeline
- 2026-06-08 Listed $270,000 NAPLESMLS
- 2026-06-08 Listed $270,000 MIML
Property tax history
+7.8%/yrLatest (2025): $2,508 · +8.7% YoY. Source: county tax records.
Cash-flow waterfall
monthlySold comps — $/sqft
last 12 mo · ≤1 miLoading sold comps…