 🏗️ New Construction
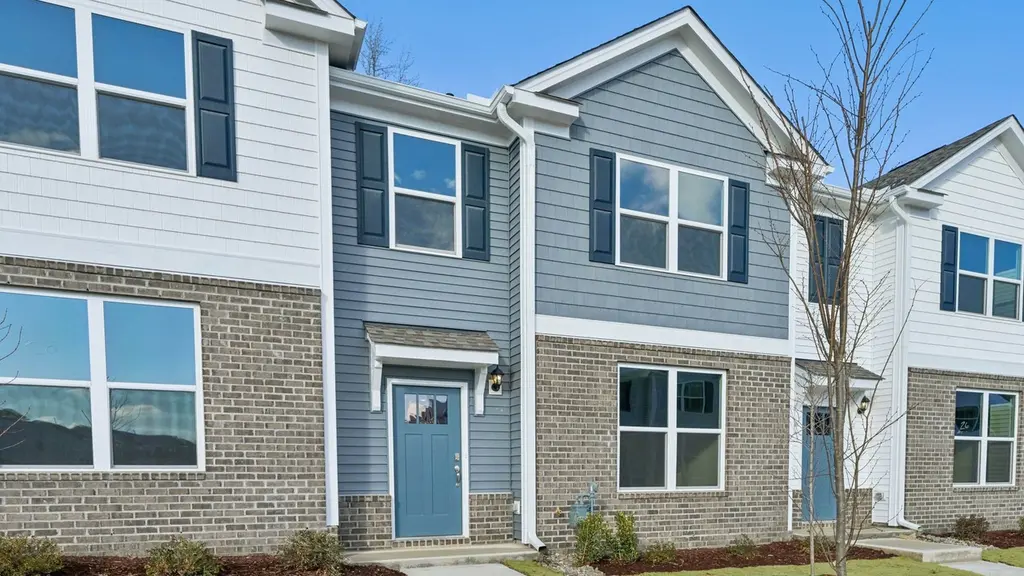
919 Sculptor St · Wendell, NC
Flood risk No data
- FEMA flood zone
- —
- Chance of flooding over 30 yrs
- —
- Est. flood insurance / yr
- —
Fire risk No data
- Est. fire insurance / yr
- —
Heat risk No data
- Hot days now (above threshold)
- —
- Hot days in 30 yrs
- —
Wind risk No data
- Chance of severe wind over 30 yrs
- —
Air-quality risk No data
- Unhealthy air days now
- —
- Unhealthy air days in 30 yrs
- —
Risk factors via First Street. Map © Google.
Why this score? — see what drove the F grade
The composite is a weighted blend of 9 inputs, each scored 0–100. Each bar is that input's sub-score; the figure is the points it added to the 100-point composite (weight × sub-score).
- ARV discount +7.5/15.0
- Cash flow +6.4/30.0
- Schools +4.9/10.0
- Livability +3.9/5.0
- Rent growth +3.4/5.0
- Condition / age +2.5/5.0
- 1% rule +2.1/10.0
- DSCR +0.7/10.0
- Appreciation +0.0/10.0
$289,990
🖨 Deal sheet (PDF) 📄 Offer letter ✓ Due diligence
Listing remarks MLS
Come tour the Blake at 919 Sculptor St. , Wendell, NC, 27591 at The Townes at Anderson Farm! The Blake is one of our two-story townhome plans featured in The Townes at Anderson Farm, located in Wendell, NC. This is a spacious and modern home designed with open-concept living in mind. This home offers 3 bedrooms, 2.5 bathrooms, and a 2-car garage. You are greeted by a foyer as you enter that opens to the center of the home that blends the the family room, kitchen and dining room creating an airy feel. The open kitchen is equipped with stainless steel appliances, quartz countertops and bar seating - perfect for both cooking and entertaining. The primary suite is located on the second floor, complete with en-suite bathroom with dual vanities and a walk-in closet. The additional two bedrooms share access to a secondary bathroom. The laundry closet completes the second floor. The open floorplan and thoughtfully designed living spaces, make the Blake the ideal home for you at The Townes at Anderson Farm. Don't miss out on the opportunity to make it your own. Schedule a tour today. * Photos are not of actual home or interior features and are representative of floor plan only. *
Key facts
- Quartz countertops
- Open concept living
- Dual vanities
Tags
Property features AI
Finance
- Other: Energy-efficient features include smart lighting and smart thermostat
- HOA & community: Association managed by Charleston Management; Monthly HOA fee of $140 covering grounds maintenance; Community amenities include pool, dog park, playground, trails, sidewalks, and street lights
Exterior
- Parking: Attached garage with 2 garage spaces and garage door opener; Additional 2 open parking spaces (4 parking spaces total); Concrete driveway; Garage faces rear
- Security: Smart lock(s)
- Utilities: Public water; Public sewer; Electricity available; Natural gas available; Cable available; Underground utilities
- Home design: Townhouse; Two levels; New construction (under construction); Built by D.R. Horton — Blake model
- Construction: Vinyl siding; Architectural shingle roof; Slab foundation; Built in recent year (new construction)
- Exterior features: Patio; Smart lights and smart locks; Private and public maintained road access
Interior
- Kitchen: Dishwasher; Gas range (free-standing); Microwave; Stainless steel appliances
- Bedrooms: 3 bedrooms
- Flooring: Carpet; Laminate; Vinyl
- Bathrooms: 2 full bathrooms; 1 half bathroom
- Heating & cooling: Natural gas heating; Central air conditioning
- Interior features: Kitchen island; Open floor plan; Pantry; Quartz counters; Smart home features including smart lights and smart thermostat; Walk-in closets; Walk-in shower
- Laundry & utility: Laundry room with washer and electric dryer hookups; Tankless water heater
Neighborhood map
What this means for you Summary
Snapshot
- This is a 3-bed/2.5-bath townhouse listed at $290k.
Deal economics
- At list price, monthly cash flow is $-533 ($-6k/yr) — negative.
- To cash-flow at today's rent, offer at most $269k (7.1% below list).
- To meet the 1% rule (rent ≥ 1% of price), the offer needs to be $217k (25.2% below list).
- Recommended offer: $217k (25.2% below list) — sets the bar for 1% rule.
Location & tenants
- Location reads 78/100 on livability (#25 in NC, #2,391 nationally) — a middle-class / working-renter tenant base. Strengths: housing A+, health & safety A+, crime A; Watch: amenities D.
- Wake County Schools (suburban): math 52% / reading 60% proficiency, ranked #35 of 178 in NC (top 20%) — acceptable for families but not a draw, mixed tenant base, ~2y average lease.
- Zoned schools: Wendell Middle (math 21% / reading 39%, grade F, #335 of 475 statewide, top 72%, 719 students, 68% FRL); East Wake High (math 51% / reading 44%, grade D, #331 of 535 statewide, top 62%, 1,646 students, 62% FRL) — zoned schools average 65% FRL vs 30% district-wide (35 pts higher); higher-poverty schools than district average — tighter screening recommended.
- Zoned-school proficiency averages 39% at this address vs 56% district-wide (-17 pts) — the specific schools serving this property underperform the Wake County Schools average; the district grade overstates school quality for this exact location.
- Market conditions: Rents rising (+3.4%/yr); 822 active listings in the ZIP; 4 comparable units currently listed for rent nearby; rentals leasing fast (median 13d on market — plan ~1-2 weeks tenant-placement turnaround); solid renter incomes; 15,249 units permitted in Wake County in 2024 (5,568 in 5+ unit buildings).
- This rent runs 31% of the median local income ($85k/yr) — at the standard rent-burdened threshold; future hikes will face affordability resistance.
Forward outlook
- Local home prices are declining (-3.0%/yr); year-one equity from $2k of loan paydown is wiped out by about $9k of value loss. Plan a longer hold.
- Wake County population projected at +51% by 2050 — long-run rental-demand tailwind backs the buy-and-hold thesis.
Negotiation context
- It's been on market 57 days — a 3% lower offer ($281k) is reasonable based on typical stale-listing flexibility.
- 2 sale attempts with the ask held roughly flat each time — persistent listings suggest the price (not the market) is what's stuck; bring a comps-based counter.
Questions for the listing agent
- What do current leases actually rent for vs. the listed asking? Can we see a recent rent roll and the last 12 months of T-12 income?
- It's been on market 57 days. Have you received any prior offers? Is the seller open to a 25% concession, seller financing, or rate buy-down credit?
- What does the HOA fee cover, when was the last increase, and are there any pending special assessments or reserve-fund shortfalls?
- Is there a deadline driving the sale (1031 exchange, divorce, estate, relocation)? That informs how much negotiation room exists.
- Schools are D-rated, which usually means shorter tenancies and higher turnover. Who's the typical renter profile here, and what's been the actual vacancy rate?
- The area grade is low — what's the realistic commute time and amenity access for the typical tenant pool here? Any planned neighborhood developments (good or bad) we should know about?
- What's the average days-on-market for RENTAL listings here right now (not sales)? A rising rental-DOM trend means longer vacancies and softer asking-rent achievability than the comps imply.
- What's the recent tenant-quality profile in this submarket — average credit score on applications, eviction rate, late-payment / NSF rate, and stable-employment percentage? A property-management company in the area should have these aggregated.
- How much new for-sale + rental construction is in the pipeline within 1–3 miles? Heavy new supply typically softens prices + rents 12–24 months out; constrained supply supports both.
Investment metrics
- 1% rule
- 0.71% ✗
- Cap rate
- 4.19%
- Cash-on-cash
- -7.50%
- DSCR
- 0.67
- GRM
- 11.7
CMA / ARV
- ARV (on-the-fly)
- $304,775
- Comps found
- 11
Show comp detail 11 sales within ~0.75 mi
| Address | Dist | Beds/Ba | Sqft | Sold | Price | $/sf | Match |
|---|---|---|---|---|---|---|---|
| 797 Old Tarboro Rd | 0.05mi | 3/2.5 | 1,825 (0%) | 3mo | $302,490 | $166 | 95 |
| 793 Old Tarboro Rd | 0.05mi | 3/2.5 | 1,823 (-0%) | 7mo | $300,000 | $165 | 92 |
| 836 Old Tarboro Rd | 0.08mi | 3/2.5 | 1,823 (-0%) | 11mo | $300,490 | $165 | 87 |
| 872 Old Tarboro Rd | 0.14mi | 3/2.5 | 1,823 (-0%) | 14mo | $313,990 | $172 | 82 |
| 850 Old Tarboro Rd | 0.10mi | 3/2.5 | 1,825 (0%) | 16mo | $304,000 | $167 | 82 |
| 868 Old Tarboro Rd | 0.13mi | 3/2.5 | 1,823 (-0%) | 14mo | $310,540 | $170 | 82 |
| 846 Old Tarboro Rd | 0.10mi | 3/2.5 | 1,825 (0%) | 16mo | $305,000 | $167 | 82 |
| 847 Old Tarboro Rd | 0.11mi | 3/2.5 | 1,825 (0%) | 16mo | $313,490 | $172 | 82 |
| 535 Old Battle Bridge Rd | 0.09mi | 3/2.5 | 1,825 (0%) | 17mo | $293,000 | $161 | 82 |
| 539 Old Battle Bridge Rd | 0.10mi | 3/2.5 | 1,825 (0%) | 17mo | $305,000 | $167 | 81 |
| 549 Old Battle Bridge Rd | 0.12mi | 3/2.5 | 1,823 (-0%) | 17mo | $300,000 | $165 | 80 |
Match score weights: distance 35% · size 25% · config 20% · recency 20%. Top-matched comps best support the ARV.
Projected returns pro-forma
-3.0% appreciation · 3.4% rent growth · sell at horizon
- IRR
- -28.8%
- Equity multiple
- 0.04×
- Total profit
- $-82,344
- Equity at exit
- $45,443
- IRR
- -26.8%
- Equity multiple
- -0.30×
- Total profit
- $-111,315
- Equity at exit
- $26,351
Cash invested: $85,337 (down + closing). Projections, not guarantees.
Landlord ↔ Tenant lean methodology
- Overall (STATE)
- 85 Strongly Landlord-Friendly
- State North Carolina
- 85 Strongly Landlord-Friendly · R+3
- County
- — inherits STATE
- City
- — inherits STATE
ZIP-level market 27591
- Home prices YoY
- -28.3%
- Rents YoY
- 3.4%
- Active inventory
- 822
- Price-to-rent
- 11.1×
Monthly cashflow live
- Estimated rent
- $2,169 medium interval (Pro) →
- Mortgage (P&I)
- −$1,598
- Tax est. 1.5%
- −$381 /mo · $4,572/yr
- Insurance
- −$127
- HOA
- −$140
- Vacancy / Maint / Mgmt
- −$455
- Net cashflow
- $-533
Break-even live
Sensitivity live
| Price | -10% $-28 | -5% $-114 | +0% $-533 | +5% $-638 | +10% $-744 |
|---|---|---|---|---|---|
| Rent | -10% $-704 | -5% $-619 | +0% $-533 | +5% $-447 | +10% $-362 |
| Rate | -1.0pp $-380 | -0.5pp $-456 | base $-533 | +0.5pp $-612 | +1.0pp $-692 |
UW: 25.0% down · 7.5% · 30yr · 1.5% tax · 5.0% vac · 8.0% maint · 8.0% mgmt
Financing live
Cash to close
- Down payment
- $76,194
- Closing costs
- $9,143
- Reserves months
- —
- Total cash needed
- —
Loan-product check · same deal, 3 products live
Conventional
25% down · 7.5% · 30yr
- Down + closing
- —
- Monthly P&I
- —
- Monthly cashflow
- —
- DSCR
- —
- Eligible?
- —
Personal DTI + credit; lowest rate.
DSCR
20% down · 8.5% · 30yr
- Down + closing
- —
- Monthly P&I
- —
- Monthly cashflow
- —
- DSCR
- —
- Eligible?
- —
No personal income docs; deal must DSCR.
Hard money
10% down · 12.0% · 12mo
- Down + closing
- —
- Monthly P&I
- —
- Monthly cashflow
- —
- DSCR
- —
- Eligible?
- —
Short-term bridge; refi at stabilization.
Rent comps 4 comps
| Address | Beds | Baths | Sqft | Rent | $/sqft | DOM | Units | Dist |
|---|---|---|---|---|---|---|---|---|
| 810 Old Tarboro Rd Wendell, NC | 3.0 | 2.5 | 1825 | $2,025 | $1.11 | 3d | 1 | 0.05mi |
| 920 Sculptor St Wendell, NC | 3.0 | 2.5 | 1852 | $1,950 | $1.05 | 13d | 1 | 0.05mi |
| 5904 Sandpiper Farm Ln Wendell, NC | 4.0 | 2.5 | 2336 | $2,250 | $0.96 | 24d | 1 | 0.65mi |
| 1700 Red Grove Ln Knightdale, NC | 1.0–3.0 | 1.0–2.0 | 1040 | $2,049 | $1.97 | 2d | 27 | 1.15mi |
HOA detail
- Monthly dues
- $140 · $1,680/yr
Listing history 16 events
-
2026-06-18days on market $289,990 Active 57 DOM
-
2026-06-17days on market $289,990 Active 56 DOM
-
2026-06-16days on market $289,990 Active 55 DOM
-
2026-06-15days on market $289,990 Active 54 DOM
-
2026-06-13days on market $289,990 Active 52 DOM
-
2026-06-13days on market $289,990 Active 51 DOM
-
2026-06-09days on market $289,990 Active 48 DOM
-
2026-06-08days on market $289,990 Active 47 DOM
-
2026-06-07pricedays on market $289,990 Active 46 DOM
-
2026-06-05days on market $299,990 Active 43 DOM
-
2026-06-03days on market $299,990 Active 42 DOM
-
2026-06-02days on market $299,990 Active 41 DOM
-
2026-06-01days on market $299,990 Active 40 DOM
-
2026-05-31days on market $299,990 Active 39 DOM
-
2026-04-23$299,990 Active 1191-char remark
Show marketing remark (1191 chars)
Come tour the Blake at 919 Sculptor St. , Wendell, NC, 27591 at The Townes at Anderson Farm! The Blake is one of our two-story townhome plans featured in The Townes at Anderson Farm, located in Wendell, NC. This is a spacious and modern home designed with open-concept living in mind. This home offers 3 bedrooms, 2.5 bathrooms, and a 2-car garage. You are greeted by a foyer as you enter that opens to the center of the home that blends the the family room, kitchen and dining room creating an airy feel. The open kitchen is equipped with stainless steel appliances, quartz countertops and bar seating - perfect for both cooking and entertaining. The primary suite is located on the second floor, complete with en-suite bathroom with dual vanities and a walk-in closet. The additional two bedrooms share access to a secondary bathroom. The laundry closet completes the second floor. The open floorplan and thoughtfully designed living spaces, make the Blake the ideal home for you at The Townes at Anderson Farm. Don't miss out on the opportunity to make it your own. Schedule a tour today. * Photos are not of actual home or interior features and are representative of floor plan only. *
-
2026-04-22$299,990 Active
ⓘ Source: listings_history table (triggers on properties + properties_extension) + one-shot
backfill from property_details.listing_events for pre-trigger history.
Tax reassessment forecast NC · Resets to sale price
- Current annual tax
- $583 · $49/mo
- Projected year-2 tax
- $2,378 · $198/mo
- Expected delta
- +$1,795/yr (+$150/mo · 308.0%)
ⓘ Screening estimate from a state-policy table — verify with the county assessor before closing.
Nearby sold comps map
Loading sold comps map…
Walkable amenities ~0.75 mi
Loading nearby amenities…
Taxation est. · year 1
- Rental income
- $26,023
- − Mortgage interest
- −$17,072
- − Property taxes
- −$4,572
- − Insurance
- −$1,524
- − Repairs & maintenance
- −$2,082
- − Management
- −$2,082
- − HOA
- −$1,680
- − Depreciation
- −$8,866
- Taxable loss
- −$11,855
- Est. tax savings @ 24.0%
- +$2,845
- After-tax cash flow
- $-3,552/yr
For passive investors: Depreciation is non-cash, so a rental often shows a tax loss while cash-flowing — sheltering income. Rental losses are passive: they offset passive income freely, and up to $25,000/yr can offset ordinary (W-2) income if you actively participate and your MAGI is under $100k (phasing out to $0 by $150k); unused losses carry forward. On sale, claimed depreciation is recaptured at up to 25%, and gains may owe capital-gains tax (a 1031 exchange can defer both). Figures are a year-1 estimate at your 24.0% rate — not tax advice; consult a CPA.
Schools (NCES district)
- District
- Wake County Schools
- NCES district ID
- 3704720
- Math proficiency
- 52% ▲ 2.00%
- Reading proficiency
- 60% ▲ 4.00%
- Median HH income
- $67,509
- Composite
- 49.41/100
- National rank
- #2010
- State rank
- #35 of 178 in NC
Livability — Wendell
- Score
- 78/100
- State rank
- #25
- US rank
- #2391
Category grades
Schools grade is shown separately in the Schools card above.
Census & demographics
- Census place
- Wendell, NC
- County
- Wake County · 1,216,256 people
- City population
- 29,838
- Metro
- Raleigh-Cary, NC
- Population (ZIP)
- 29,838
- Household income
- $85,224
- Rent vs Own
- Severe rent burden
- 369.0
Population outlook (Wake County) Hauer SSP2
- Today (2025)
- 1,293,152 people
- By 2030
- 1,428,223 · +10.4%
- By 2040
- 1,698,188 · +31.3%
- By 2050
- 1,955,807 · +51.2%
- By 2075
- 2,520,273 · +94.9%
- By 2100
- 2,893,335 · +123.7%
Race, ethnicity, and origin ACS 2023
- Neighborhood character
- Diverse neighborhood (Simpson 0.66)
- Race & ethnicity
- White 46% Hispanic / Latino 27% Black 22% Two or more races 11%
- Hispanic origin (detail)
- Mexican 14% Puerto Rican 4% Dominican 1%
- Common ancestry
- Slovak 2% Serbian 2% Lithuanian 1%
- Foreign-born
- 14% · Canada, Jamaica
- Languages at home
- 79% English-only · Spanish 18% Tagalog/Filipino 1%
Political lean MEDSL · Wake
- 2024 margin
- Strong D (+25.5) · D 61.9% · R 36.4% · Other 1.7%
- 2008→2024 swing
- +11.1pp toward D · 2008: 14.4pp · 2024: 25.5pp
- All cycles
- 2024: D+25.5 2020: D+26.4 2016: D+20.5 2012: D+10.2 2008: D+14.4
Not yet ingested
- Civics
- —
Market trends
- HPI YoY
- ▼ -92.20%
- Current HPI
- 233.2846
- Rent YoY
- ▲ 3.40%
- Metro
- Raleigh-Cary, NC
- State GDP YoY
- ▲ 3.28%
- F500 in state
- 26
Industry mix (Fortune 500 HQ in NC)
| Industry | F500 HQs | Revenue |
|---|---|---|
| Financial Services | 2 | $213B |
|
||
| Retail | 2 | $95B |
|
||
| Industrial Conglomerate | 1 | $38B |
|
||
| Metals / Steel | 1 | $35B |
|
||
| Utilities | 1 | $30B |
|
||
| Industrial Machinery | 1 | $19B |
|
||
Price history
+0.0% since first listed2 events — show timeline
- 2026-04-23 Listed $299,990 Zillow
- 2026-04-22 Listed $299,990 TMLS
Cash-flow waterfall
monthlySold comps — $/sqft
last 12 mo · ≤1 miLoading sold comps…