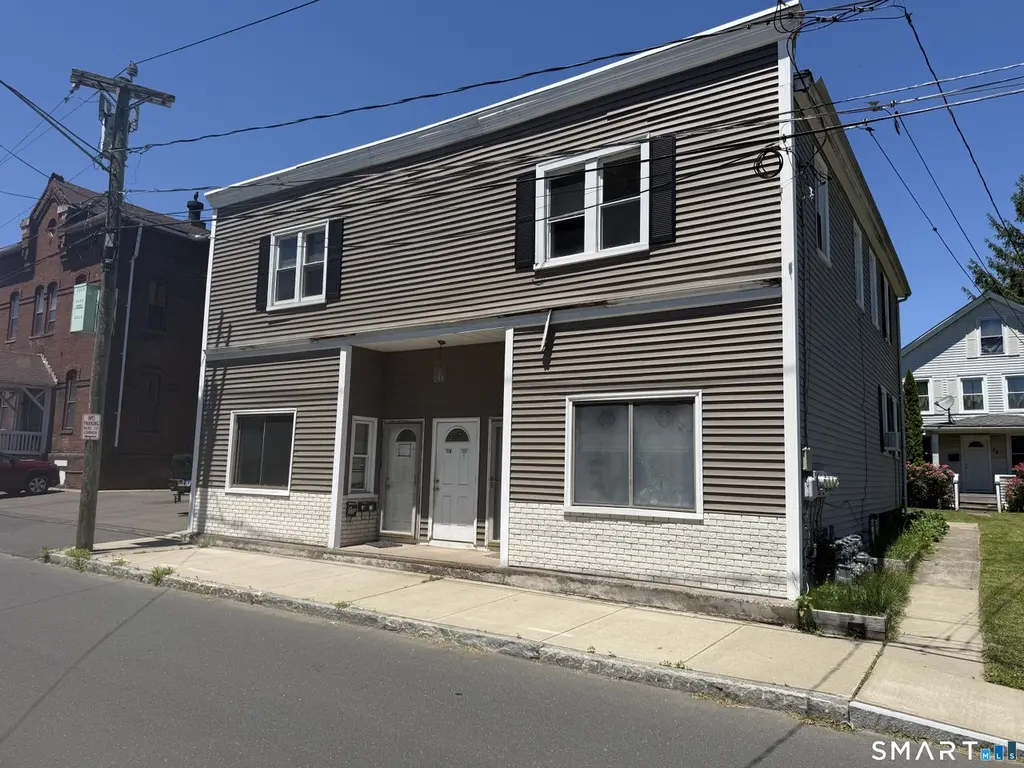
 Fourplex
53 College St · Thompsonville, CT
Flood risk 1/10 · Minimal
- FEMA flood zone
- X (unshaded)
- Chance of flooding over 30 yrs
- 0.0%
- Est. flood insurance / yr
- $473 – $860
Fire risk 3/10 · Minor
- Est. fire insurance / yr
- $829 – $1,539
Heat risk 5/10 · Moderate
- Hot days now (above 98°F)
- 7 days/yr
- Hot days in 30 yrs
- 15 days/yr
Wind risk 6/10 · Moderate
- Chance of severe wind over 30 yrs
- 27.0%
Air-quality risk 3/10 · Minor
- Unhealthy air days now
- 2 days/yr
- Unhealthy air days in 30 yrs
- 3 days/yr
Risk factors via First Street. Map © Google.
Why this score? — see what drove the B+ grade
The composite is a weighted blend of 9 inputs, each scored 0–100. Each bar is that input's sub-score; the figure is the points it added to the 100-point composite (weight × sub-score).
- Cash flow +30.0/30.0
- ARV discount +13.7/15.0
- 1% rule +10.0/10.0
- DSCR +10.0/10.0
- Rent growth +3.5/5.0
- Livability +3.5/5.0
- Schools +3.0/10.0
- Condition / age +2.5/5.0
- Appreciation +0.0/10.0
$349,900
🖨 Deal sheet 📄 Offer letter ✓ Due diligence
Multi-family units
County records classify this as Multi-Family (5+ Unit). Listing-text estimate: 4 units. estimate disagrees with records
5+ unit building — per-unit beds/baths from public records are typically unavailable; the breakdown below (if shown) is an estimate from the listing text.
Listing remarks
Nice 4 Unit to bring your finishing touches. 3 units vacant but rentable. 1st floor right has lease. 3 gas boilers and 3 h20 heaters. 4 electrical meters no owner's box. Cash investors preferred. Property is being sold as-is where as.
Key facts
- 2,178 sq ft lot
- Built 1900
- Listed 8 days
Property features AI
Finance
- Financial info: Multi-family income property (4 units)
Exterior
- Utilities: Public water (in street); Public sewer connected; Thermopane windows
- Home design: Multi-family property (4-family)
- Construction: Built with frame construction; Concrete foundation; Asphalt shingle roof; Vinyl siding
- Exterior features: Sidewalk; Gutters; Garden area; Level lot
Interior
- Bedrooms: 4 bedrooms
- Bathrooms: 4 full bathrooms
- Heating & cooling: Hot air heating; Natural gas hot water with tankless domestic hot water
- Interior features: 12 total rooms; Full, unfinished basement; Attic with hatch access
Neighborhood map
What this means for you Summary
Snapshot
- This is a 4 × 4-bed/4.0-bath units multifamily listed at $350k.
Deal economics
- At list price, monthly cash flow is $5k ($59k/yr) — positive. Per door: $1k/mo.
- The deal already cash-flows at list — no discount required.
- Meets the 1% rule at list price ($9k rent vs $350k).
- Cap rate 23.1% vs local median 5.3% in Thompsonville — top-decile yield for the area; either an underpriced asset or a hidden risk that comps aren't pricing in. Stress-test before assuming the spread holds.
Location & tenants
- Location reads 69/100 on livability (#103 in CT) — a middle-class / working-renter tenant base. Strengths: health & safety A+, housing A, crime B+; Watch: amenities F, commute F, employment D-.
- Enfield School District (suburban): math 25% / reading 41% proficiency, ranked #114 of 153 in CT (top 74%) — families likely to look elsewhere, expect single-tenant / working-renter base with shorter leases.
- Market conditions: Rents rising (+3.9%/yr); 182 active listings in the ZIP; 1 comparable units currently listed for rent nearby; solid renter incomes; 1,867 units permitted in Capitol Planning Region in 2024 (1,399 in 5+ unit buildings).
- At $9,345/mo this rent would consume 124% of the median local household income ($90k/yr) (locally 954% of renters already pay >50% of income on rent) — very limited rent-growth headroom before tenants either downsize or default.
Forward outlook
- Local home prices are declining (-3.0%/yr); year-one equity from $2k of loan paydown is wiped out by about $10k of value loss. Plan a longer hold.
- At projected returns (-3.0% appreciation + 3.9% rent growth), your $98k cash investment doubles in ~2 years — after that, you're playing with house money.
Negotiation context
- Only 8 days on market — expect competitive offers; lowballing is unlikely to land.
- Current owner paid $50k; list at $350k implies a 593% gain — meaningful room to come down on a strong offer.
Risks & watch-outs
- Watch-outs: built in 1900 — expect roof / HVAC / electrical / plumbing capex.
- Climate carrying-cost: major wind risk, 27% chance of damaging wind over 30y; extreme-heat days projected 7→15/yr by 2055 (HVAC capex compounding) — expect insurance premiums to compound above CPI over the hold.
Questions for the listing agent
- Can we see the unit-by-unit rent roll, current vacancy, and any below-market leases? What's the average tenancy length?
- What capital expenditures (roof, boiler, parking lot, exteriors) have been made in the last 5 years, and what's planned in the next 2?
- Built in 1900 — when were the roof, HVAC, electrical panel, plumbing, and water heater last replaced?
- Is there a deadline driving the sale (1031 exchange, divorce, estate, relocation)? That informs how much negotiation room exists.
- What's the average days-on-market for RENTAL listings here right now (not sales)? A rising rental-DOM trend means longer vacancies and softer asking-rent achievability than the comps imply.
- What's the recent tenant-quality profile in this submarket — average credit score on applications, eviction rate, late-payment / NSF rate, and stable-employment percentage? A property-management company in the area should have these aggregated.
- How much new apartment / multifamily construction is in the pipeline within 1–3 miles? Heavy new supply (>2% of stock underway) typically softens rents 12–24 months out; light construction supports rent growth.
Investment metrics
- 1% rule
- 2.67% ✓
- Cap rate
- 23.13%
- Cash-on-cash
- 60.13%
- DSCR
- 3.68
- GRM
- 3.1
CMA / ARV
- ARV (on-the-fly)
- $406,215
- Comps found
- 6
Show comp detail 6 sales within ~0.75 mi
| Address | Dist | Beds/Ba | Sqft | Sold | Price | $/sf | Match |
|---|---|---|---|---|---|---|---|
| 87 Pleasant St | 0.18mi | 4/4.0 | 2,968 (-1%) | 20mo | $399,900 | $135 | 73 |
| 60 Lincoln St | 0.12mi | 4/2.0 | 2,716 (-10%) | 3mo | $300,000 | $110 | 68 |
| 86 Windsor St | 0.27mi | 5/3.0 (+1) | 2,560 (-15%) | 5mo | $385,000 | $150 | 49 |
| 41 Windsor St | 0.16mi | 5/4.0 (+1) | 3,420 (+14%) | 19mo | $289,250 | $85 | 49 |
| 25 Prospect St | 0.30mi | 5/3.0 (+1) | 2,650 (-12%) | 13mo | $270,000 | $102 | 46 |
| 41 Walnut St | 0.43mi | 5/2.0 (+1) | 2,618 (-13%) | 0mo | $355,000 | $136 | 45 |
Match score weights: distance 35% · size 25% · config 20% · recency 20%. Top-matched comps best support the ARV.
Projected returns pro-forma
-3.0% appreciation · 3.9% rent growth · sell at horizon
- IRR
- 59.9%
- Equity multiple
- 3.70×
- Total profit
- $264,682
- Equity at exit
- $52,171
- IRR
- 64.9%
- Equity multiple
- 7.83×
- Total profit
- $669,484
- Equity at exit
- $30,253
Cash invested: $97,972 (down + closing). Projections, not guarantees.
Landlord ↔ Tenant lean methodology
- Overall (STATE)
- 27 Tenant-Leaning
- State Connecticut
- 27 Tenant-Leaning · D+7
- County
- — inherits STATE
- City
- — inherits STATE
ZIP-level market 06082
- Rents YoY
- 3.9%
- Active inventory
- 182
- Price-to-rent
- 12.5×
Monthly cashflow live
- Estimated rent
- $9,345 medium interval (Pro) →
- Mortgage (P&I)
- −$1,835
- Tax from tax record
- −$493 /mo · $5,912/yr
- Insurance
- −$146
- HOA
- −$0
- Vacancy / Maint / Mgmt
- −$1,962
- Net cashflow
- $4,909
Break-even live
4-unit breakdown (identical units grouped — click to expand)
| Units | Beds | Baths | Est. rent |
|---|---|---|---|
| 4× units | 4 | 4 | $9,344 |
| #1 | 4 | 4 | $2,336 |
| #2 | 4 | 4 | $2,336 |
| #3 | 4 | 4 | $2,336 |
| #4 | 4 | 4 | $2,336 |
| Total (4 units) | $9,345 | ||
UW: 25.0% down · 7.5% · 30yr · 1.5% tax · 5.0% vac · 8.0% maint · 8.0% mgmt
Financing live
Cash to close
- Down payment
- $87,475
- Closing costs
- $10,497
- Reserves months
- —
- Total cash needed
- —
Loan-product check · same deal, 3 products live
Conventional
25% down · 7.5% · 30yr
- Down + closing
- —
- Monthly P&I
- —
- Monthly cashflow
- —
- DSCR
- —
- Eligible?
- —
Personal DTI + credit; lowest rate.
DSCR
20% down · 8.5% · 30yr
- Down + closing
- —
- Monthly P&I
- —
- Monthly cashflow
- —
- DSCR
- —
- Eligible?
- —
No personal income docs; deal must DSCR.
Hard money
10% down · 12.0% · 12mo
- Down + closing
- —
- Monthly P&I
- —
- Monthly cashflow
- —
- DSCR
- —
- Eligible?
- —
Short-term bridge; refi at stabilization.
Rent comps 1 comps
| Address | Beds | Baths | Sqft | Rent | $/sqft | DOM | Units | Dist |
|---|---|---|---|---|---|---|---|---|
| 21 Meadow Wood Dr Suffield, CT | 4.0 | 3.5 | 3416 | $6,250 | $1.83 | 1d | 1 | 1.21mi |
Listing history 7 events
-
2026-06-13statusdays on market $349,900 Under Contract 8 DOM
-
2026-06-10days on market $349,900 Active 7 DOM
-
2026-06-09days on market $349,900 Active 6 DOM
-
2026-06-08days on market $349,900 Active 5 DOM
-
2026-06-07days on market $349,900 Active 4 DOM
-
2026-06-05remarks 234-char remark
-
2026-06-05$349,900 Active 1 DOM
ⓘ Source: listings_history table (triggers on properties + properties_extension) + one-shot
backfill from property_details.listing_events for pre-trigger history.
Tax reassessment forecast CT · Partial reset (capped growth)
- Current annual tax
- $5,912 · $493/mo
- Projected year-2 tax
- $6,700 · $558/mo
- Expected delta
- +$788/yr (+$66/mo · 13.3%)
ⓘ Screening estimate from a state-policy table — verify with the county assessor before closing.
Climate risk First Street
- Flood 1/10 Low FEMA zone X (unshaded) · 0% chance over 30 yrs
- Wildfire 3/10 Moderate
- Heat 5/10 Major 7 d/yr ≥98°F today · 15 d/yr by 30 yrs out
- Wind 6/10 Major 27% chance of damaging wind over 30 yrs
- Air quality 3/10 Moderate 2 unhealthy d/yr today · 3 by 30 yrs out
Nearby sold comps map
Loading sold comps map…
Walkable amenities ~0.75 mi
Loading nearby amenities…
Taxation est. · year 1
- Rental income
- $112,140
- − Mortgage interest
- −$19,600
- − Property taxes
- −$5,912
- − Insurance
- −$1,750
- − Repairs & maintenance
- −$8,971
- − Management
- −$8,971
- − Depreciation
- −$10,179
- Taxable income
- $56,757
- Est. tax owed @ 24.0%
- −$13,622
- After-tax cash flow
- $45,288/yr
For passive investors: Depreciation is non-cash, so a rental often shows a tax loss while cash-flowing — sheltering income. Rental losses are passive: they offset passive income freely, and up to $25,000/yr can offset ordinary (W-2) income if you actively participate and your MAGI is under $100k (phasing out to $0 by $150k); unused losses carry forward. On sale, claimed depreciation is recaptured at up to 25%, and gains may owe capital-gains tax (a 1031 exchange can defer both). Figures are a year-1 estimate at your 24.0% rate — not tax advice; consult a CPA.
Schools (NCES district)
- District
- Enfield School District
- NCES district ID
- 0901470
- Math proficiency
- 25% ▼ -14.00%
- Reading proficiency
- 41% ▼ -10.00%
- Median HH income
- $68,750
- Composite
- 30.42/100
- National rank
- #6238
- State rank
- #114 of 153 in CT
Livability — Thompsonville
- Score
- 69/100
- State rank
- #103
- US rank
- #8941
Category grades
Schools grade is shown separately in the Schools card above.
Census & demographics
- Census place
- Thompsonville, CT
- County
- Hartford County · 754,208 people
- Metro
- Hartford-East Hartford-Middletown, CT
- Population (ZIP)
- 41,090
- Household income
- $90,404
- Rent vs Own
- Severe rent burden
- 954.0
Population outlook (Capitol County) Hauer SSP2
- By 2040
- 1,063,519
Race, ethnicity, and origin ACS 2023
- Neighborhood character
- Predominantly White (76%)
- Race & ethnicity
- White 76% Hispanic / Latino 11% Two or more races 9% Black 5% Asian 2%
- Hispanic origin (detail)
- Mexican 1% Puerto Rican 7%
- Common ancestry
- Romanian 10% Lithuanian 9% Slovak 2%
- Foreign-born
- 6% · Canada, Jamaica
- Languages at home
- 89% English-only · Spanish 5% Other Indo-European 2% Russian/Polish/Slavic 1%
Political lean MEDSL · Capitol
- 2024 margin
- Strong D (+21.9) · D 60.1% · R 38.2% · Other 1.7%
- All cycles
- 2024: D+21.9
Not yet ingested
- Civics
- —
Market trends
- HPI YoY
- ▼ -494.72%
- Current HPI
- 192.4011
- Rent YoY
- ▲ 3.90%
- Metro
- Hartford-East Hartford-Middletown, CT
- State GDP YoY
- ▲ 1.06%
- F500 in state
- 38
Industry mix (Fortune 500 HQ in CT)
| Industry | F500 HQs | Revenue |
|---|---|---|
| Industrial Machinery | 4 | $38B |
|
||
| Insurance | 3 | $71B |
|
||
| Financial Services | 2 | $25B |
|
||
| Transportation / Logistics | 2 | $18B |
|
||
| Healthcare | 1 | $247B |
|
||
| Telecommunications | 1 | $55B |
|
||
Price history
+592.9% since first listed2 events — show timeline
- 2026-06-03 Listed $349,900 Smart MLS
- 1984-09-14 Sold (Public Records) $50,500 Public Records
Property tax history
+1.9%/yrLatest (2025): $5,912 · +2.7% YoY. Source: county tax records.
Cash-flow waterfall
monthlySold comps — $/sqft
last 12 mo · ≤1 miLoading sold comps…