240 Roosevelt Dr Plan · Richfield, MI
Flood risk No data
- FEMA flood zone
- —
- Chance of flooding over 30 yrs
- —
- Est. flood insurance / yr
- —
Fire risk No data
- Est. fire insurance / yr
- —
Heat risk No data
- Hot days now (above threshold)
- —
- Hot days in 30 yrs
- —
Wind risk No data
- Chance of severe wind over 30 yrs
- —
Air-quality risk No data
- Unhealthy air days now
- —
- Unhealthy air days in 30 yrs
- —
Risk factors via First Street. Map © Google.
Why this score? — see what drove the C+ grade
The composite is a weighted blend of 9 inputs, each scored 0–100. Each bar is that input's sub-score; the figure is the points it added to the 100-point composite (weight × sub-score).
- Cash flow +26.3/30.0
- DSCR +8.9/10.0
- ARV discount +7.5/15.0
- 1% rule +7.0/10.0
- Schools +4.1/10.0
- Condition / age +4.0/5.0
- Rent growth +2.5/5.0
- Livability +2.5/5.0
- Appreciation +0.0/10.0
$112,995
🖨 Deal sheet 📄 Offer letter ✓ Due diligence
Listing remarks
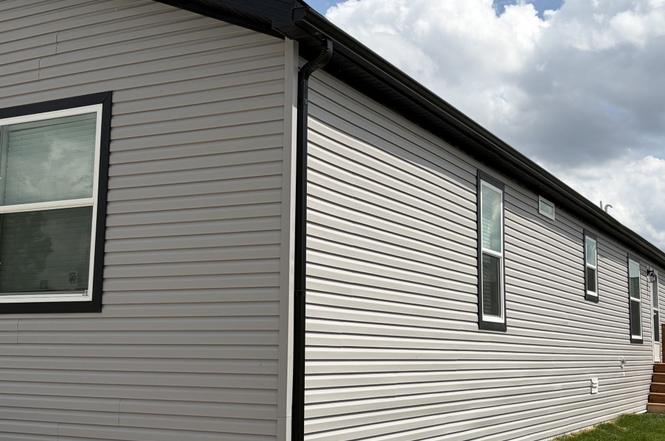
This brand new 3-bedroom, 2-bath home arriving in the heart of mid-spring feels like a fresh beginning wrapped in comfort and style. From the moment you walk in, you re greeted by an airy, open-concept design. Nestled within the highly sought-after Davison School District, this home brings not just beauty, but location to love as well. As this home is being prepared just for you, finishes such as carpet and cabinet colors may vary from photos making each home uniquely yours. Your next chapter is waiting Home will be ready in August. Click the Apply Now button today to begin your journey home.
Key facts
- Open-concept design
Tags
Property features AI
Finance
- Other: Listing status: Active; Plan name: 240 Roosevelt Dr; Inventory type: Plan
- Financial info: List price $112,995
Exterior
- Home design: Single-family plan home; Address on Roosevelt Drive in Davison, facing north (N prefix)
- Exterior features: Living area of 1,568 (interior living space)
Interior
- Bedrooms: 3 bedrooms
- Bathrooms: 2 bathrooms
- Interior features: Plan home (new construction plan)
Neighborhood map
What this means for you Summary
Snapshot
- This is a 3-bed/2.0-bath manufactured listed at $113k. Condition is rated good.
Deal economics
- At list price, monthly cash flow is $292 ($4k/yr) — positive.
- The deal already cash-flows at list — no discount required.
- Meets the 1% rule at list price ($1k rent vs $113k).
Location & tenants
- Location reads: area grade C — affects rentability + tenant quality, not the cash-flow math above.
- Davison Community Schools (suburban): math 40% / reading 57% proficiency, ranked #117 of 540 in MI (top 22%) — families likely to look elsewhere, expect single-tenant / working-renter base with shorter leases.
- Market conditions: 221 active listings in the ZIP; 1 comparable units currently listed for rent nearby; 419 units permitted in Genesee County in 2024 (68 in 5+ unit buildings).
Forward outlook
- Local home prices are declining (-3.0%/yr); year-one equity from $781 of loan paydown is wiped out by about $3k of value loss. Plan a longer hold.
- Genesee County population projected at -27% by 2050 — secular population decline; favor cash flow + early exit over multi-decade hold.
- At projected returns (-3.0% appreciation + 3.0% rent growth), your $32k cash investment doubles in ~10 years — after that, you're playing with house money.
Negotiation context
- Only 1 days on market — expect competitive offers; lowballing is unlikely to land.
Questions for the listing agent
- Is there a deadline driving the sale (1031 exchange, divorce, estate, relocation)? That informs how much negotiation room exists.
- What's the average days-on-market for RENTAL listings here right now (not sales)? A rising rental-DOM trend means longer vacancies and softer asking-rent achievability than the comps imply.
- What's the recent tenant-quality profile in this submarket — average credit score on applications, eviction rate, late-payment / NSF rate, and stable-employment percentage? A property-management company in the area should have these aggregated.
- How much new for-sale + rental construction is in the pipeline within 1–3 miles? Heavy new supply typically softens prices + rents 12–24 months out; constrained supply supports both.
Investment metrics
- 1% rule
- 1.20% ✓
- Cap rate
- 9.40%
- Cash-on-cash
- 11.08%
- DSCR
- 1.49
- GRM
- 6.9
CMA / ARV
No comps found within radius.
Projected returns pro-forma
-3.0% appreciation · 3.0% rent growth · sell at horizon
- IRR
- 0.3%
- Equity multiple
- 1.01×
- Total profit
- $319
- Equity at exit
- $16,848
- IRR
- 9.9%
- Equity multiple
- 1.77×
- Total profit
- $24,323
- Equity at exit
- $9,770
Cash invested: $31,639 (down + closing). Projections, not guarantees.
Landlord ↔ Tenant lean methodology
- Overall (STATE)
- 62 Landlord-Friendly
- State Michigan
- 62 Landlord-Friendly · EVEN
- County
- — inherits STATE
- City
- — inherits STATE
ZIP-level market 48423
- Active inventory
- 221
- Price-to-rent
- 6.9×
Monthly cashflow live
- Estimated rent
- $1,358 medium interval (Pro) →
- Mortgage (P&I)
- −$593
- Tax est. 1.5%
- −$141 /mo · $1,695/yr
- Insurance
- −$47
- HOA
- −$0
- Vacancy / Maint / Mgmt
- −$285
- Net cashflow
- $292
Break-even live
UW: 25.0% down · 7.5% · 30yr · 1.5% tax · 5.0% vac · 8.0% maint · 8.0% mgmt
Financing live
Cash to close
- Down payment
- $28,249
- Closing costs
- $3,390
- Reserves months
- —
- Total cash needed
- —
Loan-product check · same deal, 3 products live
Conventional
25% down · 7.5% · 30yr
- Down + closing
- —
- Monthly P&I
- —
- Monthly cashflow
- —
- DSCR
- —
- Eligible?
- —
Personal DTI + credit; lowest rate.
DSCR
20% down · 8.5% · 30yr
- Down + closing
- —
- Monthly P&I
- —
- Monthly cashflow
- —
- DSCR
- —
- Eligible?
- —
No personal income docs; deal must DSCR.
Hard money
10% down · 12.0% · 12mo
- Down + closing
- —
- Monthly P&I
- —
- Monthly cashflow
- —
- DSCR
- —
- Eligible?
- —
Short-term bridge; refi at stabilization.
Rent comps 1 comps
| Address | Beds | Baths | Sqft | Rent | $/sqft | DOM | Units | Dist |
|---|---|---|---|---|---|---|---|---|
| 4250 N State Rd Davison, MI | 2.0–3.0 | 1.0–2.0 | 1122 | $1,399 | $1.25 | 1d | 1 | 0.02mi |
Listing history 2 events
-
2026-06-18remarks 599-char remark
-
2026-06-18$112,995 Active 1 DOM
ⓘ Source: listings_history table (triggers on properties + properties_extension) + one-shot
backfill from property_details.listing_events for pre-trigger history.
Nearby sold comps map
Loading sold comps map…
Walkable amenities ~0.75 mi
Loading nearby amenities…
Taxation est. · year 1
- Rental income
- $16,300
- − Mortgage interest
- −$6,329
- − Property taxes
- −$1,695
- − Insurance
- −$565
- − Repairs & maintenance
- −$1,304
- − Management
- −$1,304
- − Depreciation
- −$3,287
- Taxable income
- $1,815
- Est. tax owed @ 24.0%
- −$436
- After-tax cash flow
- $3,070/yr
For passive investors: Depreciation is non-cash, so a rental often shows a tax loss while cash-flowing — sheltering income. Rental losses are passive: they offset passive income freely, and up to $25,000/yr can offset ordinary (W-2) income if you actively participate and your MAGI is under $100k (phasing out to $0 by $150k); unused losses carry forward. On sale, claimed depreciation is recaptured at up to 25%, and gains may owe capital-gains tax (a 1031 exchange can defer both). Figures are a year-1 estimate at your 24.0% rate — not tax advice; consult a CPA.
Condition & rehab AI · 4 photos
This brand new 3-bedroom, 2-bath home is move-in ready with a good condition score and minimal maintenance required. The home's location and design make it an attractive option for both buyers and renters.
Value-add opportunities
- Both Painting the interior walls — Fresh paint can enhance the home's curb appeal and interior aesthetics.
- Both Updating the flooring — New flooring can improve the home's appearance and increase its value.
- Both Upgrading the kitchen appliances — Modern appliances can make the kitchen more functional and appealing to potential buyers/renters.
- Both Landscaping improvements — A well-maintained yard can enhance the home's curb appeal and attract more potential buyers/renters.
Renovation cost estimate screening
Value-add ROI direction
- Both Painting the interior walls — Fresh paint can enhance the home's curb appeal and interior aesthetics. ↑
- Both Updating the flooring — New flooring can improve the home's appearance and increase its value. ↑
- Both Upgrading the kitchen appliances — Modern appliances can make the kitchen more functional and appealing to potential buyers/renters. ↑
- Both Landscaping improvements — A well-maintained yard can enhance the home's curb appeal and attract more potential buyers/renters. ↑
ⓘ Cost ranges are severity-bucket heuristics (US national rule-of-thumb). Get contractor quotes + a written scope before underwriting a rehab budget.
Schools (NCES district)
- District
- Davison Community Schools
- NCES district ID
- 2611430
- Math proficiency
- 40% ▼ -8.00%
- Reading proficiency
- 57% ▼ -5.00%
- Median HH income
- $49,102
- Composite
- 41.39/100
- National rank
- #3479
- State rank
- #117 of 540 in MI
Livability — Richfield
No livability data for this city. (Only ~50 U.S. cities are tracked.)
Census & demographics
- County
- Genesee County · 221,329 people
- Metro
- Flint, MI
- Population (ZIP)
- 33,757
- Household income
- $65,079
- Rent vs Own
- Severe rent burden
- 1394.0
Population outlook (Genesee County) Hauer SSP2
- Today (2025)
- 381,312 people
- By 2030
- 362,731 · -4.9%
- By 2040
- 321,550 · -15.7%
- By 2050
- 279,212 · -26.8%
- By 2075
- 193,336 · -49.3%
- By 2100
- 128,118 · -66.4%
Race, ethnicity, and origin ACS 2023
- Neighborhood character
- Predominantly White (90%)
- Race & ethnicity
- White 90% Two or more races 5% Hispanic / Latino 4% Black 2%
- Common ancestry
- Romanian 10% Lithuanian 4% Italian 3%
- Foreign-born
- 2% · Canada
- Languages at home
- 97% English-only · Spanish 1% Russian/Polish/Slavic 1%
Political lean MEDSL · Genesee
- 2024 margin
- Toss-up / Even · D 51.4% · R 47.2% · Other 1.4%
- 2008→2024 swing
- -28.3pp toward R · 2008: 32.5pp · 2024: 4.2pp
- All cycles
- 2024: D+4.2 2020: D+9.3 2016: D+9.5 2012: D+28.2 2008: D+32.5
Not yet ingested
- Civics
- —
Market trends
- HPI YoY
- ▼ -226.14%
- Current HPI
- 228.684
- Rent YoY
- —
- Metro
- Flint, MI
- State GDP YoY
- ▲ 1.37%
- F500 in state
- 28
Industry mix (Fortune 500 HQ in MI)
| Industry | F500 HQs | Revenue |
|---|---|---|
| Automotive Parts | 3 | $48B |
|
||
| Automotive | 2 | $372B |
|
||
| Chemicals | 1 | $45B |
|
||
| Automotive Retail | 1 | $29B |
|
||
| Healthcare / Medical Devices | 1 | $23B |
|
||
| Automotive Technology | 1 | $20B |
|
||
Cash-flow waterfall
monthlySold comps — $/sqft
last 12 mo · ≤1 miLoading sold comps…