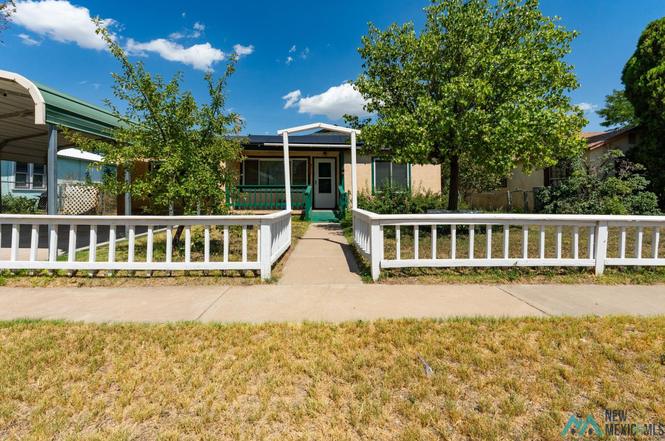
124 N Globe Ave · Portales, NM
Flood risk 1/10 · Minimal
- FEMA flood zone
- X (unshaded)
- Chance of flooding over 30 yrs
- 0.0%
- Est. flood insurance / yr
- $507 – $1,088
Fire risk 8/10 · Major
- Est. fire insurance / yr
- $706 – $1,312
Heat risk 5/10 · Moderate
- Hot days now (above 98°F)
- 7 days/yr
- Hot days in 30 yrs
- 18 days/yr
Wind risk 2/10 · Minimal
- Chance of severe wind over 30 yrs
- —
Air-quality risk 1/10 · Minimal
- Unhealthy air days now
- 0 days/yr
- Unhealthy air days in 30 yrs
- 0 days/yr
Risk factors via First Street. Map © Google.
Why this score? — see what drove the D grade
The composite is a weighted blend of 9 inputs, each scored 0–100. Each bar is that input's sub-score; the figure is the points it added to the 100-point composite (weight × sub-score).
- Cash flow +15.2/30.0
- ARV discount +7.5/15.0
- DSCR +4.7/10.0
- Rent growth +3.8/5.0
- Livability +3.2/5.0
- Schools +3.1/10.0
- 1% rule +3.0/10.0
- Condition / age +2.5/5.0
- Appreciation +0.0/10.0
$143,000
🖨 Deal sheet (PDF) 📄 Offer letter ✓ Due diligence
Listing remarks
This charming home has a few surprises. Welcome to 124 N Globe. Outside you are greeted by mature landscaping with producing fruit and pistachio trees. The covered carport offers protection from the summer sun and inclement weather. A covered front porch welcomes your guests as they arrive. Inside you are greeted by space. The two living rooms offer multipurpose options, have 2 sitting areas, a large dining area or office space. The bedrooms can fit beds and furniture adequately. The icing on the cake, this house features solar panels that will be paid off at closing making utilities affordable. Adorable and affordable. Call today for your private viewing, or click the virtual tour link to
Key facts
- Covered front porch
- Covered carport
- Pistachio trees
Tags
Property features AI
Exterior
- Parking: Detached carport; 1 covered parking space; 1 garage space (detached)
- Utilities: Public water; Sewer connected; Electricity connected; Natural gas connected; Natural gas available
- Home design: Single-family residence; One story
- Construction: Frame construction; Shingle roof
- Exterior features: Fenced backyard; Patio
Interior
- Kitchen: Free-standing range; Dishwasher; Refrigerator; Water heater
- Flooring: Carpet; Laminate
- Bathrooms: 2 full bathrooms
- Heating & cooling: Forced air heating; Electric cooling
- Interior features: Aluminum-framed windows with blinds; Patio
- Laundry & utility: Washer; Dryer
Neighborhood map
What this means for you Summary
Snapshot
- This is a 3-bed/2.0-bath other listed at $143k.
Deal economics
- At list price, monthly cash flow is $51 ($612/yr) — positive.
- The deal already cash-flows at list — no discount required.
- To meet the 1% rule (rent ≥ 1% of price), the offer needs to be $115k (19.8% below list).
- Recommended offer: $115k (19.8% below list) — sets the bar for 1% rule.
Location & tenants
- Location reads 64/100 on livability (#63 in NM) — a middle-class / working-renter tenant base. Strengths: cost of living A+, health & safety A+, housing A-; Watch: crime F, amenities F, commute F.
- Portales Municipal Schools (town): math 17% / reading 57% proficiency, ranked #15 of 29 in NM (top 52%) — families likely to look elsewhere, expect single-tenant / working-renter base with shorter leases; 62% free/reduced lunch — lower-income household profile, screen leases tightly.
- Zoned schools: Valencia Elementary (math 17% / reading 64%, grade F, #33 of 68 statewide, top 48%, 389 students, 62% FRL); Portales Jr High (math 11% / reading 56%, grade F, #9 of 27 statewide, top 31%, 408 students, 60% FRL); Portales High (math 22% / reading 37%, grade F, #78 of 110 statewide, top 74%, 807 students, 59% FRL) — zoned schools at 60% FRL track the district average.
- Market conditions: Rents rising fast (+5.4%/yr); 128 active listings in the ZIP; 4 comparable units currently listed for rent nearby; rentals lingering (median 46d on market — plan ~5-8 weeks vacancy on turnover, expect pricing pressure); 100% of comp listings sitting > 30 days — soft ceiling on asking rent; 31 units permitted in Roosevelt County in 2024 (0 in 5+ unit buildings).
Forward outlook
- Local home prices are declining (-3.0%/yr); year-one equity from $989 of loan paydown is wiped out by about $4k of value loss. Plan a longer hold.
- Roosevelt County population projected at -28% by 2050 — secular population decline; favor cash flow + early exit over multi-decade hold.
Negotiation context
- It's been on market 266 days — a 12% lower offer ($126k) is reasonable based on typical stale-listing flexibility.
Risks & watch-outs
- Climate carrying-cost: severe wildfire risk; extreme-heat days projected 7→18/yr by 2055 (HVAC capex compounding) — expect insurance premiums to compound above CPI over the hold.
Questions for the listing agent
- It's been on market 266 days. Have you received any prior offers? Is the seller open to a 20% concession, seller financing, or rate buy-down credit?
- Why hasn't it sold? Are there any deal-killer items the seller is aware of (foundation, flood, title, zoning, code violations)?
- Is there a deadline driving the sale (1031 exchange, divorce, estate, relocation)? That informs how much negotiation room exists.
- Schools are F-rated, which usually means shorter tenancies and higher turnover. Who's the typical renter profile here, and what's been the actual vacancy rate?
- Crime grade is F in this area — have there been break-ins, vandalism, or insurance claims at this property in the last 3 years? What carrier currently insures it and at what premium?
- The area grade is low — what's the realistic commute time and amenity access for the typical tenant pool here? Any planned neighborhood developments (good or bad) we should know about?
- What's the average days-on-market for RENTAL listings here right now (not sales)? A rising rental-DOM trend means longer vacancies and softer asking-rent achievability than the comps imply.
- What's the recent tenant-quality profile in this submarket — average credit score on applications, eviction rate, late-payment / NSF rate, and stable-employment percentage? A property-management company in the area should have these aggregated.
- How much new for-sale + rental construction is in the pipeline within 1–3 miles? Heavy new supply typically softens prices + rents 12–24 months out; constrained supply supports both.
Investment metrics
- 1% rule
- 0.80% ✗
- Cap rate
- 6.72%
- Cash-on-cash
- 1.53%
- DSCR
- 1.07
- GRM
- 10.4
CMA / ARV
No comps found within radius.
Projected returns pro-forma
-3.0% appreciation · 5.38% rent growth · sell at horizon
- IRR
- -11.6%
- Equity multiple
- 0.57×
- Total profit
- $-17,177
- Equity at exit
- $21,322
- IRR
- 0.4%
- Equity multiple
- 1.03×
- Total profit
- $1,073
- Equity at exit
- $12,364
Cash invested: $40,040 (down + closing). Projections, not guarantees.
Landlord ↔ Tenant lean methodology
- Overall (STATE)
- 55 Moderately Landlord-Leaning
- State New Mexico
- 55 Moderately Landlord-Leaning · D+3
- County
- — inherits STATE
- City
- — inherits STATE
ZIP-level market 88130
- Rents YoY
- 5.4%
- Active inventory
- 128
- Price-to-rent
- 10.4×
Monthly cashflow live
- Estimated rent
- $1,146 medium interval (Pro) →
- Mortgage (P&I)
- −$750
- Tax from tax record
- −$45 /mo · $542/yr
- Insurance
- −$60
- HOA
- −$0
- Vacancy / Maint / Mgmt
- −$241
- Net cashflow
- $51
Break-even live
Sensitivity live
| Price | -10% $132 | -5% $91 | +0% $51 | +5% $11 | +10% $-30 |
|---|---|---|---|---|---|
| Rent | -10% $-40 | -5% $6 | +0% $51 | +5% $96 | +10% $142 |
| Rate | -1.0pp $123 | -0.5pp $87 | base $51 | +0.5pp $14 | +1.0pp $-24 |
UW: 25.0% down · 7.5% · 30yr · 1.5% tax · 5.0% vac · 8.0% maint · 8.0% mgmt
Financing live
Cash to close
- Down payment
- $35,750
- Closing costs
- $4,290
- Reserves months
- —
- Total cash needed
- —
Loan-product check · same deal, 3 products live
Conventional
25% down · 7.5% · 30yr
- Down + closing
- —
- Monthly P&I
- —
- Monthly cashflow
- —
- DSCR
- —
- Eligible?
- —
Personal DTI + credit; lowest rate.
DSCR
20% down · 8.5% · 30yr
- Down + closing
- —
- Monthly P&I
- —
- Monthly cashflow
- —
- DSCR
- —
- Eligible?
- —
No personal income docs; deal must DSCR.
Hard money
10% down · 12.0% · 12mo
- Down + closing
- —
- Monthly P&I
- —
- Monthly cashflow
- —
- DSCR
- —
- Eligible?
- —
Short-term bridge; refi at stabilization.
Rent comps 4 comps
| Address | Beds | Baths | Sqft | Rent | $/sqft | DOM | Units | Dist |
|---|---|---|---|---|---|---|---|---|
| 506 E 1st St Portales, NM | 3.0 | 1.0 | 1100 | $675 | $0.61 | 46d | 1 | 0.49mi |
| 312 North Avenue B Portales, NM | 3.0 | 3.0 | 1500 | $1,250 | $0.83 | 45d | 1 | 0.85mi |
| 1700 South Avenue B Unit B Portales, NM | 3.0 | 2.0 | 1706 | $1,800 | $1.06 | 45d | 1 | 1.17mi |
| 1802 South Avenue A Unit A Portales, NM | 3.0 | 2.0 | 1570 | $1,150 | $0.73 | 45d | 1 | 1.26mi |
Listing history 2 events
-
2026-04-30status Pending
-
2025-08-06$143,000 Active
ⓘ Source: listings_history table (triggers on properties + properties_extension) + one-shot
backfill from property_details.listing_events for pre-trigger history.
Tax reassessment forecast NM · Resets to sale price
- Current annual tax
- $542 · $45/mo
- Projected year-2 tax
- $1,144 · $95/mo
- Expected delta
- +$602/yr (+$50/mo · 111.2%)
ⓘ Screening estimate from a state-policy table — verify with the county assessor before closing.
Climate risk First Street
- Flood 1/10 Low FEMA zone X (unshaded) · 0% chance over 30 yrs
- Wildfire 8/10 Severe
- Heat 5/10 Major 7 d/yr ≥98°F today · 18 d/yr by 30 yrs out
- Wind 2/10 Low
- Air quality 1/10 Low 0 unhealthy d/yr today · 0 by 30 yrs out
Nearby sold comps map
Loading sold comps map…
Walkable amenities ~0.75 mi
Loading nearby amenities…
Taxation est. · year 1
- Rental income
- $13,757
- − Mortgage interest
- −$8,010
- − Property taxes
- −$542
- − Insurance
- −$715
- − Repairs & maintenance
- −$1,101
- − Management
- −$1,101
- − Depreciation
- −$4,160
- Taxable loss
- −$1,871
- Est. tax savings @ 24.0%
- +$449
- After-tax cash flow
- $1,061/yr
For passive investors: Depreciation is non-cash, so a rental often shows a tax loss while cash-flowing — sheltering income. Rental losses are passive: they offset passive income freely, and up to $25,000/yr can offset ordinary (W-2) income if you actively participate and your MAGI is under $100k (phasing out to $0 by $150k); unused losses carry forward. On sale, claimed depreciation is recaptured at up to 25%, and gains may owe capital-gains tax (a 1031 exchange can defer both). Figures are a year-1 estimate at your 24.0% rate — not tax advice; consult a CPA.
Schools (NCES district)
- District
- Portales Municipal Schools
- NCES district ID
- 3502100
- Math proficiency
- 17% ▼ -5.00%
- Reading proficiency
- 57% ▲ 20.00%
- Median HH income
- $36,151
- Composite
- 30.52/100
- National rank
- #6209
- State rank
- #15 of 29 in NM
Livability — Portales
- Score
- 64/100
- State rank
- #63
- US rank
- #13640
Category grades
Schools grade is shown separately in the Schools card above.
Census & demographics
- Census place
- Portales, NM
- County
- Roosevelt County · 17,842 people
- City population
- 17,842
- Metro
- Portales, NM
- Population (ZIP)
- 17,842
- Household income
- $52,434
- Rent vs Own
- Severe rent burden
- 574.0
Population outlook (Roosevelt County) Hauer SSP2
- Today (2025)
- 16,821 people
- By 2030
- 15,818 · -6.0%
- By 2040
- 13,766 · -18.2%
- By 2050
- 12,152 · -27.8%
- By 2075
- 9,601 · -42.9%
- By 2100
- 8,241 · -51.0%
Race, ethnicity, and origin ACS 2023
- Neighborhood character
- Diverse neighborhood (Simpson 0.57)
- Race & ethnicity
- White 48% Hispanic / Latino 45% Two or more races 18% Native American 1%
- Hispanic origin (detail)
- Mexican 39% Puerto Rican 1%
- Common ancestry
- Italian 2% Slovak 2% Serbian 1%
- Foreign-born
- 6% · Canada
- Languages at home
- 78% English-only · Spanish 21%
Political lean MEDSL · Roosevelt
- 2024 margin
- Solid R (+43.2) · D 27.4% · R 70.6% · Other 2.0%
- 2008→2024 swing
- -13.3pp toward R · 2008: -29.9pp · 2024: -43.2pp
- All cycles
- 2024: R+43.2 2020: R+42.9 2016: R+41.3 2012: R+38.9 2008: R+29.9
Not yet ingested
- Civics
- —
Market trends
- HPI YoY
- ▼ -154.72%
- Current HPI
- 108.0555
- Rent YoY
- ▲ 5.38%
- Metro
- Portales, NM
- State GDP YoY
- —
- F500 in state
- 0
Price history
2 events — show timeline
- 2026-04-30 Pending — NMMLS
- 2025-08-06 Listed $143,000 NMMLS
Property tax history
+2.2%/yrLatest (2025): $542 · +2.0% YoY. Source: county tax records.
Cash-flow waterfall
monthlySold comps — $/sqft
last 12 mo · ≤1 miLoading sold comps…