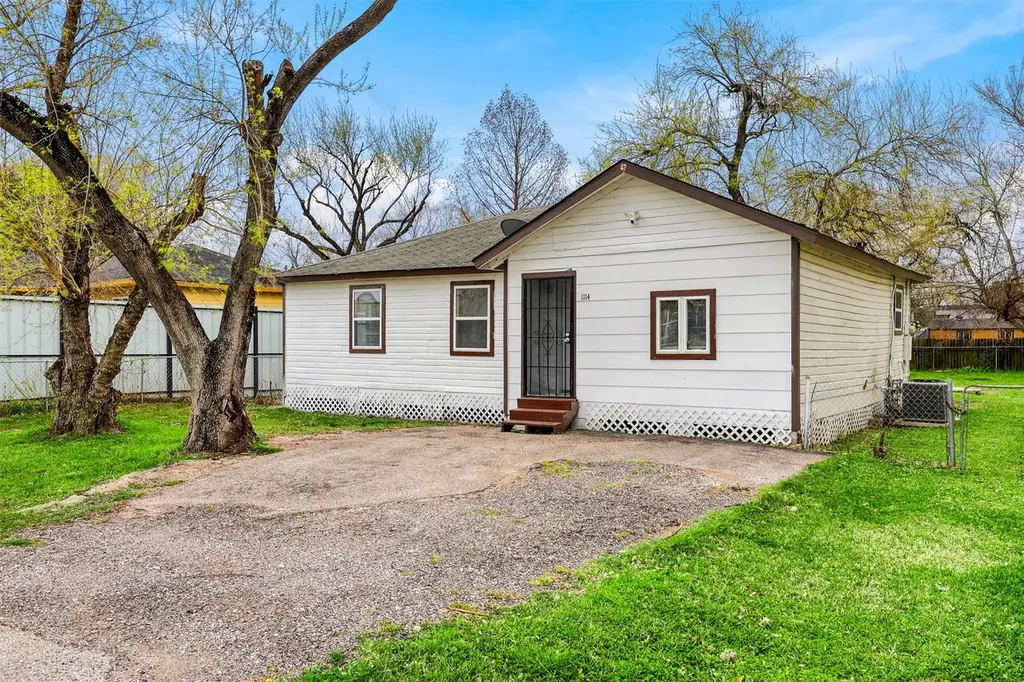
1114 Blackwood Ave · Aldine, TX
Flood risk 6/10 · Moderate
- FEMA flood zone
- AE
- Chance of flooding over 30 yrs
- 0.74%
- Est. flood insurance / yr
- $1,737 – $8,500
Fire risk 1/10 · Minimal
- Est. fire insurance / yr
- $1,222 – $2,270
Heat risk 9/10 · Severe
- Hot days now (above 110°F)
- 7 days/yr
- Hot days in 30 yrs
- 23 days/yr
Wind risk 9/10 · Severe
- Chance of severe wind over 30 yrs
- 99.0%
Air-quality risk 3/10 · Minor
- Unhealthy air days now
- 3 days/yr
- Unhealthy air days in 30 yrs
- 4 days/yr
Risk factors via First Street. Map © Google.
Why this score? — see what drove the C+ grade
The composite is a weighted blend of 9 inputs, each scored 0–100. Each bar is that input's sub-score; the figure is the points it added to the 100-point composite (weight × sub-score).
- Cash flow +21.7/30.0
- ARV discount +15.0/15.0
- DSCR +6.9/10.0
- 1% rule +5.9/10.0
- Appreciation +4.8/10.0
- Livability +2.8/5.0
- Condition / age +2.5/5.0
- Rent growth +2.1/5.0
- Schools +1.5/10.0
$135,000
🖨 Deal sheet (PDF) 📄 Offer letter ✓ Due diligence
Listing remarks
Welcome to Aldine Meadows! This charming 3-bedroom, 1-bath home sits on a spacious, UNRESTRICTED lot, offering endless possibilities for outdoor living, gardening, future additions, or even a workshop. Conveniently located with easy access to Beltway 8, this property is just minutes from local schools, shopping, and the airport. The home features numerous recent renovations, including brand-new flooring, fresh paint, updated doors and windows, modern cabinetry, and a beautifully renovated bathroom. With move-in-ready updates and the freedom to make the property your own, this is an incredible opportunity to own a home with space, flexibility, and a prime location. No HOA
Key facts
- Unrestricted lot
- Updated windows
- Recent renovations
Tags
Property features AI
Finance
- Financial info: Lease not considered
Exterior
- Parking: No parking
- Utilities: Septic tank
- Home design: Residential property; Faces north; Built in 1950
- Construction: Block foundation; Composition roof; Construction materials: Unknown
- Exterior features: Back yard fencing; Fenced yard; Property backs to greenbelt/park
Interior
- Kitchen: Gas cooktop; Gas oven
- Bedrooms: Three bedrooms total — two bedrooms (first floor), primary bedroom (first floor)
- Bathrooms: One full bathroom
- Heating & cooling: Central heating (electric); Central air conditioning (electric)
- Interior features: Washer hookup and gas dryer hookup; Seller disclosure
- Laundry & utility: Washer hookup; Gas dryer hookup
Neighborhood map
What this means for you Summary
Snapshot
- This is a 3-bed/1.0-bath single-family listed at $135k.
Deal economics
- At list price, monthly cash flow is $-218 ($-3k/yr) — negative.
- To cash-flow at today's rent, offer at most $96k (28.5% below list).
- Meets the 1% rule at list price ($1k rent vs $135k).
- Recommended offer: $96k (28.5% below list) — sets the bar for cash-flow.
- Cap rate 8.1% vs local median 3.1% in Aldine — top-decile yield for the area; either an underpriced asset or a hidden risk that comps aren't pricing in. Stress-test before assuming the spread holds.
Location & tenants
- Location reads 56/100 on livability (#1,332 in TX) — a working-class tenant base; expect higher turnover. Strengths: cost of living A+, housing A+; Watch: crime F, amenities F, commute F.
- Aldine ISD (suburban): math 16% / reading 21% proficiency, ranked #790 of 826 in TX (top 96%) — low school quality limits family demand, transient renter base, plan for 1-2y turnover; 79% free/reduced lunch — lower-income household profile, screen leases tightly.
- Zoned schools: Raymond El (math 10% / reading 9%, grade F, #4,291 of 4,322 statewide, top 99%, 434 students, 96% FRL); Aldine Middle (math 8% / reading 19%, grade F, #1,602 of 1,662 statewide, top 97%, 785 students, 91% FRL); Aldine H S (math 15% / reading 20%, grade F, #1,451 of 1,632 statewide, top 89%, 2,663 students, 94% FRL).
- Market conditions: Rents soft (-1.5%/yr); 43 active listings in the ZIP; 6 comparable units currently listed for rent nearby; rentals lingering (median 46d on market — plan ~5-8 weeks vacancy on turnover, expect pricing pressure); 50% of comp listings sitting > 30 days — soft ceiling on asking rent; lower-income renter base — watch delinquency; 29,883 units permitted in Harris County in 2024 (8,621 in 5+ unit buildings).
- This rent runs 40% of the median local income ($44k/yr) — at the standard rent-burdened threshold; future hikes will face affordability resistance.
Forward outlook
- In year one you build about $404 of equity ($933 loan paydown + $-529 appreciation (-0.4% local appreciation)).
- Harris County population projected at +47% by 2050 — long-run rental-demand tailwind backs the buy-and-hold thesis.
Negotiation context
- Only 2 days on market — expect competitive offers; lowballing is unlikely to land.
- 8 sale attempts with the ask held roughly flat each time — persistent listings suggest the price (not the market) is what's stuck; bring a comps-based counter.
Risks & watch-outs
- Watch-outs: flood insurance adds $427/mo; built in 1950 — expect roof / HVAC / electrical / plumbing capex.
- Climate carrying-cost: in FEMA flood zone AE (mandatory federal flood insurance); severe wind risk, 99% chance of damaging wind over 30y; extreme-heat days projected 7→23/yr by 2055 (HVAC capex compounding) — expect insurance premiums to compound above CPI over the hold.
Questions for the listing agent
- What do current leases actually rent for vs. the listed asking? Can we see a recent rent roll and the last 12 months of T-12 income?
- Built in 1950 — when were the roof, HVAC, electrical panel, plumbing, and water heater last replaced?
- What's the actual annual flood-insurance premium (NFIP or private), and is the property in a SFHA with mandatory coverage?
- Is there a deadline driving the sale (1031 exchange, divorce, estate, relocation)? That informs how much negotiation room exists.
- Schools are F-rated, which usually means shorter tenancies and higher turnover. Who's the typical renter profile here, and what's been the actual vacancy rate?
- Crime grade is F in this area — have there been break-ins, vandalism, or insurance claims at this property in the last 3 years? What carrier currently insures it and at what premium?
- What's the average days-on-market for RENTAL listings here right now (not sales)? A rising rental-DOM trend means longer vacancies and softer asking-rent achievability than the comps imply.
- What's the recent tenant-quality profile in this submarket — average credit score on applications, eviction rate, late-payment / NSF rate, and stable-employment percentage? A property-management company in the area should have these aggregated.
- How much new for-sale + rental construction is in the pipeline within 1–3 miles? Heavy new supply typically softens prices + rents 12–24 months out; constrained supply supports both.
Investment metrics
- 1% rule
- 1.09% ✓
- Cap rate
- 8.15%
- Cash-on-cash
- 6.62%
- DSCR
- 1.29
- GRM
- 7.7
CMA / ARV
- ARV (median comp)
- $193,038
- List price
- $135,000
- Delta
- -22.81%
- Verdict
- UNDERPRICED
- Comps
- 11 within 1.0 mi
Projected returns pro-forma
-0.39% appreciation · 0.0% rent growth · sell at horizon
- IRR
- -14.7%
- Equity multiple
- 0.36×
- Total profit
- $-24,308
- Equity at exit
- $36,575
- IRR
- -11.7%
- Equity multiple
- -0.04×
- Total profit
- $-39,487
- Equity at exit
- $41,922
Cash invested: $37,800 (down + closing). Projections, not guarantees.
Landlord ↔ Tenant lean methodology
- Overall (STATE)
- 87 Strongly Landlord-Friendly
- State Texas
- 87 Strongly Landlord-Friendly · R+5
- County
- — inherits STATE
- City
- — inherits STATE
ZIP-level market 77032
- Home prices YoY
- -0.1%
- Rents YoY
- -1.5%
- Active inventory
- 43
- Price-to-rent
- 7.7×
Monthly cashflow live
- Estimated rent
- $1,466 high interval (Pro) →
- Mortgage (P&I)
- −$708
- Tax from tax record
- −$186 /mo · $2,227/yr
- Insurance
- −$56
- Flood insurance flood zone
- −$427 /mo · $5,118/yr
- HOA
- −$0
- Vacancy / Maint / Mgmt
- −$308
- Net cashflow
- $-218
Break-even live
Sensitivity live
| Price | -10% $-142 | -5% $-180 | +0% $-218 | +5% $-256 | +10% $-294 |
|---|---|---|---|---|---|
| Rent | -10% $-334 | -5% $-276 | +0% $-218 | +5% $-160 | +10% $-102 |
| Rate | -1.0pp $-150 | -0.5pp $-184 | base $-218 | +0.5pp $-253 | +1.0pp $-289 |
UW: 25.0% down · 7.5% · 30yr · 1.5% tax · 5.0% vac · 8.0% maint · 8.0% mgmt
Financing live
Cash to close
- Down payment
- $33,750
- Closing costs
- $4,050
- Reserves months
- —
- Total cash needed
- —
Loan-product check · same deal, 3 products live
Conventional
25% down · 7.5% · 30yr
- Down + closing
- —
- Monthly P&I
- —
- Monthly cashflow
- —
- DSCR
- —
- Eligible?
- —
Personal DTI + credit; lowest rate.
DSCR
20% down · 8.5% · 30yr
- Down + closing
- —
- Monthly P&I
- —
- Monthly cashflow
- —
- DSCR
- —
- Eligible?
- —
No personal income docs; deal must DSCR.
Hard money
10% down · 12.0% · 12mo
- Down + closing
- —
- Monthly P&I
- —
- Monthly cashflow
- —
- DSCR
- —
- Eligible?
- —
Short-term bridge; refi at stabilization.
Rent comps 6 comps
| Address | Beds | Baths | Sqft | Rent | $/sqft | DOM | Units | Dist |
|---|---|---|---|---|---|---|---|---|
| 15136 Aldine Westfield Rd Houston, TX | 2.0 | 2.0 | 928 | $1,499 | $1.62 | 45d | 1 | 0.89mi |
| 15130 Aldine Westfield Rd Houston, TX | 2.0 | 2.0 | 940 | $1,260 | $1.34 | 45d | 1 | 0.92mi |
| 655 N Sam Houston Pkwy E Unit 712 Houston, TX | 2.0 | 2.0 | 800 | $1,115 | $1.39 | 14d | 1 | 1.01mi |
| 2200 N Sam Houston Pkwy E Houston, TX | 1.0–2.0 | 1.0–2.0 | 944 | $1,710 | $1.81 | 0d | 24 | 1.04mi |
| 1000 Greens Rd Houston, TX | 1.0–2.0 | 1.0–2.0 | 753 | $986 | $1.31 | 45d | 31 | 1.50mi |
| 1000 Greens Rd Houston, TX | 1.0–2.0 | 1.0–2.0 | 753 | $944 | $1.25 | 1d | 21 | 1.50mi |
Listing history 22 events
-
2026-06-15status $135,000 Pending 2 DOM
-
2026-06-13days on market $135,000 Active 2 DOM
-
2026-06-13pricedays on market $135,000 Active 1 DOM
-
2026-06-10status $149,000 Active 109 DOM
-
2026-05-14status Pending 679-char remark
-
2026-05-02price $149,000 679-char remark
-
2026-04-16status Active 679-char remark
-
2026-04-08status Pending 679-char remark
-
2026-02-03$159,000 Active 679-char remark
-
2026-01-02historical $1,450
-
2025-12-31historical
-
2025-12-06$1,450
-
2025-10-14$175,000 Active
-
2025-09-30historical
-
2025-08-19price $200,000
-
2025-07-01price $205,000
-
2025-06-18status Active
-
2025-05-27status Pending, Continue to Show
-
2025-04-21price $215,000
-
2025-03-14$230,000 Active
-
2004-11-02soldstatus
-
2000-05-19soldstatus
ⓘ Source: listings_history table (triggers on properties + properties_extension) + one-shot
backfill from property_details.listing_events for pre-trigger history.
Tax reassessment forecast TX · Resets to sale price
- Current annual tax
- $2,227 · $186/mo
- Projected year-2 tax
- $2,470 · $206/mo
- Expected delta
- +$244/yr (+$20/mo · 10.9%)
ⓘ Screening estimate from a state-policy table — verify with the county assessor before closing.
Climate risk First Street
- Flood 6/10 Major FEMA zone AE · 74% chance over 30 yrs
- Wildfire 1/10 Low
- Heat 9/10 Extreme 7 d/yr ≥110°F today · 23 d/yr by 30 yrs out
- Wind 9/10 Extreme 99% chance of damaging wind over 30 yrs
- Air quality 3/10 Moderate 3 unhealthy d/yr today · 4 by 30 yrs out
Nearby sold comps map
Loading sold comps map…
Walkable amenities ~0.75 mi
Loading nearby amenities…
Taxation est. · year 1
- Rental income
- $17,593
- − Mortgage interest
- −$7,562
- − Property taxes
- −$2,227
- − Insurance
- −$5,794
- − Repairs & maintenance
- −$1,407
- − Management
- −$1,407
- − Depreciation
- −$3,927
- Taxable loss
- −$4,731
- Est. tax savings @ 24.0%
- +$1,135
- After-tax cash flow
- $-1,481/yr
For passive investors: Depreciation is non-cash, so a rental often shows a tax loss while cash-flowing — sheltering income. Rental losses are passive: they offset passive income freely, and up to $25,000/yr can offset ordinary (W-2) income if you actively participate and your MAGI is under $100k (phasing out to $0 by $150k); unused losses carry forward. On sale, claimed depreciation is recaptured at up to 25%, and gains may owe capital-gains tax (a 1031 exchange can defer both). Figures are a year-1 estimate at your 24.0% rate — not tax advice; consult a CPA.
Schools (NCES district)
- District
- Aldine ISD
- NCES district ID
- 4807710
- Math proficiency
- 16% ▼ -23.00%
- Reading proficiency
- 21% ▼ -11.00%
- Median HH income
- $37,081
- Composite
- 15.42/100
- National rank
- #9317
- State rank
- #790 of 826 in TX
Livability — Aldine
- Score
- 56/100
- State rank
- #1332
- US rank
- #22958
Category grades
Schools grade is shown separately in the Schools card above.
Census & demographics
- Census place
- Aldine, TX
- County
- Harris County · 4,702,590 people
- Metro
- Houston-The Woodlands-Sugar Land, TX
- Population (ZIP)
- 12,403
- Household income
- $43,725
- Rent vs Own
- Severe rent burden
- 944.0
Population outlook (Harris County) Hauer SSP2
- Today (2025)
- 5,571,493 people
- By 2030
- 6,089,821 · +9.3%
- By 2040
- 7,142,806 · +28.2%
- By 2050
- 8,185,864 · +46.9%
- By 2075
- 10,574,329 · +89.8%
- By 2100
- 12,109,958 · +117.4%
Race, ethnicity, and origin ACS 2023
- Neighborhood character
- Diverse neighborhood (Simpson 0.62)
- Race & ethnicity
- Hispanic / Latino 48% Black 37% Two or more races 22% White 8% Native American 2%
- Hispanic origin (detail)
- Mexican 39%
- Common ancestry
- Slovak 2%
- Foreign-born
- 24% · Canada, China
- Languages at home
- 58% English-only · Spanish 42%
Political lean MEDSL · Harris
- 2024 margin
- Lean D (+5.5) · D 52.0% · R 46.4% · Other 1.6%
- 2008→2024 swing
- +3.9pp toward D · 2008: 1.6pp · 2024: 5.5pp
- All cycles
- 2024: D+5.5 2020: D+13.3 2016: D+12.4 2012: D+0.1 2008: D+1.6
Not yet ingested
- Civics
- —
Market trends
- HPI YoY
- ▼ -0.39%
- Current HPI
- 336.6839
- Rent YoY
- ▼ -1.51%
- Metro
- Houston-The Woodlands-Sugar Land, TX
- State GDP YoY
- ▲ 3.95%
- F500 in state
- 110
Industry mix (Fortune 500 HQ in TX)
| Industry | F500 HQs | Revenue |
|---|---|---|
| Energy | 16 | $1,198B |
|
||
| Technology | 5 | $198B |
|
||
| Engineering / Construction | 4 | $72B |
|
||
| Energy Services | 3 | $60B |
|
||
| Utilities | 3 | $41B |
|
||
| Healthcare | 2 | $330B |
|
||
Price history
-41.3% since first listed23 events — show timeline
- 2026-06-13 Pending — HARMLS
- 2026-06-12 Listed $135,000 HARMLS
- 2026-06-09 Relisted — HARMLS
- 2026-06-04 Listing Removed — HARMLS
- 2026-05-23 Pending — HARMLS
- 2026-05-14 Pending — HARMLS
- 2026-05-02 Price Changed $149,000 HARMLS
- 2026-04-16 Relisted — HARMLS
- 2026-04-08 Pending — HARMLS
- 2026-02-03 Listed $159,000 HARMLS
- 2026-01-02 Rental Removed $1,450 HARMLS
- 2025-12-31 Listing Removed — HARMLS
- 2025-12-06 Listed for Rent $1,450 HARMLS
- 2025-10-14 Listed $175,000 HARMLS
- 2025-09-30 Listing Removed — HARMLS
- 2025-08-19 Price Changed $200,000 HARMLS
- 2025-07-01 Price Changed $205,000 HARMLS
- 2025-06-18 Relisted — HARMLS
- 2025-05-27 Pending — HARMLS
- 2025-04-21 Price Changed $215,000 HARMLS
- 2025-03-14 Listed $230,000 HARMLS
- 2004-11-02 Sold (Public Records) — Public Records
- 2000-05-19 Sold (Public Records) — Public Records
Property tax history
+12.3%/yrLatest (2025): $2,227 · +20.0% YoY. Source: county tax records.
Cash-flow waterfall
monthlySold comps — $/sqft
last 12 mo · ≤1 miLoading sold comps…