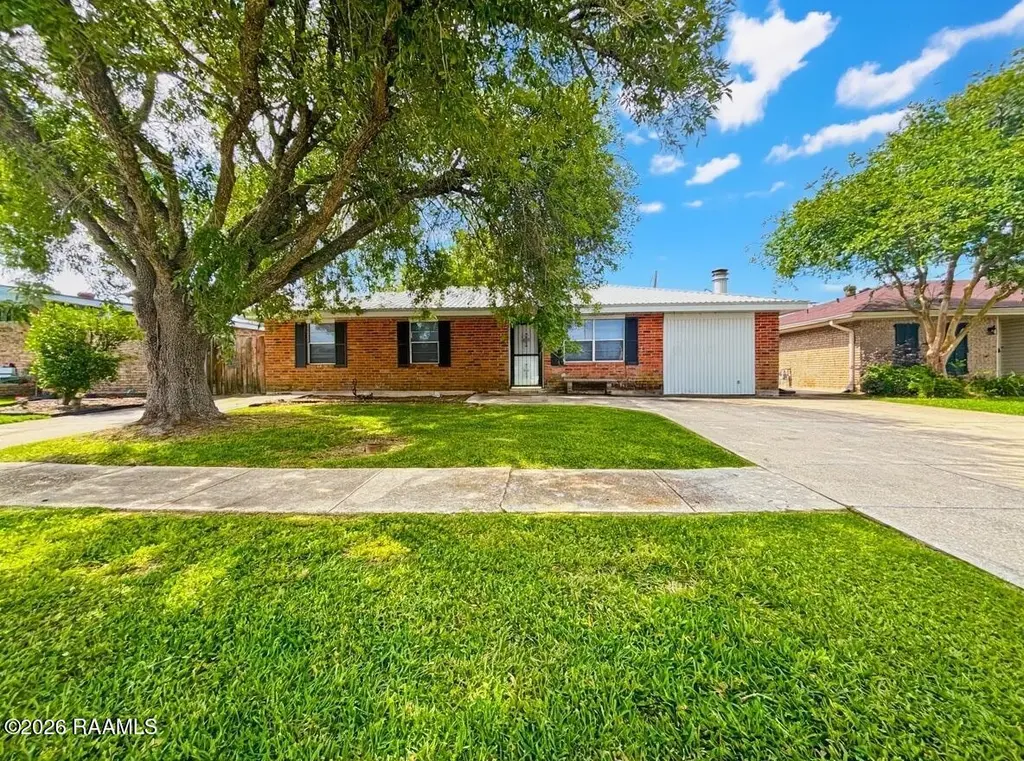
3206 Roselawn Dr · Morgan City, LA
Flood risk 6/10 · Moderate
- FEMA flood zone
- X (shaded)
- Chance of flooding over 30 yrs
- 0.65%
- Est. flood insurance / yr
- $507 – $1,088
Fire risk 1/10 · Minimal
- Est. fire insurance / yr
- $1,269 – $2,357
Heat risk 10/10 · Severe
- Hot days now (above 106°F)
- 7 days/yr
- Hot days in 30 yrs
- 24 days/yr
Wind risk 9/10 · Severe
- Chance of severe wind over 30 yrs
- 99.0%
Air-quality risk 1/10 · Minimal
- Unhealthy air days now
- 0 days/yr
- Unhealthy air days in 30 yrs
- 0 days/yr
Risk factors via First Street. Map © Google.
Why this score? — see what drove the C- grade
The composite is a weighted blend of 9 inputs, each scored 0–100. Each bar is that input's sub-score; the figure is the points it added to the 100-point composite (weight × sub-score).
- Cash flow +17.2/30.0
- ARV discount +12.5/15.0
- DSCR +5.4/10.0
- 1% rule +4.4/10.0
- Livability +3.4/5.0
- Schools +2.8/10.0
- Rent growth +2.5/5.0
- Condition / age +2.5/5.0
- Appreciation +0.0/10.0
$135,000
🖨 Deal sheet 📄 Offer letter ✓ Due diligence
Listing remarks
Nice 3-bedroom, 1.5-bath home offering 1350 sq ft of comfortable living on a generous 60 x 100 lot. Step inside to discover a warm and inviting space, perfect for creating lasting memories. Cozy up by the fireplace on chilly evenings. The well-designed layout includes a large pantry, providing ample storage for all your culinary needs. Enjoy seamless indoor-outdoor living with the 14 x 20 screened-in patio, ideal for relaxing or entertaining. This property also features a huge workshop, perfect for hobbyists or those needing extra space for projects. With its desirable features and convenient location, this home is a must-see! Don't miss the opportunity to make it yours.
Key facts
- Screened-in patio
- Large pantry
- Huge workshop
Tags
Property features AI
Exterior
- Parking: Open parking
- Utilities: Public sewer; City electric
- Home design: Single family residence
- Construction: Block siding and frame construction; Metal roof
- Exterior features: Chain link fencing; Workshop; City street and paved road frontage; Zoned residential
Interior
- Kitchen: Electric cooktop; Refrigerator
- Flooring: Laminate flooring; Wood laminate flooring
- Bathrooms: 1 full bathroom; 1 half bathroom
- Heating & cooling: Central heating (electric); Central air conditioning; Wood-burning fireplace (1)
- Interior features: Formica counters; Aluminum window frames; Screened, covered porch
Neighborhood map
What this means for you Summary
Snapshot
- This is a 3-bed/1.5-bath single-family listed at $135k.
Deal economics
- At list price, monthly cash flow is $97 ($1k/yr) — positive.
- The deal already cash-flows at list — no discount required.
- To meet the 1% rule (rent ≥ 1% of price), the offer needs to be $127k (6.2% below list).
- Recommended offer: $127k (6.2% below list) — sets the bar for 1% rule.
- Cap rate 7.2% vs local median 4.6% in Morgan City — top-decile yield for the area; either an underpriced asset or a hidden risk that comps aren't pricing in. Stress-test before assuming the spread holds.
Location & tenants
- Location reads 67/100 on livability (#111 in LA) — a middle-class / working-renter tenant base. Strengths: cost of living A+, health & safety A+, housing A-; Watch: crime F, amenities F, commute F.
- St. Mary Parish (town): math 28% / reading 39% proficiency, ranked #37 of 98 in LA (top 38%) — families likely to look elsewhere, expect single-tenant / working-renter base with shorter leases; 68% free/reduced lunch — lower-income household profile, screen leases tightly.
- Zoned schools: Wyandotte Elementary School (math 37% / reading 47%, grade F, #201 of 646 statewide, top 33%, 346 students, 68% FRL); Morgan City Junior High School (math 22% / reading 34%, grade F, #125 of 218 statewide, top 58%, 488 students, 56% FRL).
- Market conditions: 82 active listings in the ZIP; 37 units permitted in St. Mary Parish in 2024 (20 in 5+ unit buildings).
Forward outlook
- Local home prices are declining (-3.0%/yr); year-one equity from $933 of loan paydown is wiped out by about $4k of value loss. Plan a longer hold.
- St. Mary County population projected at -18% by 2050 — secular population decline; favor cash flow + early exit over multi-decade hold.
Negotiation context
- It's been on market 52 days — a 3% lower offer ($131k) is reasonable based on typical stale-listing flexibility.
Risks & watch-outs
- Climate carrying-cost: major flood risk; severe wind risk, 99% chance of damaging wind over 30y; extreme-heat days projected 7→24/yr by 2055 (HVAC capex compounding) — expect insurance premiums to compound above CPI over the hold.
Questions for the listing agent
- It's been on market 52 days. Have you received any prior offers? Is the seller open to a 6% concession, seller financing, or rate buy-down credit?
- Is there a deadline driving the sale (1031 exchange, divorce, estate, relocation)? That informs how much negotiation room exists.
- Schools are B-rated — typically a magnet for longer-tenancy family renters. What's the average tenant stay here, and is there a school-zone premium baked into asking?
- Crime grade is F in this area — have there been break-ins, vandalism, or insurance claims at this property in the last 3 years? What carrier currently insures it and at what premium?
- What's the average days-on-market for RENTAL listings here right now (not sales)? A rising rental-DOM trend means longer vacancies and softer asking-rent achievability than the comps imply.
- What's the recent tenant-quality profile in this submarket — average credit score on applications, eviction rate, late-payment / NSF rate, and stable-employment percentage? A property-management company in the area should have these aggregated.
- How much new for-sale + rental construction is in the pipeline within 1–3 miles? Heavy new supply typically softens prices + rents 12–24 months out; constrained supply supports both.
Investment metrics
- 1% rule
- 0.94% ✗
- Cap rate
- 7.16%
- Cash-on-cash
- 3.08%
- DSCR
- 1.14
- GRM
- 8.9
CMA / ARV
- ARV (median comp)
- $152,015
- List price
- $135,000
- Delta
- -11.19%
- Verdict
- UNDERPRICED
- Comps
- 20 within 1.0 mi
Show comp detail 8 sales within ~0.75 mi
| Address | Dist | Beds/Ba | Sqft | Sold | Price | $/sf | Match |
|---|---|---|---|---|---|---|---|
| 919 Chestnut Dr | 0.12mi | 3/2.0 | 1,436 (+6%) | 9mo | $165,000 | $115 | 74 |
| 1001 Chestnut Dr | 0.12mi | 3/1.5 | 1,287 (-5%) | 19mo | $62,700 | $49 | 71 |
| 3122 Tammy Dr | 0.20mi | 3/2.0 | 1,480 (+10%) | 16mo | $175,000 | $118 | 60 |
| 3028 Diane Dr | 0.36mi | 4/2.0 (+1) | 1,464 (+8%) | 18mo | $175,000 | $120 | 47 |
| 311 Chennault St | 0.64mi | 3/1.0 | 1,285 (-5%) | 16mo | $140,000 | $109 | 47 |
| 209 Pecos St | 0.59mi | 3/1.5 | 1,226 (-9%) | 16mo | $64,900 | $53 | 44 |
| 326 Chennault St | 0.72mi | 2/1.0 (-1) | 1,247 (-8%) | 12mo | $135,000 | $108 | 37 |
| 216 Patton St | 0.68mi | 3/2.0 | 1,155 (-14%) | 23mo | $179,000 | $155 | 23 |
Match score weights: distance 35% · size 25% · config 20% · recency 20%. Top-matched comps best support the ARV.
Projected returns pro-forma
-3.0% appreciation · 3.0% rent growth · sell at horizon
- IRR
- -11.4%
- Equity multiple
- 0.58×
- Total profit
- $-15,697
- Equity at exit
- $20,129
- IRR
- -2.2%
- Equity multiple
- 0.85×
- Total profit
- $-5,709
- Equity at exit
- $11,672
Cash invested: $37,800 (down + closing). Projections, not guarantees.
Landlord ↔ Tenant lean methodology
- Overall (STATE)
- 90 Strongly Landlord-Friendly
- State Louisiana
- 90 Strongly Landlord-Friendly · R+12
- County
- — inherits STATE
- City
- — inherits STATE
ZIP-level market 70380
- Home prices YoY
- -34.8%
- Active inventory
- 82
- Price-to-rent
- 8.9×
Monthly cashflow live
- Estimated rent
- $1,267 medium interval (Pro) →
- Mortgage (P&I)
- −$708
- Tax from tax record
- −$140 /mo · $1,675/yr
- Insurance
- −$56
- HOA
- −$0
- Vacancy / Maint / Mgmt
- −$266
- Net cashflow
- $97
Break-even live
UW: 25.0% down · 7.5% · 30yr · 1.5% tax · 5.0% vac · 8.0% maint · 8.0% mgmt
Financing live
Cash to close
- Down payment
- $33,750
- Closing costs
- $4,050
- Reserves months
- —
- Total cash needed
- —
Loan-product check · same deal, 3 products live
Conventional
25% down · 7.5% · 30yr
- Down + closing
- —
- Monthly P&I
- —
- Monthly cashflow
- —
- DSCR
- —
- Eligible?
- —
Personal DTI + credit; lowest rate.
DSCR
20% down · 8.5% · 30yr
- Down + closing
- —
- Monthly P&I
- —
- Monthly cashflow
- —
- DSCR
- —
- Eligible?
- —
No personal income docs; deal must DSCR.
Hard money
10% down · 12.0% · 12mo
- Down + closing
- —
- Monthly P&I
- —
- Monthly cashflow
- —
- DSCR
- —
- Eligible?
- —
Short-term bridge; refi at stabilization.
Listing history 16 events
-
2026-06-18days on market $135,000 Active 52 DOM
-
2026-06-17days on market $135,000 Active 51 DOM
-
2026-06-16days on market $135,000 Active 50 DOM
-
2026-06-15days on market $135,000 Active 49 DOM
-
2026-06-13days on market $135,000 Active 47 DOM
-
2026-06-12days on market $135,000 Active 46 DOM
-
2026-06-09days on market $135,000 Active 43 DOM
-
2026-06-08days on market $135,000 Active 42 DOM
-
2026-06-07days on market $135,000 Active 41 DOM
-
2026-06-07days on market $135,000 Active 40 DOM
-
2026-06-04days on market $135,000 Active 37 DOM
-
2026-06-02days on market $135,000 Active 36 DOM
-
2026-06-01days on market $135,000 Active 35 DOM
-
2026-05-31days on market $135,000 Active 34 DOM
-
2026-05-31days on market $135,000 Active 33 DOM
-
2026-04-24$150,000 Active 677-char remark
ⓘ Source: listings_history table (triggers on properties + properties_extension) + one-shot
backfill from property_details.listing_events for pre-trigger history.
Tax reassessment forecast LA · Resets to sale price
- Current annual tax
- $1,675 · $140/mo
- Projected year-2 tax
- $1,675 · $140/mo
- Expected delta
- $0/yr ($0/mo · 0.0%)
ⓘ Screening estimate from a state-policy table — verify with the county assessor before closing.
Climate risk First Street
- Flood 6/10 Major FEMA zone X (shaded) · 65% chance over 30 yrs
- Wildfire 1/10 Low
- Heat 10/10 Extreme 7 d/yr ≥106°F today · 24 d/yr by 30 yrs out
- Wind 9/10 Extreme 99% chance of damaging wind over 30 yrs
- Air quality 1/10 Low 0 unhealthy d/yr today · 0 by 30 yrs out
Nearby sold comps map
Loading sold comps map…
Walkable amenities ~0.75 mi
Loading nearby amenities…
Taxation est. · year 1
- Rental income
- $15,201
- − Mortgage interest
- −$7,562
- − Property taxes
- −$1,675
- − Insurance
- −$675
- − Repairs & maintenance
- −$1,216
- − Management
- −$1,216
- − Depreciation
- −$3,927
- Taxable loss
- −$1,070
- Est. tax savings @ 24.0%
- +$257
- After-tax cash flow
- $1,421/yr
For passive investors: Depreciation is non-cash, so a rental often shows a tax loss while cash-flowing — sheltering income. Rental losses are passive: they offset passive income freely, and up to $25,000/yr can offset ordinary (W-2) income if you actively participate and your MAGI is under $100k (phasing out to $0 by $150k); unused losses carry forward. On sale, claimed depreciation is recaptured at up to 25%, and gains may owe capital-gains tax (a 1031 exchange can defer both). Figures are a year-1 estimate at your 24.0% rate — not tax advice; consult a CPA.
Schools (NCES district)
- District
- St. Mary Parish
- NCES district ID
- 2201620
- Math proficiency
- 28% ▼ -40.00%
- Reading proficiency
- 39% ▼ -33.00%
- Median HH income
- $39,843
- Composite
- 28.1/100
- National rank
- #6828
- State rank
- #37 of 98 in LA
Livability — Morgan City
- Score
- 67/100
- State rank
- #111
- US rank
- #11015
Category grades
Schools grade is shown separately in the Schools card above.
Census & demographics
- Census place
- Morgan City, LA
- Population (ZIP)
- 21,043
Population outlook (St. Mary County) Hauer SSP2
- Today (2025)
- 49,510 people
- By 2030
- 47,570 · -3.9%
- By 2040
- 43,880 · -11.4%
- By 2050
- 40,655 · -17.9%
- By 2075
- 37,190 · -24.9%
- By 2100
- 38,101 · -23.0%
Race, ethnicity, and origin ACS 2023
- Neighborhood character
- Predominantly White (65%)
- Race & ethnicity
- White 65% Hispanic / Latino 15% Black 12% Two or more races 9% Asian 3%
- Hispanic origin (detail)
- Mexican 7%
- Common ancestry
- Lithuanian 14%
- Foreign-born
- 9% · Canada, Vietnam
- Languages at home
- 84% English-only · Spanish 11% French/Haitian/Cajun 2% Vietnamese 2%
Political lean MEDSL · St. Mary
- 2024 margin
- Solid R (+31.9) · D 33.5% · R 65.4% · Other 1.0%
- 2008→2024 swing
- -15.1pp toward R · 2008: -16.8pp · 2024: -31.9pp
- All cycles
- 2024: R+31.9 2020: R+29.1 2016: R+27.6 2012: R+18.8 2008: R+16.8
Not yet ingested
- Civics
- —
Market trends
- HPI YoY
- ▼ -53.21%
- Current HPI
- 99.8137
- Rent YoY
- —
- Metro
- —
- State GDP YoY
- ▲ 3.29%
- F500 in state
- 10
Industry mix (Fortune 500 HQ in LA)
| Industry | F500 HQs | Revenue |
|---|---|---|
| Telecommunications | 2 | $23B |
|
||
| Utilities | 1 | $12B |
|
||
| Wholesale / Distribution | 1 | $5B |
|
||
| Advertising | 1 | $2B |
|
||
Price history
-10.0% since first listed2 events — show timeline
- 2026-05-19 Price Changed $135,000 AcadianaMLS
- 2026-04-24 Listed $150,000 AcadianaMLS
Property tax history
+6.8%/yrLatest (2025): $1,675 · +9.3% YoY. Source: county tax records.
Cash-flow waterfall
monthlySold comps — $/sqft
last 12 mo · ≤1 miLoading sold comps…