13 Meadow Ln · Huntington, WV
Flood risk 8/10 · Major
- FEMA flood zone
- X (shaded)
- Chance of flooding over 30 yrs
- 0.78%
- Est. flood insurance / yr
- $507 – $1,088
Fire risk 5/10 · Moderate
- Est. fire insurance / yr
- $787 – $1,461
Heat risk 5/10 · Moderate
- Hot days now (above 102°F)
- 7 days/yr
- Hot days in 30 yrs
- 20 days/yr
Wind risk 2/10 · Minimal
- Chance of severe wind over 30 yrs
- 1.0%
Air-quality risk 1/10 · Minimal
- Unhealthy air days now
- 0 days/yr
- Unhealthy air days in 30 yrs
- 0 days/yr
Risk factors via First Street. Map © Google.
Why this score? — see what drove the A- grade
The composite is a weighted blend of 9 inputs, each scored 0–100. Each bar is that input's sub-score; the figure is the points it added to the 100-point composite (weight × sub-score).
- Cash flow +30.0/30.0
- ARV discount +15.0/15.0
- 1% rule +10.0/10.0
- DSCR +10.0/10.0
- Appreciation +5.0/10.0
- Livability +4.0/5.0
- Schools +2.6/10.0
- Rent growth +2.5/5.0
- Condition / age +2.5/5.0
$57,000
🖨 Deal sheet 📄 Offer letter ✓ Due diligence
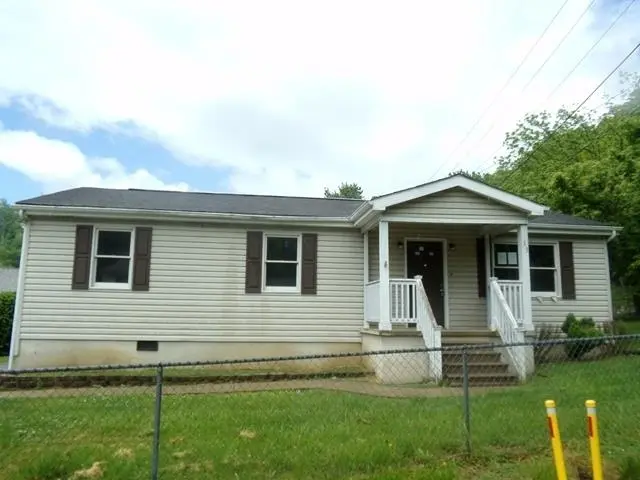
Listing remarks MLS
Move in ready 3 bed, 2 bath, spacious home close to amenities. Open floor plan with large kitchen. Nice flat yard with fence and storage building. Truly a Spring Valley gem!
Key facts
- Partially fenced
- Large living room
- Eat-in kitchen
Tags
Property features AI
Exterior
- Utilities: Public water; Septic tank sewer
- Home design: Single-family residence; One story
- Construction: Frame construction; Shingle roof; Crawl space basement
- Exterior features: Chain link fencing
Interior
- Kitchen: Dishwasher; Range; Oven; Refrigerator
- Flooring: Laminate flooring
- Bathrooms: 2 full bathrooms
- Heating & cooling: Central heating (natural gas); Central air conditioning
- Interior features: Dishwasher; Range; Oven; Refrigerator
Neighborhood map
What this means for you Summary
Snapshot
- This is a 3-bed/1.5-bath single-family listed at $57k.
Deal economics
- At list price, monthly cash flow is $462 ($6k/yr) — positive.
- The deal already cash-flows at list — no discount required.
- Meets the 1% rule at list price ($1k rent vs $57k).
- Cap rate 17.4% vs local median 6.5% in Huntington — top-decile yield for the area; either an underpriced asset or a hidden risk that comps aren't pricing in. Stress-test before assuming the spread holds.
Location & tenants
- Location reads 79/100 on livability (#16 in WV, #2,045 nationally) — a middle-class / working-renter tenant base. Strengths: amenities A+, commute A+, cost of living A+; Watch: schools C-, crime F, employment F.
- Wayne County Schools (rural): math 25% / reading 38% proficiency, ranked #25 of 55 in WV (top 46%) — families likely to look elsewhere, expect single-tenant / working-renter base with shorter leases.
- Market conditions: 1 active listings in the ZIP; 67 units permitted in Wayne County in 2024 (0 in 5+ unit buildings).
Forward outlook
- In year one you build about $2k of equity ($394 loan paydown + $2k appreciation (3.0% local appreciation)).
- Wayne County population projected at -22% by 2050 — secular population decline; favor cash flow + early exit over multi-decade hold.
- At projected returns (3.0% appreciation + 3.0% rent growth), your $16k cash investment doubles in ~3 years — after that, you're playing with house money.
Negotiation context
- Only 9 days on market — expect competitive offers; lowballing is unlikely to land.
- 2 sale attempts since 8y ago with the ask held roughly flat each time — persistent listings suggest the price (not the market) is what's stuck; bring a comps-based counter.
Risks & watch-outs
- Watch-outs: flood insurance adds $66/mo.
- Climate carrying-cost: severe flood risk; moderate wildfire risk; extreme-heat days projected 7→20/yr by 2055 (HVAC capex compounding) — expect insurance premiums to compound above CPI over the hold.
Questions for the listing agent
- What's the actual annual flood-insurance premium (NFIP or private), and is the property in a SFHA with mandatory coverage?
- Is there a deadline driving the sale (1031 exchange, divorce, estate, relocation)? That informs how much negotiation room exists.
- Crime grade is F in this area — have there been break-ins, vandalism, or insurance claims at this property in the last 3 years? What carrier currently insures it and at what premium?
- What's the average days-on-market for RENTAL listings here right now (not sales)? A rising rental-DOM trend means longer vacancies and softer asking-rent achievability than the comps imply.
- What's the recent tenant-quality profile in this submarket — average credit score on applications, eviction rate, late-payment / NSF rate, and stable-employment percentage? A property-management company in the area should have these aggregated.
- How much new for-sale + rental construction is in the pipeline within 1–3 miles? Heavy new supply typically softens prices + rents 12–24 months out; constrained supply supports both.
Investment metrics
- 1% rule
- 2.00% ✓
- Cap rate
- 17.42%
- Cash-on-cash
- 39.74%
- DSCR
- 2.77
- GRM
- 4.2
CMA / ARV
- ARV (on-the-fly)
- $74,360
- Comps found
- 3
Show comp detail 3 sales within ~0.75 mi
| Address | Dist | Beds/Ba | Sqft | Sold | Price | $/sf | Match |
|---|---|---|---|---|---|---|---|
| 13 Meadow Ln | 0.00mi | 3/2.0 | 1,161 (+2%) | 0mo | $57,000 | $49 | 95 |
| 2804 Florance Ct | 0.35mi | 3/1.0 | 1,000 (-13%) | 2mo | $65,000 | $65 | 59 |
| 2044 Spring Valley Dr | 0.70mi | 2/2.0 (-1) | 1,120 (-2%) | 13mo | $120,000 | $107 | 46 |
Match score weights: distance 35% · size 25% · config 20% · recency 20%. Top-matched comps best support the ARV.
Projected returns pro-forma
3.0% appreciation · 3.0% rent growth · sell at horizon
- IRR
- 40.4%
- Equity multiple
- 3.28×
- Total profit
- $36,341
- Equity at exit
- $25,630
- IRR
- 40.4%
- Equity multiple
- 6.53×
- Total profit
- $88,199
- Equity at exit
- $39,498
Cash invested: $15,960 (down + closing). Projections, not guarantees.
Landlord ↔ Tenant lean methodology
- Overall (STATE)
- 83 Strongly Landlord-Friendly
- State West Virginia
- 83 Strongly Landlord-Friendly · R+22
- County
- — inherits STATE
- City
- — inherits STATE
ZIP-level market 25104
- Active inventory
- 1
- Price-to-rent
- 4.2×
Monthly cashflow live
- Estimated rent
- $1,142 medium interval (Pro) →
- Mortgage (P&I)
- −$299
- Tax from tax record
- −$51 /mo · $615/yr
- Insurance
- −$24
- Flood insurance flood zone
- −$66 /mo · $798/yr
- HOA
- −$0
- Vacancy / Maint / Mgmt
- −$240
- Net cashflow
- $462
Break-even live
UW: 25.0% down · 7.5% · 30yr · 1.5% tax · 5.0% vac · 8.0% maint · 8.0% mgmt
Financing live
Cash to close
- Down payment
- $14,250
- Closing costs
- $1,710
- Reserves months
- —
- Total cash needed
- —
Loan-product check · same deal, 3 products live
Conventional
25% down · 7.5% · 30yr
- Down + closing
- —
- Monthly P&I
- —
- Monthly cashflow
- —
- DSCR
- —
- Eligible?
- —
Personal DTI + credit; lowest rate.
DSCR
20% down · 8.5% · 30yr
- Down + closing
- —
- Monthly P&I
- —
- Monthly cashflow
- —
- DSCR
- —
- Eligible?
- —
No personal income docs; deal must DSCR.
Hard money
10% down · 12.0% · 12mo
- Down + closing
- —
- Monthly P&I
- —
- Monthly cashflow
- —
- DSCR
- —
- Eligible?
- —
Short-term bridge; refi at stabilization.
Listing history 6 events
-
2026-05-11status Pending
-
2026-05-01$57,000 Active
-
2018-11-02soldstatus $80,500
-
2018-10-31soldstatus $80,500 173-char remark
Show marketing remark (173 chars)
Move in ready 3 bed, 2 bath, spacious home close to amenities. Open floor plan with large kitchen. Nice flat yard with fence and storage building. Truly a Spring Valley gem!
-
2018-05-16$82,000 173-char remark
Show marketing remark (173 chars)
Move in ready 3 bed, 2 bath, spacious home close to amenities. Open floor plan with large kitchen. Nice flat yard with fence and storage building. Truly a Spring Valley gem!
-
2002-06-26soldstatus $68,000
ⓘ Source: listings_history table (triggers on properties + properties_extension) + one-shot
backfill from property_details.listing_events for pre-trigger history.
Tax reassessment forecast WV · Resets to sale price
- Current annual tax
- $615 · $51/mo
- Projected year-2 tax
- $615 · $51/mo
- Expected delta
- $0/yr ($0/mo · 0.0%)
ⓘ Screening estimate from a state-policy table — verify with the county assessor before closing.
Climate risk First Street
- Flood 8/10 Severe FEMA zone X (shaded) · 78% chance over 30 yrs
- Wildfire 5/10 Major
- Heat 5/10 Major 7 d/yr ≥102°F today · 20 d/yr by 30 yrs out
- Wind 2/10 Low 100% chance of damaging wind over 30 yrs
- Air quality 1/10 Low 0 unhealthy d/yr today · 0 by 30 yrs out
Nearby sold comps map
Loading sold comps map…
Walkable amenities ~0.75 mi
Loading nearby amenities…
Taxation est. · year 1
- Rental income
- $13,707
- − Mortgage interest
- −$3,193
- − Property taxes
- −$615
- − Insurance
- −$1,082
- − Repairs & maintenance
- −$1,097
- − Management
- −$1,097
- − Depreciation
- −$1,658
- Taxable income
- $4,966
- Est. tax owed @ 24.0%
- −$1,192
- After-tax cash flow
- $4,353/yr
For passive investors: Depreciation is non-cash, so a rental often shows a tax loss while cash-flowing — sheltering income. Rental losses are passive: they offset passive income freely, and up to $25,000/yr can offset ordinary (W-2) income if you actively participate and your MAGI is under $100k (phasing out to $0 by $150k); unused losses carry forward. On sale, claimed depreciation is recaptured at up to 25%, and gains may owe capital-gains tax (a 1031 exchange can defer both). Figures are a year-1 estimate at your 24.0% rate — not tax advice; consult a CPA.
Schools (NCES district)
- District
- Wayne County Schools
- NCES district ID
- 5401500
- Math proficiency
- 25% ▼ -15.00%
- Reading proficiency
- 38% ▼ -10.00%
- Median HH income
- $36,283
- Composite
- 26.08/100
- National rank
- #7297
- State rank
- #25 of 55 in WV
Livability — Huntington
- Score
- 79/100
- State rank
- #16
- US rank
- #2045
Category grades
Schools grade is shown separately in the Schools card above.
Census & demographics
No demographic data for this ZIP.
Market trends
- HPI YoY
- —
- Current HPI
- —
- Rent YoY
- —
- Metro
- —
- State GDP YoY
- —
- F500 in state
- 0
Price history
-16.2% since first listed6 events — show timeline
- 2026-05-11 Pending — HBRMLS
- 2026-05-01 Listed $57,000 HBRMLS
- 2018-11-02 Sold (Public Records) $80,500 Public Records
- 2018-10-31 Sold (MLS) $80,500 KVBOR
- 2018-05-16 Listed $82,000 KVBOR
- 2002-06-26 Sold (Public Records) $68,000 Public Records
Property tax history
+2.3%/yrLatest (2025): $615 · +9.0% YoY. Source: county tax records.
Cash-flow waterfall
monthlySold comps — $/sqft
last 12 mo · ≤1 miLoading sold comps…