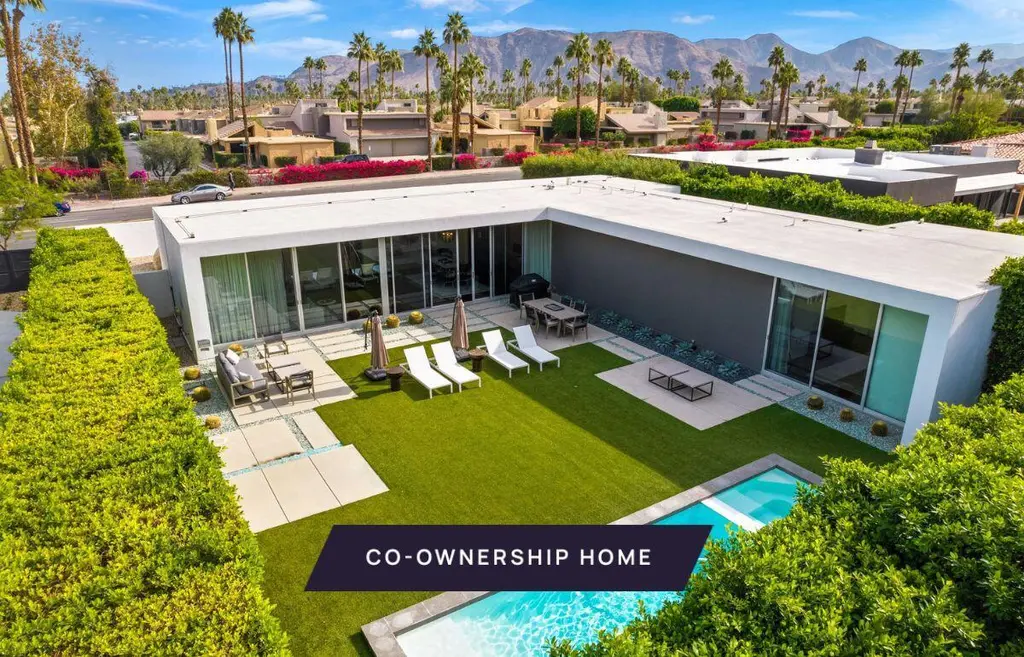
1961 S Palm Canyon Dr · Palm Springs, CA
Flood risk 1/10 · Minimal
- FEMA flood zone
- X (unshaded)
- Chance of flooding over 30 yrs
- 0.0%
- Est. flood insurance / yr
- $507 – $1,088
Fire risk 5/10 · Moderate
- Est. fire insurance / yr
- $659 – $1,223
Heat risk 9/10 · Severe
- Hot days now (above 110°F)
- 10 days/yr
- Hot days in 30 yrs
- 28 days/yr
Wind risk 1/10 · Minimal
- Chance of severe wind over 30 yrs
- —
Air-quality risk 5/10 · Moderate
- Unhealthy air days now
- 6 days/yr
- Unhealthy air days in 30 yrs
- 8 days/yr
Risk factors via First Street. Map © Google.
Why this score? — see what drove the C- grade
The composite is a weighted blend of 9 inputs, each scored 0–100. Each bar is that input's sub-score; the figure is the points it added to the 100-point composite (weight × sub-score).
- Cash flow +23.1/30.0
- ARV discount +7.5/15.0
- DSCR +7.4/10.0
- 1% rule +6.0/10.0
- Livability +3.3/5.0
- Schools +2.7/10.0
- Condition / age +2.5/5.0
- Rent growth +2.4/5.0
- Appreciation +0.0/10.0
$249,000
🖨 Deal sheet (PDF) 📄 Offer letter ✓ Due diligence
Listing remarks
New co-ownership opportunity by Pacaso: Own one-eighth of Palm Canyon, a professionally managed, turnkey home. This 3-bedroom, 3.5-bathroom home is a stunning example of desert modern design, where clean lines, natural materials, and expansive glass create a seamless connection between indoor and outdoor spaces. Thoughtfully designed, the L-shaped layout maximizes privacy while capturing breathtaking mountain views through floor-to-ceiling glass walls. Warm wood-clad ceilings and floors add texture and warmth to the open living space, where a sleek, integrated kitchen blends effortlessly into the design. A recessed stainless steel refrigerator, gas range, and discreet vent hood maintain the
Key facts
- Turnkey home
- Wood-clad ceilings
- Desert modern design
Tags
Property features AI
Finance
- Other: Not in a gated community; Short-term rentals not allowed; Will not consider lease
- HOA & community: No monthly association fee
Exterior
- Parking: Six total parking spaces; Attached carport with two covered carport spaces; Two additional uncovered/assigned spaces
- Security: Security/safety features (unspecified)
- Utilities: Sewer: Other; Fee simple land
- Home design: Detached property; One story
- Construction: One-story building
- Exterior features: Private heated in-ground pool; In-ground heated spa/hot tub; Fenced yard; Sprinkler system; Mountain view; Updated/remodeled condition
Interior
- Kitchen: Gas oven; Range hood; Dishwasher; Refrigerator; Freezer
- Flooring: Wood flooring
- Bathrooms: Three full bathrooms; One half bathroom
- Heating & cooling: Central heating (forced air); Central air conditioning
- Interior features: Ground-level entry with no steps; Fully furnished; Great room; Dining area; Utility room; Gas fireplace in the family room
- Laundry & utility: Washer; Dryer; Utility room
Neighborhood map
What this means for you Summary
Snapshot
- This is a 2-bed/3.5-bath single-family listed at $249k.
Deal economics
- At list price, monthly cash flow is $447 ($5k/yr) — positive.
- The deal already cash-flows at list — no discount required.
- Meets the 1% rule at list price ($3k rent vs $249k).
- Recommended offer: $245k (1.5% below list) — sets the bar for market timing.
- Cap rate 8.4% vs local median 2.7% in Palm Springs — top-decile yield for the area; either an underpriced asset or a hidden risk that comps aren't pricing in. Stress-test before assuming the spread holds.
Location & tenants
- Location reads 66/100 on livability (#348 in CA) — a middle-class / working-renter tenant base. Strengths: amenities A+, commute A+; Watch: crime F, cost of living F, health & safety F.
- Palm Springs Unified (suburban): math 21% / reading 42% proficiency, ranked #328 of 517 in CA (top 63%) — families likely to look elsewhere, expect single-tenant / working-renter base with shorter leases; 73% free/reduced lunch — lower-income household profile, screen leases tightly.
- Zoned schools: Cahuilla Elementary (421 students, 93% FRL); Raymond Cree Middle (708 students, 98% FRL); Palm Springs High (math 30% / reading 51%, grade F, #508 of 1,170 statewide, top 44%, 1,584 students, 97% FRL) — zoned schools average 96% FRL vs 73% district-wide (22 pts higher); higher-poverty schools than district average — tighter screening recommended.
- Market conditions: Rents soft (-0.4%/yr); 498 active listings in the ZIP; 17 comparable units currently listed for rent nearby; rentals lingering (median 45d on market — plan ~5-8 weeks vacancy on turnover, expect pricing pressure); 71% of comp listings sitting > 30 days — soft ceiling on asking rent; solid renter incomes; 9,195 units permitted in Riverside County in 2024 (1,512 in 5+ unit buildings).
- This rent runs 42% of the median local income ($78k/yr) — at the standard rent-burdened threshold; future hikes will face affordability resistance.
Forward outlook
- Local home prices are declining (-3.0%/yr); year-one equity from $2k of loan paydown is wiped out by about $7k of value loss. Plan a longer hold.
- Riverside County population projected at +22% by 2050 — long-run rental-demand tailwind backs the buy-and-hold thesis.
Negotiation context
- It's been on market 30 days — a 2% lower offer ($245k) is reasonable based on typical stale-listing flexibility.
- 16 sale attempts since 21y ago with the ask held roughly flat each time — persistent listings suggest the price (not the market) is what's stuck; bring a comps-based counter.
Risks & watch-outs
- Climate carrying-cost: moderate wildfire risk; extreme-heat days projected 10→28/yr by 2055 (HVAC capex compounding) — expect insurance premiums to compound above CPI over the hold.
Questions for the listing agent
- Is there a deadline driving the sale (1031 exchange, divorce, estate, relocation)? That informs how much negotiation room exists.
- Crime grade is F in this area — have there been break-ins, vandalism, or insurance claims at this property in the last 3 years? What carrier currently insures it and at what premium?
- What's the average days-on-market for RENTAL listings here right now (not sales)? A rising rental-DOM trend means longer vacancies and softer asking-rent achievability than the comps imply.
- What's the recent tenant-quality profile in this submarket — average credit score on applications, eviction rate, late-payment / NSF rate, and stable-employment percentage? A property-management company in the area should have these aggregated.
- How much new for-sale + rental construction is in the pipeline within 1–3 miles? Heavy new supply typically softens prices + rents 12–24 months out; constrained supply supports both.
Investment metrics
- 1% rule
- 1.10% ✓
- Cap rate
- 8.45%
- Cash-on-cash
- 7.69%
- DSCR
- 1.34
- GRM
- 7.6
CMA / ARV
- ARV (median comp)
- $139,137
- List price
- $249,000
- Delta
- 114.90%
- Verdict
- OVERPRICED
- Comps
- 2 within 1.0 mi
Show comp detail 7 sales within ~0.75 mi
| Address | Dist | Beds/Ba | Sqft | Sold | Price | $/sf | Match |
|---|---|---|---|---|---|---|---|
| 310 W Crestview Dr | 0.29mi | 3/4.0 (+1) | 2,775 (+2%) | 5mo | $3,000,000 | $1,081 | 72 |
| 1945 S Mesa Dr | 0.06mi | 3/4.0 (+1) | 2,388 (-12%) | 3mo | $1,775,000 | $743 | 67 |
| 982 E Marion Way | 0.50mi | 3/4.0 (+1) | 2,672 (-2%) | 4mo | $1,200,000 | $449 | 63 |
| 1994 Yucca Pl | 0.62mi | 3/3.5 (+1) | 2,534 (-7%) | 12mo | $1,475,000 | $582 | 44 |
| 2283 S Alhambra Dr | 0.63mi | 3/3.0 (+1) | 2,419 (-11%) | 1mo | $900,000 | $372 | 44 |
| 1977 Ana Maria Pl | 0.62mi | 3/3.0 (+1) | 2,370 (-13%) | 20mo | $1,125,000 | $475 | 25 |
| 2508 S Calle Palo Fierro | 0.74mi | 3/4.0 (+1) | 3,068 (+12%) | 21mo | $2,499,000 | $815 | 20 |
Match score weights: distance 35% · size 25% · config 20% · recency 20%. Top-matched comps best support the ARV.
Projected returns pro-forma
-3.0% appreciation · 0.0% rent growth · sell at horizon
- IRR
- -8.0%
- Equity multiple
- 0.71×
- Total profit
- $-19,906
- Equity at exit
- $37,127
- IRR
- -2.9%
- Equity multiple
- 0.83×
- Total profit
- $-11,614
- Equity at exit
- $21,529
Cash invested: $69,720 (down + closing). Projections, not guarantees.
Landlord ↔ Tenant lean methodology
- Overall (STATE)
- 18 Strongly Tenant-Friendly
- State California
- 18 Strongly Tenant-Friendly · D+13
- County
- — inherits STATE
- City
- — inherits STATE
ZIP-level market 92264
- Rents YoY
- -0.4%
- Active inventory
- 498
- Price-to-rent
- 7.6×
Monthly cashflow live
- Estimated rent
- $2,743 medium interval (Pro) →
- Mortgage (P&I)
- −$1,306
- Tax est. 1.5%
- −$311 /mo · $3,735/yr
- Insurance
- −$104
- HOA
- −$0
- Vacancy / Maint / Mgmt
- −$576
- Net cashflow
- $447
Break-even live
Sensitivity live
| Price | -10% $619 | -5% $533 | +0% $447 | +5% $361 | +10% $274 |
|---|---|---|---|---|---|
| Rent | -10% $230 | -5% $338 | +0% $447 | +5% $555 | +10% $663 |
| Rate | -1.0pp $572 | -0.5pp $510 | base $447 | +0.5pp $382 | +1.0pp $316 |
UW: 25.0% down · 7.5% · 30yr · 1.5% tax · 5.0% vac · 8.0% maint · 8.0% mgmt
Financing live
Cash to close
- Down payment
- $62,250
- Closing costs
- $7,470
- Reserves months
- —
- Total cash needed
- —
Loan-product check · same deal, 3 products live
Conventional
25% down · 7.5% · 30yr
- Down + closing
- —
- Monthly P&I
- —
- Monthly cashflow
- —
- DSCR
- —
- Eligible?
- —
Personal DTI + credit; lowest rate.
DSCR
20% down · 8.5% · 30yr
- Down + closing
- —
- Monthly P&I
- —
- Monthly cashflow
- —
- DSCR
- —
- Eligible?
- —
No personal income docs; deal must DSCR.
Hard money
10% down · 12.0% · 12mo
- Down + closing
- —
- Monthly P&I
- —
- Monthly cashflow
- —
- DSCR
- —
- Eligible?
- —
Short-term bridge; refi at stabilization.
Rent comps 17 comps
| Address | Beds | Baths | Sqft | Rent | $/sqft | DOM | Units | Dist |
|---|---|---|---|---|---|---|---|---|
| 1947 S Joshua Tree Pl Palm Springs, CA | 3.0 | 2.5 | 1928 | $6,000 | $3.11 | 25d | 1 | 0.45mi |
| 791 E Twin Palms Dr Palm Springs, CA | 3.0 | 2.0 | 1793 | $9,700 | $5.41 | 45d | 1 | 0.45mi |
| 500 Paseo Soleado Unit 497 Palm Springs, CA | 3.0 | 2.5 | 1812 | $3,000 | $1.66 | 45d | 1 | 0.48mi |
| 1970 S Joshua Tree Pl Palm Springs, CA | 3.0 | 2.0 | 1957 | $8,175 | $4.18 | 16d | 1 | 0.50mi |
| 1970 S Joshua Tree Pl Palm Springs, CA | 3.0 | 2.0 | 1957 | $8,175 | $4.18 | 45d | 1 | 0.50mi |
| 1201 Surrey Ln Palm Springs, CA | 2.0 | 2.5 | 1896 | $5,500 | $2.90 | 45d | 1 | 0.57mi |
| 17 Cahuilla Hills Dr Palm Springs, CA | 2.0 | 2.0 | 1965 | $10,500 | $5.34 | 45d | 1 | 0.61mi |
| 3000 Cahuilla Hills Dr Palm Springs, CA | 3.0 | 3.0 | 2120 | $7,000 | $3.30 | 45d | 1 | 0.62mi |
| 2560 S Camino Real Palm Springs, CA | 3.0 | 2.0 | 2421 | $25,000 | $10.33 | 45d | 1 | 0.84mi |
| 1533 E Canyon Estates Dr Palm Springs, CA | 2.0 | 2.5 | 2593 | $2,500 | $0.96 | 45d | 1 | 1.01mi |
| 1595 S Calle Rolph Palm Springs, CA | 3.0 | 3.5 | 2509 | $8,500 | $3.39 | 45d | 1 | 1.04mi |
| 1155 E Mesquite Ave Palm Springs, CA | 3.0 | 3.0 | 2700 | $9,500 | $3.52 | 45d | 1 | 1.05mi |
| 1155 E Mesquite Ave Palm Springs, CA | 3.0 | 3.0 | 2700 | $13,000 | $4.81 | 25d | 1 | 1.05mi |
| 1592 S Calle Rolph Palm Springs, CA | 2.0 | 3.0 | 2612 | $6,000 | $2.30 | 45d | 1 | 1.07mi |
| 520 E Murray Canyon Dr Palm Springs, CA | 1.0–3.0 | 2.0–2.5 | 1885 | $2,595 | $1.38 | 0d | 1 | 1.09mi |
| 1331 S Sunrise Way Palm Springs, CA | 3.0 | 3.0 | 2160 | $7,000 | $3.24 | 45d | 1 | 1.21mi |
| 595 E Bogert Trl Palm Springs, CA | 3.0 | 3.5 | 3330 | $25,000 | $7.51 | 0d | 1 | 1.36mi |
Listing history 50 events
-
2026-06-21days on market $249,000 Active 30 DOM
-
2026-06-18days on market $249,000 Active 27 DOM
-
2026-06-17days on market $249,000 Active 26 DOM
-
2026-06-16days on market $249,000 Active 25 DOM
-
2026-06-15days on market $249,000 Active 24 DOM
-
2026-06-13days on market $249,000 Active 22 DOM
-
2026-06-13days on market $249,000 Active 21 DOM
-
2026-06-09days on market $249,000 Active 18 DOM
-
2026-06-08pricedays on market $249,000 Active 17 DOM
-
2026-06-07days on market $260,000 Active 16 DOM
-
2026-06-04days on market $260,000 Active 13 DOM
-
2026-06-03days on market $260,000 Active 12 DOM
-
2026-06-02days on market $260,000 Active 11 DOM
-
2026-06-01days on market $260,000 Active 10 DOM
-
2026-05-31days on market $260,000 Active 9 DOM
-
2026-03-12$299,000 Active 1298-char remark
-
2026-02-24historical
-
2025-10-09$290,000 Active
-
2025-08-19historical
-
2025-02-07$349,000 Active
-
2023-11-14historical
-
2023-09-13$399,000 Active
-
2023-05-09historical
-
2023-03-23price $379,000
-
2023-01-25$398,000 Active
-
2021-09-02historical
-
2021-07-26$346,000 Active
-
2021-07-12soldstatus $2,220,000
-
2018-03-05soldstatus $1,385,000 Closed
-
2018-03-05soldstatus $1,385,000
-
2018-02-19status Pending
-
2018-02-01status Backup Offers Accepted
-
2018-01-17price $1,495,000
-
2017-10-31$1,595,000 Active
-
2013-12-12soldstatus $1,025,000 Closed
-
2013-12-12soldstatus $1,025,000
-
2013-12-04status Pending
-
2013-11-13status Backup Offers Accepted
-
2013-11-02price $1,195,000
-
2013-10-04$1,395,000 Active
-
2012-09-19soldstatus $140,000 Closed
-
2012-09-18soldstatus $135,000
-
2012-08-30status Pending
-
2012-05-22price $229,000
-
2011-08-12$250,000 Active
-
2007-06-11historical
-
2007-06-11historical
-
2007-01-11
-
2007-01-11$449,000
-
2006-12-14historical
ⓘ Source: listings_history table (triggers on properties + properties_extension) + one-shot
backfill from property_details.listing_events for pre-trigger history.
Climate risk First Street
- Flood 1/10 Low FEMA zone X (unshaded) · 0% chance over 30 yrs
- Wildfire 5/10 Major
- Heat 9/10 Extreme 10 d/yr ≥110°F today · 28 d/yr by 30 yrs out
- Wind 1/10 Low
- Air quality 5/10 Major 6 unhealthy d/yr today · 8 by 30 yrs out
Nearby sold comps map
Loading sold comps map…
Walkable amenities ~0.75 mi
Loading nearby amenities…
Taxation est. · year 1
- Rental income
- $32,922
- − Mortgage interest
- −$13,948
- − Property taxes
- −$3,735
- − Insurance
- −$1,245
- − Repairs & maintenance
- −$2,634
- − Management
- −$2,634
- − Depreciation
- −$7,244
- Taxable income
- $1,483
- Est. tax owed @ 24.0%
- −$356
- After-tax cash flow
- $5,003/yr
For passive investors: Depreciation is non-cash, so a rental often shows a tax loss while cash-flowing — sheltering income. Rental losses are passive: they offset passive income freely, and up to $25,000/yr can offset ordinary (W-2) income if you actively participate and your MAGI is under $100k (phasing out to $0 by $150k); unused losses carry forward. On sale, claimed depreciation is recaptured at up to 25%, and gains may owe capital-gains tax (a 1031 exchange can defer both). Figures are a year-1 estimate at your 24.0% rate — not tax advice; consult a CPA.
Schools (NCES district)
- District
- Palm Springs Unified
- NCES district ID
- 0629550
- Math proficiency
- 21% ▼ -7.00%
- Reading proficiency
- 42% ▬ 0.00%
- Median HH income
- $43,638
- Composite
- 26.76/100
- National rank
- #7131
- State rank
- #328 of 517 in CA
Livability — Palm Springs
- Score
- 66/100
- State rank
- #348
- US rank
- #11850
Category grades
Schools grade is shown separately in the Schools card above.
Census & demographics
- Census place
- Palm Springs, CA
- County
- Riverside County · 2,287,001 people
- City population
- 46,786
- Metro
- Riverside-San Bernardino-Ontario, CA
- Population (ZIP)
- 19,899
- Household income
- $77,688
- Rent vs Own
- Severe rent burden
- 1215.0
Population outlook (Riverside County) Hauer SSP2
- Today (2025)
- 2,664,475 people
- By 2030
- 2,802,692 · +5.2%
- By 2040
- 3,050,904 · +14.5%
- By 2050
- 3,256,783 · +22.2%
- By 2075
- 3,655,058 · +37.2%
- By 2100
- 3,766,594 · +41.4%
Race, ethnicity, and origin ACS 2023
- Neighborhood character
- Predominantly White (68%)
- Race & ethnicity
- White 68% Hispanic / Latino 20% Two or more races 12% Asian 6% Black 2% Native American 1%
- Hispanic origin (detail)
- Mexican 16%
- Common ancestry
- Lithuanian 4% Romanian 3% Slovak 3%
- Foreign-born
- 16% · Canada, China, South Korea
- Languages at home
- 81% English-only · Spanish 13% Tagalog/Filipino 2% Other Asian/Pacific 1%
Political lean MEDSL · Riverside
- 2024 margin
- Toss-up / Even · D 48.0% · R 49.3% · Other 2.6%
- 2008→2024 swing
- -3.6pp toward R · 2008: 2.3pp · 2024: -1.3pp
- All cycles
- 2024: R+1.3 2020: D+8.0 2016: D+4.3 2012: R+0.4 2008: D+2.3
Not yet ingested
- Civics
- —
Market trends
- HPI YoY
- ▼ -489.04%
- Current HPI
- 357.0969
- Rent YoY
- ▼ -0.43%
- Metro
- Riverside-San Bernardino-Ontario, CA
- State GDP YoY
- ▲ 3.21%
- F500 in state
- 116
Industry mix (Fortune 500 HQ in CA)
| Industry | F500 HQs | Revenue |
|---|---|---|
| Technology | 27 | $1,492B |
|
||
| Financial Services | 3 | $174B |
|
||
| Retail | 3 | $44B |
|
||
| Insurance | 3 | $26B |
|
||
| Media / Entertainment | 2 | $115B |
|
||
| Pharmaceuticals / Biotech | 2 | $62B |
|
||
Price history
+232.0% since first listed47 events — show timeline
- 2026-06-08 Price Changed $249,000 GPSMLS
- 2026-05-22 Listed $260,000 GPSMLS
- 2026-05-20 Listing Removed — GPSMLS
- 2026-03-12 Listed $299,000 GPSMLS
- 2026-02-24 Listing Removed — GPSMLS
- 2025-10-09 Listed $290,000 GPSMLS
- 2025-08-19 Listing Removed — GPSMLS
- 2025-02-07 Listed $349,000 GPSMLS
- 2023-11-14 Listing Removed — GPSMLS
- 2023-09-13 Listed $399,000 GPSMLS
- 2023-05-09 Listing Removed — GPSMLS
- 2023-03-23 Price Changed $379,000 GPSMLS
- 2023-01-25 Listed $398,000 GPSMLS
- 2021-09-02 Listing Removed — GPSMLS
- 2021-07-26 Listed $346,000 GPSMLS
- 2021-07-12 Sold (Public Records) $2,220,000 Public Records
- 2018-03-05 Sold (Public Records) $1,385,000 Public Records
- 2018-03-05 Sold (MLS) $1,385,000 GPSMLS
- 2018-02-19 Pending — GPSMLS
- 2018-02-01 Pending — GPSMLS
- 2018-01-17 Price Changed $1,495,000 GPSMLS
- 2017-10-31 Listed $1,595,000 GPSMLS
- 2013-12-12 Sold (Public Records) $1,025,000 Public Records
- 2013-12-12 Sold (MLS) $1,025,000 GPSMLS
- 2013-12-04 Pending — GPSMLS
- 2013-11-13 Pending — GPSMLS
- 2013-11-02 Price Changed $1,195,000 GPSMLS
- 2013-10-04 Listed $1,395,000 GPSMLS
- 2012-09-19 Sold (MLS) $140,000 CRMLS
- 2012-09-18 Sold (Public Records) $135,000 Public Records
- 2012-08-30 Pending — CRMLS
- 2012-05-22 Price Changed $229,000 CRMLS
- 2011-08-12 Listed $250,000 CRMLS
- 2007-06-11 Delisted — TheMLS
- 2007-06-11 Listing Removed — CRMLS
- 2007-01-11 Listed $449,000 CRMLS
- 2007-01-11 Listed — TheMLS
- 2006-12-14 Listing Removed — CRMLS
- 2006-12-13 Listing Removed — GPSMLS
- 2006-09-26 Listed $499,500 GPSMLS
- 2006-09-03 Listing Removed — GPSMLS
- 2006-04-05 Listed $499,500 CRMLS
- 2006-04-04 Listed $525,000 GPSMLS
- 2006-02-27 Sold (Public Records) $350,000 Public Records
- 2006-01-05 Delisted — PALM
- 2005-06-24 Sold (Public Records) $75,000 Public Records
- 2005-01-05 Listed — PALM
Property tax history
+11.7%/yrLatest (2025): $27,601 · -2.7% YoY. Source: county tax records.
Cash-flow waterfall
monthlySold comps — $/sqft
last 12 mo · ≤1 miLoading sold comps…