2462 NW 66th Dr · Boca Raton, FL
Flood risk 1/10 · Minimal
- FEMA flood zone
- X (unshaded)
- Chance of flooding over 30 yrs
- 0.0%
- Est. flood insurance / yr
- $507 – $1,088
Fire risk 1/10 · Minimal
- Est. fire insurance / yr
- $947 – $1,759
Heat risk 9/10 · Severe
- Hot days now (above 106°F)
- 7 days/yr
- Hot days in 30 yrs
- 24 days/yr
Wind risk 10/10 · Severe
- Chance of severe wind over 30 yrs
- 99.0%
Air-quality risk 3/10 · Minor
- Unhealthy air days now
- 2 days/yr
- Unhealthy air days in 30 yrs
- 3 days/yr
Risk factors via First Street. Map © Google.
Why this score? — see what drove the A- grade
The composite is a weighted blend of 9 inputs, each scored 0–100. Each bar is that input's sub-score; the figure is the points it added to the 100-point composite (weight × sub-score).
- Cash flow +30.0/30.0
- 1% rule +10.0/10.0
- DSCR +10.0/10.0
- Appreciation +10.0/10.0
- ARV discount +7.5/15.0
- Schools +4.3/10.0
- Livability +3.9/5.0
- Rent growth +3.1/5.0
- Condition / age +2.5/5.0
$410,000
🖨 Deal sheet (PDF) 📄 Offer letter ✓ Due diligence
Listing remarks
* MANDATORY MEMBERSHIP COUNTRY CLUB * Welcome to your dream home in the sought-after Village of the Banyans, nestled within the prestigious Broken Sound Country Club. This beautifully 3-bedroom, 2.5-bathroom two-story residence offers the perfect blend of comfort, style, and functionality. The spacious primary suite is conveniently located on the main level and features a generous walk-in closet and spa-like bath. Upstairs, you'll find two well-appointed guest bedrooms and a full bath, offering privacy and flexibility for family or visitors. Enjoy soaring volume ceilings that fill the home with natural light, and a bright, open layout ideal for both everyday living and entertaining. The ai
Key facts
- 8,455 sq ft lot
- 2 garage spots
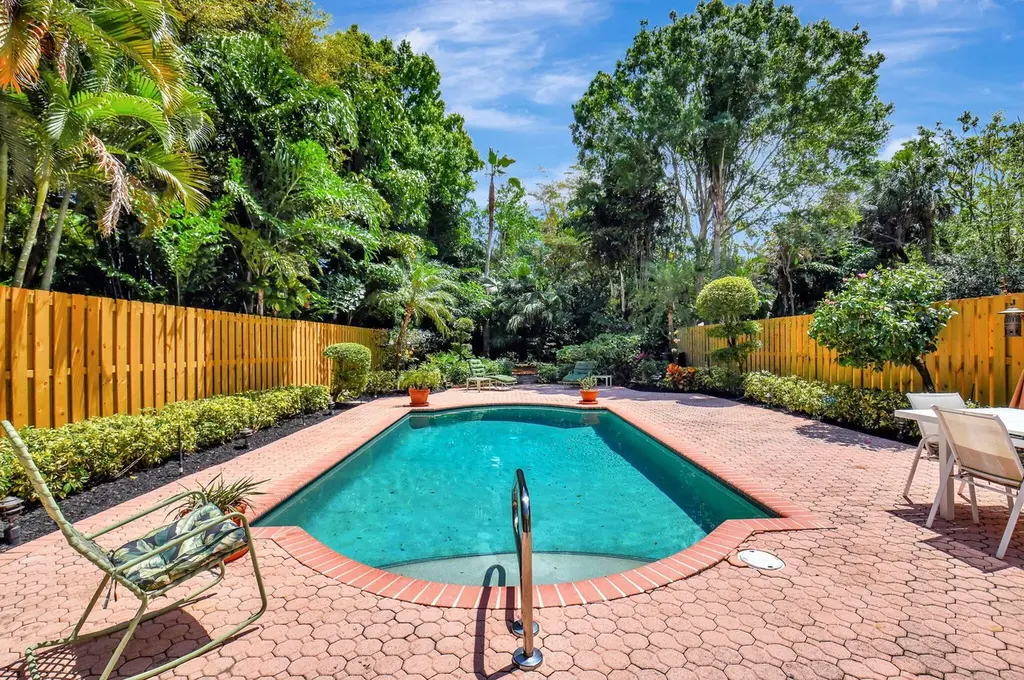
- Pool
Neighborhood map
What this means for you Summary
Snapshot
- This is a 3-bed/2.5-bath single-family listed at $410k.
Deal economics
- At list price, monthly cash flow is $4k ($43k/yr) — positive.
- The deal already cash-flows at list — no discount required.
- Meets the 1% rule at list price ($9k rent vs $410k).
- Cap rate 16.9% vs local median 2.8% in Boca Raton — top-decile yield for the area; either an underpriced asset or a hidden risk that comps aren't pricing in. Stress-test before assuming the spread holds.
Location & tenants
- Location reads 77/100 on livability (#192 in FL, #3,070 nationally) — a middle-class / working-renter tenant base. Strengths: employment A+, health & safety A+, crime B+; Watch: amenities D, cost of living F.
- Palm Beach (suburban): math 46% / reading 53% proficiency, ranked #34 of 73 in FL (top 47%) — families likely to look elsewhere, expect single-tenant / working-renter base with shorter leases.
- Zoned schools: Calusa Elementary School (math 83% / reading 85%, grade A+, #55 of 2,144 statewide, top 3%, 867 students, 17% FRL); Omni Middle School (math 66% / reading 66%, grade A-, #93 of 571 statewide, top 16%, 1,128 students, 29% FRL); Spanish River Community High School (math 64% / reading 74%, grade B, #63 of 667 statewide, top 10%, 2,578 students, 25% FRL) — zoned schools average 24% FRL vs 52% district-wide (28 pts lower); this property's tenant base skews higher-income than the district average.
- Zoned-school proficiency averages 73% at this address vs 50% district-wide (+24 pts) — the actual schools serving this property are materially stronger than the Palm Beach average implies; a family-tenant draw the district grade alone would hide.
- Market conditions: Rents rising (+2.3%/yr); 324 active listings in the ZIP; 18 comparable units currently listed for rent nearby; rentals at typical pace (median 23d on market — plan ~3-4 weeks tenant-placement turnaround); high-income renter base; 3,974 units permitted in Palm Beach County in 2024 (1,012 in 5+ unit buildings).
Forward outlook
- In year one you build about $44k of equity ($3k loan paydown + $41k appreciation (10.0% local appreciation)).
- Palm Beach County population projected at +30% by 2050 — long-run rental-demand tailwind backs the buy-and-hold thesis.
- At projected returns (10.0% appreciation + 2.3% rent growth), your $115k cash investment doubles in ~2 years — after that, you're playing with house money.
- By year 2, paydown + projected appreciation supports a ~$70k cash-out refi (75% LTV) — recoverable capital for the next deal without selling this one.
Negotiation context
- Only 0 days on market — expect competitive offers; lowballing is unlikely to land.
- 7 sale attempts since 23y ago with the ask held roughly flat each time — persistent listings suggest the price (not the market) is what's stuck; bring a comps-based counter.
- Current owner paid $195k; list at $410k implies a 110% gain — meaningful room to come down on a strong offer.
Risks & watch-outs
- Climate carrying-cost: severe wind risk, 99% chance of damaging wind over 30y; extreme-heat days projected 7→24/yr by 2055 (HVAC capex compounding) — expect insurance premiums to compound above CPI over the hold.
Questions for the listing agent
- What does the HOA fee cover, when was the last increase, and are there any pending special assessments or reserve-fund shortfalls?
- Is there a deadline driving the sale (1031 exchange, divorce, estate, relocation)? That informs how much negotiation room exists.
- Schools are A-rated — typically a magnet for longer-tenancy family renters. What's the average tenant stay here, and is there a school-zone premium baked into asking?
- What's the average days-on-market for RENTAL listings here right now (not sales)? A rising rental-DOM trend means longer vacancies and softer asking-rent achievability than the comps imply.
- What's the recent tenant-quality profile in this submarket — average credit score on applications, eviction rate, late-payment / NSF rate, and stable-employment percentage? A property-management company in the area should have these aggregated.
- How much new for-sale + rental construction is in the pipeline within 1–3 miles? Heavy new supply typically softens prices + rents 12–24 months out; constrained supply supports both.
Investment metrics
- 1% rule
- 2.17% ✓
- Cap rate
- 16.88%
- Cash-on-cash
- 37.83%
- DSCR
- 2.68
- GRM
- 3.8
CMA / ARV
- ARV (on-the-fly)
- $1,282,512
- Comps found
- 2
Show comp detail 2 sales within ~0.75 mi
| Address | Dist | Beds/Ba | Sqft | Sold | Price | $/sf | Match |
|---|---|---|---|---|---|---|---|
| 2492 NW 66th Dr | 0.11mi | 3/2.5 | 2,343 (-4%) | 2mo | $830,000 | $354 | 87 |
| 2101 NW 60th Cir | 0.73mi | 3/2.5 | 2,603 (+7%) | 8mo | $1,375,000 | $528 | 47 |
Match score weights: distance 35% · size 25% · config 20% · recency 20%. Top-matched comps best support the ARV.
Projected returns pro-forma
10.0% appreciation · 2.31% rent growth · sell at horizon
- IRR
- 53.0%
- Equity multiple
- 4.90×
- Total profit
- $448,141
- Equity at exit
- $369,360
- IRR
- 46.3%
- Equity multiple
- 10.82×
- Total profit
- $1,127,313
- Equity at exit
- $796,540
Cash invested: $114,800 (down + closing). Projections, not guarantees.
Landlord ↔ Tenant lean methodology
- Overall (STATE)
- 87 Strongly Landlord-Friendly
- State Florida
- 87 Strongly Landlord-Friendly · R+3
- County
- — inherits STATE
- City
- — inherits STATE
ZIP-level market 33496
- Home prices YoY
- 3.5%
- Rents YoY
- 2.3%
- Active inventory
- 324
- Price-to-rent
- 3.8×
Monthly cashflow live
- Estimated rent
- $8,901 high interval (Pro) →
- Mortgage (P&I)
- −$2,150
- Tax from tax record
- −$489 /mo · $5,865/yr
- Insurance
- −$171
- HOA
- −$603
- Vacancy / Maint / Mgmt
- −$1,869
- Net cashflow
- $3,619
Break-even live
Sensitivity live
| Price | -10% $3,851 | -5% $3,735 | +0% $3,619 | +5% $3,503 | +10% $3,387 |
|---|---|---|---|---|---|
| Rent | -10% $2,916 | -5% $3,267 | +0% $3,619 | +5% $3,971 | +10% $4,322 |
| Rate | -1.0pp $3,825 | -0.5pp $3,723 | base $3,619 | +0.5pp $3,513 | +1.0pp $3,405 |
UW: 25.0% down · 7.5% · 30yr · 1.5% tax · 5.0% vac · 8.0% maint · 8.0% mgmt
Financing live
Cash to close
- Down payment
- $102,500
- Closing costs
- $12,300
- Reserves months
- —
- Total cash needed
- —
Loan-product check · same deal, 3 products live
Conventional
25% down · 7.5% · 30yr
- Down + closing
- —
- Monthly P&I
- —
- Monthly cashflow
- —
- DSCR
- —
- Eligible?
- —
Personal DTI + credit; lowest rate.
DSCR
20% down · 8.5% · 30yr
- Down + closing
- —
- Monthly P&I
- —
- Monthly cashflow
- —
- DSCR
- —
- Eligible?
- —
No personal income docs; deal must DSCR.
Hard money
10% down · 12.0% · 12mo
- Down + closing
- —
- Monthly P&I
- —
- Monthly cashflow
- —
- DSCR
- —
- Eligible?
- —
Short-term bridge; refi at stabilization.
Rent comps 18 comps
| Address | Beds | Baths | Sqft | Rent | $/sqft | DOM | Units | Dist |
|---|---|---|---|---|---|---|---|---|
| 2464 NW 66th Dr Boca Raton, FL | 3.0 | 3.5 | 2568 | $10,000 | $3.89 | 24d | 1 | 0.02mi |
| 2485 NW 66th Dr Boca Raton, FL | 3.0 | 2.5 | 2472 | $9,500 | $3.84 | 24d | 1 | 0.07mi |
| 2485 NW 66th Dr Boca Raton, FL | 3.0 | 2.5 | 2472 | $9,500 | $3.84 | 11d | 1 | 0.07mi |
| 2404 NW 67th St Boca Raton, FL | 4.0 | 3.5 | 3081 | $15,000 | $4.87 | 22d | 1 | 0.23mi |
| 5801 NW 24th Ave #1001 Boca Raton, FL | 3.0 | 2.5 | 1957 | $13,000 | $6.64 | 17d | 1 | 0.45mi |
| 2431 NW 59th St #404 Boca Raton, FL | 3.0 | 2.5 | 1957 | $10,000 | $5.11 | 24d | 1 | 0.54mi |
| 6213 NW 21st Ct Boca Raton, FL | 3.0 | 4.0 | 2746 | $10,000 | $3.64 | 24d | 1 | 0.64mi |
| 6503 N Military Trl Boca Raton, FL | 1.0–2.0 | 1.0–2.0 | 1155 | $3,211 | $2.78 | 2d | 52 | 0.88mi |
| 2237 NW 53rd St Boca Raton, FL | 3.0 | 3.5 | 2305 | $25,000 | $10.85 | 24d | 1 | 1.01mi |
| 2771 NW 49th St Boca Raton, FL | 4.0 | 3.0 | 2596 | $6,195 | $2.39 | 18d | 1 | 1.02mi |
| 2093 NW 52nd St Unit 2093 Boca Raton, FL | 3.0 | 2.5 | 1835 | $13,000 | $7.08 | 24d | 1 | 1.12mi |
| 4551 NW 26th Pl Boca Raton, FL | 4.0 | 4.5 | 3250 | $9,850 | $3.03 | 17d | 1 | 1.14mi |
| 17099 Ryton Ln Boca Raton, FL | 3.0 | 2.5 | 2492 | $18,000 | $7.22 | 24d | 1 | 1.16mi |
| 2011 NW 53rd St Boca Raton, FL | 3.0 | 2.5 | 2461 | $11,000 | $4.47 | 13d | 1 | 1.17mi |
| 2683 NW 45th St Boca Raton, FL | 4.0 | 2.5 | 2371 | $6,750 | $2.85 | 5d | 1 | 1.20mi |
| 4695 Brandywine Dr Boca Raton, FL | 3.0 | 3.0 | 1974 | $4,750 | $2.41 | 24d | 1 | 1.30mi |
| 5605 Forest Oaks Ter Delray Beach, FL | 3.0 | 3.0 | 2092 | $10,000 | $4.78 | 14d | 1 | 1.38mi |
| 16850 Colchester Ct Delray Beach, FL | 3.0 | 3.5 | 2715 | $8,000 | $2.95 | 19d | 1 | 1.39mi |
HOA detail
- Monthly dues
- $603 · $7,236/yr
Listing history 21 events
-
2026-03-24historical
-
2026-03-24$410,000
-
2026-02-13historical
-
2025-12-02status Active
-
2025-11-10historical
-
2025-09-05status Active
-
2025-09-03historical Active Under Contract
-
2025-08-18$419,000 Active
-
2025-06-09historical
-
2025-05-06price $525,000
-
2025-04-17$575,000 Active
-
2025-04-16historical
-
2020-11-04soldstatus $195,000
-
2020-10-28soldstatus $195,000 Closed
-
2020-09-24historical Active Under Contract
-
2020-08-26$239,000 Active
-
2003-11-06soldstatus $335,000
-
2003-10-08soldstatus $335,000
-
2003-04-21historical
-
2003-02-26$350,000
-
1992-10-22soldstatus $263,400
ⓘ Source: listings_history table (triggers on properties + properties_extension) + one-shot
backfill from property_details.listing_events for pre-trigger history.
Tax reassessment forecast FL · Resets to sale price
- Current annual tax
- $5,865 · $489/mo
- Projected year-2 tax
- $5,865 · $489/mo
- Expected delta
- $0/yr ($0/mo · 0.0%)
ⓘ Screening estimate from a state-policy table — verify with the county assessor before closing.
Climate risk First Street
- Flood 1/10 Low FEMA zone X (unshaded) · 0% chance over 30 yrs
- Wildfire 1/10 Low
- Heat 9/10 Extreme 7 d/yr ≥106°F today · 24 d/yr by 30 yrs out
- Wind 10/10 Extreme 99% chance of damaging wind over 30 yrs
- Air quality 3/10 Moderate 2 unhealthy d/yr today · 3 by 30 yrs out
Nearby sold comps map
Loading sold comps map…
Walkable amenities ~0.75 mi
Loading nearby amenities…
Taxation est. · year 1
- Rental income
- $106,809
- − Mortgage interest
- −$22,966
- − Property taxes
- −$5,865
- − Insurance
- −$2,050
- − Repairs & maintenance
- −$8,545
- − Management
- −$8,545
- − HOA
- −$7,236
- − Depreciation
- −$11,927
- Taxable income
- $39,675
- Est. tax owed @ 24.0%
- −$9,522
- After-tax cash flow
- $33,905/yr
For passive investors: Depreciation is non-cash, so a rental often shows a tax loss while cash-flowing — sheltering income. Rental losses are passive: they offset passive income freely, and up to $25,000/yr can offset ordinary (W-2) income if you actively participate and your MAGI is under $100k (phasing out to $0 by $150k); unused losses carry forward. On sale, claimed depreciation is recaptured at up to 25%, and gains may owe capital-gains tax (a 1031 exchange can defer both). Figures are a year-1 estimate at your 24.0% rate — not tax advice; consult a CPA.
Schools (NCES district)
- District
- Palm Beach
- NCES district ID
- 1201500
- Math proficiency
- 46% ▼ -16.00%
- Reading proficiency
- 53% ▼ -4.00%
- Median HH income
- $53,943
- Composite
- 42.72/100
- National rank
- #3160
- State rank
- #34 of 73 in FL
Livability — Boca Raton
- Score
- 77/100
- State rank
- #192
- US rank
- #3070
Category grades
Schools grade is shown separately in the Schools card above.
Census & demographics
- Census place
- Boca Raton, FL
- County
- Palm Beach County · 1,438,312 people
- City population
- 250,102
- Metro
- Miami-Fort Lauderdale-Pompano Beach, FL
- Population (ZIP)
- 26,579
- Household income
- $114,885
- Rent vs Own
- Severe rent burden
- 464.0
Population outlook (Palm Beach County) Hauer SSP2
- Today (2025)
- 1,637,487 people
- By 2030
- 1,743,255 · +6.5%
- By 2040
- 1,948,712 · +19.0%
- By 2050
- 2,132,979 · +30.3%
- By 2075
- 2,530,027 · +54.5%
- By 2100
- 2,706,979 · +65.3%
Race, ethnicity, and origin ACS 2023
- Neighborhood character
- Predominantly White (79%)
- Race & ethnicity
- White 79% Hispanic / Latino 11% Two or more races 8% Asian 5% Black 2%
- Hispanic origin (detail)
- Puerto Rican 3%
- Common ancestry
- Scotch-Irish 13% Romanian 9% Italian 3%
- Foreign-born
- 24% · Canada, Jamaica, Dominican Republic
- Languages at home
- 75% English-only · Spanish 9% Other Indo-European 5% Russian/Polish/Slavic 4%
Political lean MEDSL · Palm Beach
- 2024 margin
- Toss-up / Even · D 50.0% · R 49.2%
- 2008→2024 swing
- -22.1pp toward R · 2008: 22.9pp · 2024: 0.8pp
- All cycles
- 2024: D+0.8 2020: D+12.8 2016: D+15.3 2012: D+17.0 2008: D+22.9
Not yet ingested
- Civics
- —
Market trends
- HPI YoY
- ▲ 10.48%
- Current HPI
- 313.9058
- Rent YoY
- ▲ 2.31%
- Metro
- Miami-Fort Lauderdale-Pompano Beach, FL
- State GDP YoY
- ▲ 3.28%
- F500 in state
- 36
Industry mix (Fortune 500 HQ in FL)
| Industry | F500 HQs | Revenue |
|---|---|---|
| Industrial Technology | 2 | $29B |
|
||
| Insurance | 2 | $17B |
|
||
| Retail | 1 | $60B |
|
||
| Technology Distribution | 1 | $58B |
|
||
| Homebuilding | 1 | $35B |
|
||
| Technology Manufacturing | 1 | $35B |
|
||
Price history
+55.7% since first listed21 events — show timeline
- 2026-03-24 Listed $410,000 Beaches MLS
- 2026-03-24 Listing Removed — Beaches MLS
- 2026-02-13 Listing Removed — Beaches MLS
- 2025-12-02 Relisted — Beaches MLS
- 2025-11-10 Listing Removed — Beaches MLS
- 2025-09-05 Relisted — Beaches MLS
- 2025-09-03 Contingent — Beaches MLS
- 2025-08-18 Listed $419,000 Beaches MLS
- 2025-06-09 Listing Removed — Beaches MLS
- 2025-05-06 Price Changed $525,000 Beaches MLS
- 2025-04-17 Listed $575,000 Beaches MLS
- 2025-04-16 Coming Soon — Beaches MLS
- 2020-11-04 Sold (Public Records) $195,000 Public Records
- 2020-10-28 Sold (MLS) $195,000 Beaches MLS
- 2020-09-24 Contingent — Beaches MLS
- 2020-08-26 Listed $239,000 Beaches MLS
- 2003-11-06 Sold (Public Records) $335,000 Public Records
- 2003-10-08 Sold (MLS) $335,000 Beaches MLS
- 2003-04-21 Listing Removed — Beaches MLS
- 2003-02-26 Listed $350,000 Beaches MLS
- 1992-10-22 Sold (Public Records) $263,400 Public Records
Property tax history
+2.3%/yrLatest (2025): $5,865 · -3.3% YoY. Source: county tax records.
Cash-flow waterfall
monthlySold comps — $/sqft
last 12 mo · ≤1 miLoading sold comps…