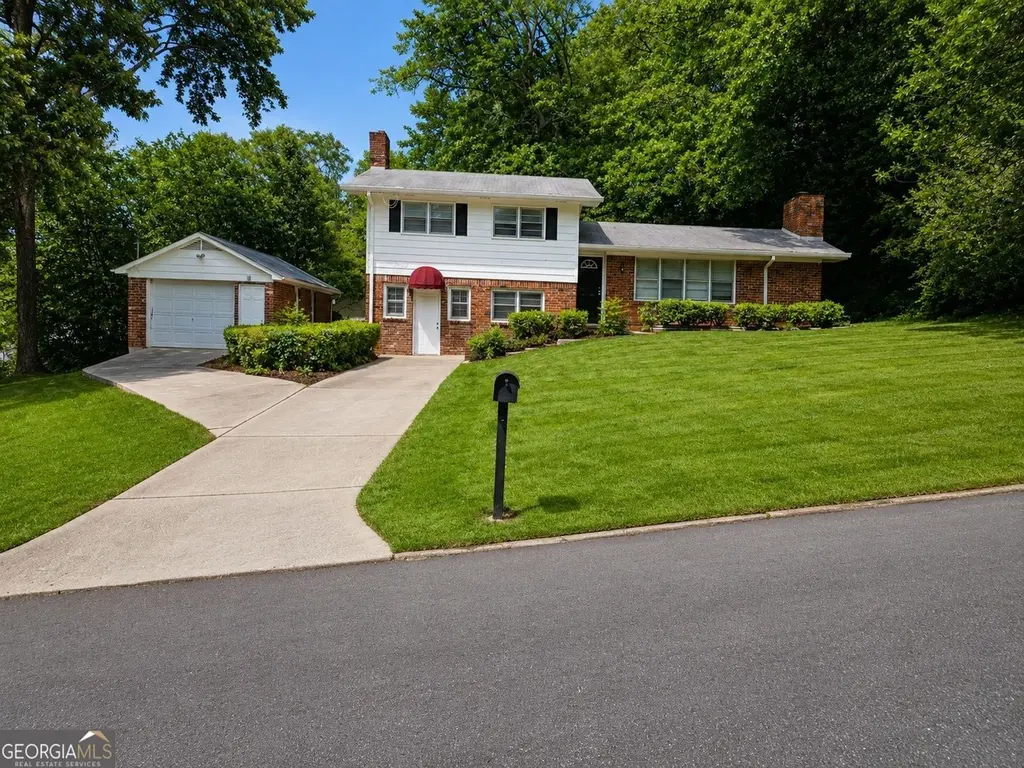
1037 Mell Ave · Clarkston, GA
Flood risk 1/10 · Minimal
- FEMA flood zone
- X (unshaded)
- Chance of flooding over 30 yrs
- 0.0%
- Est. flood insurance / yr
- $507 – $1,088
Fire risk 1/10 · Minimal
- Est. fire insurance / yr
- $963 – $1,789
Heat risk 5/10 · Moderate
- Hot days now (above 104°F)
- 7 days/yr
- Hot days in 30 yrs
- 16 days/yr
Wind risk 5/10 · Moderate
- Chance of severe wind over 30 yrs
- 23.0%
Air-quality risk 6/10 · Moderate
- Unhealthy air days now
- 8 days/yr
- Unhealthy air days in 30 yrs
- 11 days/yr
Risk factors via First Street. Map © Google.
Why this score? — see what drove the D grade
The composite is a weighted blend of 9 inputs, each scored 0–100. Each bar is that input's sub-score; the figure is the points it added to the 100-point composite (weight × sub-score).
- ARV discount +13.4/15.0
- Appreciation +10.0/10.0
- Cash flow +4.4/30.0
- Rent growth +4.0/5.0
- Livability +4.0/5.0
- Condition / age +2.5/5.0
- Schools +2.1/10.0
- 1% rule +1.1/10.0
- DSCR +0.0/10.0
$309,998
🖨 Deal sheet (PDF) 📄 Offer letter ✓ Due diligence
Listing remarks MLS
Beautifully refreshed split-level home in Clarkston featuring warm hardwood floors, updated interior paint, abundant natural light, and flexible living spaces throughout. The home offers a comfortable layout with multiple gathering areas, spacious bedrooms, and a bright kitchen with granite countertops, dark wood cabinetry, stainless steel appliances, and ample storage. The main living area features vaulted ceilings and large windows that create an open and inviting atmosphere, while the lower-level living space with fireplace provides additional flexibility for a second family room, office, media room, or fourth bedroom. A unique bonus feature is the detached enclosed hot tub/flex structure, offering potential for relaxation, entertaining, workout space, hobby use, or creative studio possibilities. The property has been professionally cleaned, refreshed, and thoughtfully prepared for market. Several photos have been virtually staged to help illustrate furniture placement and room potential. Conveniently located near major highways, shopping, dining, parks, and downtown Decatur/Atlanta access while still offering a quiet residential setting. Move-in ready and priced to allow strong value opportunity in today's market.
Key facts
- Bright kitchen
- Gathering areas
- Natural light
Tags
Property features AI
Finance
- HOA & community: Near public transport; Near shopping; Near trails/greenway; Street lights
Exterior
- Parking: Detached garage (1 garage space); Total of 1 parking space
- Utilities: Public water; Public sewer; Electric service with 110V and 220V (220V in laundry); Natural gas available; Cable available
- Home design: Multi-level / split floorplan; Frame and brick (brick on all sides) construction; Resale property
- Construction: Composition shingle roof; Block foundation; Other structures include garage(s)
- Exterior features: Deck; Private spa; Other exterior features
Interior
- Kitchen: Dishwasher; Disposal; Gas range; Microwave; Refrigerator; Stain-finish cabinets with solid surface countertops
- Bedrooms: Three upper-level bedrooms; One lower-level bedroom; No special bedroom features listed
- Flooring: Tile flooring; Hardwood flooring
- Bathrooms: One full bathroom; One half bathroom; Master bath with tub/shower combo
- Heating & cooling: Central heating (forced air, natural gas); Central air conditioning; Ceiling fans; Electric cooling components
- Interior features: Two masonry fireplaces; Low-flow plumbing fixtures; Other interior features
- Laundry & utility: Laundry room on lower level; Electric dryer hookup; Gas water heater
Neighborhood map
What this means for you Summary
Snapshot
- This is a 3-bed/1.5-bath single-family listed at $310k.
Deal economics
- At list price, monthly cash flow is $-812 ($-10k/yr) — negative.
- To cash-flow at today's rent, offer at most $167k (46.3% below list).
- To meet the 1% rule (rent ≥ 1% of price), the offer needs to be $189k (39.0% below list).
- Recommended offer: $167k (46.3% below list) — sets the bar for cash-flow.
Location & tenants
- Location reads 79/100 on livability (#14 in GA, #2,067 nationally) — a middle-class / working-renter tenant base. Strengths: commute A+, cost of living A+, housing A+; Watch: amenities C-, crime D+, employment D-.
- Dekalb County (suburban): math 19% / reading 28% proficiency, ranked #125 of 174 in GA (top 72%) — low school quality limits family demand, transient renter base, plan for 1-2y turnover; 68% free/reduced lunch — lower-income household profile, screen leases tightly.
- Zoned schools: Jolly Elementary School (math 4% / reading 8%, grade F, #1,154 of 1,228 statewide, top 94%, 689 students, 100% FRL); Freedom Middle School (math 6% / reading 16%, grade F, #426 of 470 statewide, top 91%, 1,131 students, 100% FRL); Clarkston High School (math 12% / reading 8%, grade F, #365 of 424 statewide, top 88%, 1,413 students, 100% FRL) — zoned schools average 100% FRL vs 68% district-wide (32 pts higher); higher-poverty schools than district average — tighter screening recommended.
- Zoned-school proficiency averages 9% at this address vs 24% district-wide (-15 pts) — the specific schools serving this property underperform the Dekalb County average; the district grade overstates school quality for this exact location.
- Market conditions: Rents rising fast (+5.9%/yr); 37 active listings in the ZIP; 40 comparable units currently listed for rent nearby; rentals at typical pace (median 15d on market — plan ~3-4 weeks tenant-placement turnaround); 1,240 units permitted in DeKalb County in 2024 (385 in 5+ unit buildings).
- This rent runs 43% of the median local income ($52k/yr) — at the standard rent-burdened threshold; future hikes will face affordability resistance.
Forward outlook
- In year one you build about $33k of equity ($2k loan paydown + $31k appreciation (10.0% local appreciation)).
- DeKalb County population projected at +28% by 2050 — long-run rental-demand tailwind backs the buy-and-hold thesis.
- By year 2, paydown + projected appreciation supports a ~$53k cash-out refi (75% LTV) — recoverable capital for the next deal without selling this one.
Negotiation context
- It's been on market 44 days — a 3% lower offer ($301k) is reasonable based on typical stale-listing flexibility.
- 7 sale attempts since 11y ago with the ask held roughly flat each time — persistent listings suggest the price (not the market) is what's stuck; bring a comps-based counter.
- Current owner paid $88k; list at $310k implies a 252% gain — meaningful room to come down on a strong offer.
Risks & watch-outs
- Climate carrying-cost: moderate wind risk, 23% chance of damaging wind over 30y; extreme-heat days projected 7→16/yr by 2055 (HVAC capex compounding) — expect insurance premiums to compound above CPI over the hold.
Questions for the listing agent
- What do current leases actually rent for vs. the listed asking? Can we see a recent rent roll and the last 12 months of T-12 income?
- It's been on market 44 days. Have you received any prior offers? Is the seller open to a 46% concession, seller financing, or rate buy-down credit?
- Built in 1964 — when were the roof, HVAC, electrical panel, plumbing, and water heater last replaced?
- Is there a deadline driving the sale (1031 exchange, divorce, estate, relocation)? That informs how much negotiation room exists.
- Schools are F-rated, which usually means shorter tenancies and higher turnover. Who's the typical renter profile here, and what's been the actual vacancy rate?
- Crime grade is D in this area — have there been break-ins, vandalism, or insurance claims at this property in the last 3 years? What carrier currently insures it and at what premium?
- The area grade is low — what's the realistic commute time and amenity access for the typical tenant pool here? Any planned neighborhood developments (good or bad) we should know about?
- What's the average days-on-market for RENTAL listings here right now (not sales)? A rising rental-DOM trend means longer vacancies and softer asking-rent achievability than the comps imply.
- What's the recent tenant-quality profile in this submarket — average credit score on applications, eviction rate, late-payment / NSF rate, and stable-employment percentage? A property-management company in the area should have these aggregated.
- How much new for-sale + rental construction is in the pipeline within 1–3 miles? Heavy new supply typically softens prices + rents 12–24 months out; constrained supply supports both.
Investment metrics
- 1% rule
- 0.61% ✗
- Cap rate
- 3.15%
- Cash-on-cash
- -11.23%
- DSCR
- 0.50
- GRM
- 13.7
CMA / ARV
- ARV (median comp)
- $357,118
- List price
- $309,998
- Delta
- -13.19%
- Verdict
- UNDERPRICED
- Comps
- 20 within 1.0 mi
Show comp detail 10 sales within ~0.75 mi
| Address | Dist | Beds/Ba | Sqft | Sold | Price | $/sf | Match |
|---|---|---|---|---|---|---|---|
| 3436 Mell Pl | 0.21mi | 3/2.0 | 1,623 (+0%) | 18mo | $315,000 | $194 | 73 |
| 972 Pecan St | 0.16mi | 4/3.0 (+1) | 1,597 (-2%) | 11mo | $365,000 | $229 | 70 |
| 1094 Seville Dr | 0.65mi | 3/2.0 | 1,613 (-0%) | 12mo | $360,000 | $223 | 57 |
| 3518 W Hill St | 0.16mi | 4/2.5 (+1) | 1,764 (+9%) | 24mo | $435,000 | $247 | 49 |
| 1116 Rogers St | 0.62mi | 3/2.0 | 1,477 (-9%) | 10mo | $365,000 | $247 | 46 |
| 3906 Market St | 0.71mi | 3/2.0 | 1,857 (+15%) | 3mo | $178,000 | $96 | 38 |
| 1193 De Leon Ct | 0.54mi | 3/1.5 | 1,851 (+14%) | 15mo | $317,500 | $172 | 38 |
| 1147 Rogers St | 0.69mi | 3/2.0 | 1,450 (-10%) | 24mo | $325,000 | $224 | 28 |
| 3735 Cranford Dr | 0.63mi | 4/1.5 (+1) | 1,803 (+11%) | 24mo | $329,900 | $183 | 27 |
| 3715 Debelle St | 0.67mi | 3/2.0 | 1,378 (-15%) | 19mo | $325,000 | $236 | 26 |
Match score weights: distance 35% · size 25% · config 20% · recency 20%. Top-matched comps best support the ARV.
Projected returns pro-forma
10.0% appreciation · 5.88% rent growth · sell at horizon
- IRR
- 17.1%
- Equity multiple
- 2.42×
- Total profit
- $122,873
- Equity at exit
- $279,271
- IRR
- 16.8%
- Equity multiple
- 5.79×
- Total profit
- $415,632
- Equity at exit
- $602,258
Cash invested: $86,799 (down + closing). Projections, not guarantees.
Landlord ↔ Tenant lean methodology
- Overall (STATE)
- 90 Strongly Landlord-Friendly
- State Georgia
- 90 Strongly Landlord-Friendly · R+3
- County
- — inherits STATE
- City
- — inherits STATE
ZIP-level market 30021
- Home prices YoY
- 13.2%
- Rents YoY
- 5.9%
- Active inventory
- 37
- Price-to-rent
- 13.7×
Monthly cashflow live
- Estimated rent
- $1,892 high interval (Pro) →
- Mortgage (P&I)
- −$1,626
- Tax from tax record
- −$552 /mo · $6,622/yr
- Insurance
- −$129
- HOA
- −$0
- Vacancy / Maint / Mgmt
- −$397
- Net cashflow
- $-812
Break-even live
Sensitivity live
| Price | -10% $-637 | -5% $-724 | +0% $-812 | +5% $-900 | +10% $-988 |
|---|---|---|---|---|---|
| Rent | -10% $-962 | -5% $-887 | +0% $-812 | +5% $-737 | +10% $-663 |
| Rate | -1.0pp $-656 | -0.5pp $-733 | base $-812 | +0.5pp $-893 | +1.0pp $-974 |
UW: 25.0% down · 7.5% · 30yr · 1.5% tax · 5.0% vac · 8.0% maint · 8.0% mgmt
Financing live
Cash to close
- Down payment
- $77,500
- Closing costs
- $9,300
- Reserves months
- —
- Total cash needed
- —
Loan-product check · same deal, 3 products live
Conventional
25% down · 7.5% · 30yr
- Down + closing
- —
- Monthly P&I
- —
- Monthly cashflow
- —
- DSCR
- —
- Eligible?
- —
Personal DTI + credit; lowest rate.
DSCR
20% down · 8.5% · 30yr
- Down + closing
- —
- Monthly P&I
- —
- Monthly cashflow
- —
- DSCR
- —
- Eligible?
- —
No personal income docs; deal must DSCR.
Hard money
10% down · 12.0% · 12mo
- Down + closing
- —
- Monthly P&I
- —
- Monthly cashflow
- —
- DSCR
- —
- Eligible?
- —
Short-term bridge; refi at stabilization.
Rent comps 40 comps
| Address | Beds | Baths | Sqft | Rent | $/sqft | DOM | Units | Dist |
|---|---|---|---|---|---|---|---|---|
| 1015 Casa Dr Clarkston, GA | 4.0 | 2.0 | 1844 | $1,950 | $1.06 | 26d | 1 | 0.08mi |
| 3519 W Hill St Clarkston, GA | 2.0 | 1.0–1.5 | 857 | $1,299 | $1.51 | 7d | 1 | 0.12mi |
| 965 Smith St Clarkston, GA | 2.0 | 1.0 | 1542 | $1,500 | $0.97 | 45d | 1 | 0.25mi |
| 3545 Orchard St Clarkston, GA | 3.0 | 1.0 | 1232 | $1,650 | $1.34 | 1d | 1 | 0.28mi |
| 3545 Orchard St Clarkston, GA | 3.0 | 1.0 | 1232 | $1,650 | $1.34 | 18d | 1 | 0.28mi |
| 1000 Montreal Rd Clarkston, GA | 1.0–3.0 | 1.0–2.5 | 1250 | $1,340 | $1.07 | 1d | 17 | 0.29mi |
| 1086 Montreal Rd Clarkston, GA | 2.0 | 1.5–2.0 | 1252 | $1,318 | $1.05 | 12d | 10 | 0.39mi |
| 1039 Verdi Way Clarkston, GA | 3.0 | 1.5 | 1053 | $1,995 | $1.89 | 7d | 1 | 0.60mi |
| 792 Jolly Ave S Clarkston, GA | 1.0–2.0 | 1.0–2.0 | 947 | $1,100 | $1.16 | 7d | 12 | 0.67mi |
| 3743 Poplar Dr Clarkston, GA | 3.0 | 2.0 | 1540 | $1,900 | $1.23 | 7d | 1 | 0.68mi |
| 774 Northern Ave Unit B14 Clarkston, GA | 2.0 | 2.0 | 1100 | $1,250 | $1.14 | 1d | 1 | 0.70mi |
| 774 Northern Ave Unit A14 Clarkston, GA | 2.0 | 2.0 | 1100 | $1,250 | $1.14 | 45d | 1 | 0.70mi |
| 3145 Misty Creek Dr Decatur, GA | 1.0–2.0 | 1.0–2.0 | 990 | $1,725 | $1.74 | 5d | 8 | 0.76mi |
| 1200 Montreal Rd Tucker, GA | 1.0–2.0 | 1.0–2.0 | 986 | $1,860 | $1.89 | 3d | 16 | 0.77mi |
| 788 Angora Aly Scottdale, GA | 3.0 | 3.5 | 1622 | $2,850 | $1.76 | 3d | 1 | 0.82mi |
| 1204 Brockett Rd Clarkston, GA | 2.0 | 1.0–2.0 | 1160 | $1,375 | $1.19 | 45d | 10 | 0.93mi |
| 3548 Lantern View Ln Scottdale, GA | 3.0 | 2.5 | 1500 | $2,000 | $1.33 | 45d | 1 | 1.01mi |
| 3071 Francine Dr Decatur, GA | 3.0 | 2.0 | 1190 | $2,300 | $1.93 | 26d | 1 | 1.01mi |
| 1350 Brockett Pl Clarkston, GA | 2.0 | 2.0 | 1244 | $1,350 | $1.09 | 5d | 1 | 1.02mi |
| 1350 Brockett Pl Clarkston, GA | 2.0 | 2.0 | 1244 | $1,350 | $1.09 | 1d | 1 | 1.02mi |
| 417 Ridge Creek Dr Clarkston, GA | 2.0 | 2.0 | 1239 | $1,399 | $1.13 | 26d | 1 | 1.02mi |
| 3073 Cedar Creek Pkwy Decatur, GA | 1.0–3.0 | 1.0–2.0 | 1050 | $1,641 | $1.56 | 1d | 45 | 1.05mi |
| 3085 Piper Dr Decatur, GA | 3.0 | 2.0 | 1845 | $2,421 | $1.31 | 45d | 1 | 1.07mi |
| 751 N Indian Creek Dr Clarkston, GA | 1.0–3.0 | 1.0–2.0 | 995 | $1,325 | $1.33 | 45d | 1 | 1.07mi |
| 1480 Edinburgh Dr Tucker, GA | 3.0 | 2.0 | 1488 | $2,640 | $1.77 | 26d | 1 | 1.14mi |
| 3040 Valley Cir Decatur, GA | 4.0 | 3.0 | 2250 | $3,200 | $1.42 | 45d | 1 | 1.14mi |
| 3582 Cloudland Dr Stone Mountain, GA | 4.0 | 2.0 | 2073 | $2,800 | $1.35 | 45d | 1 | 1.15mi |
| 3590 Cloudland Dr Stone Mountain, GA | 3.0 | 2.0 | 2205 | $3,000 | $1.36 | 45d | 1 | 1.16mi |
| 1250 Brockett Rd Clarkston, GA | 1.0–2.0 | 1.0–2.5 | 1100 | $1,725 | $1.57 | 1d | 15 | 1.17mi |
| 777 Valleybrook Xing Decatur, GA | 1.0–2.0 | 1.0–2.0 | 1019 | $1,499 | $1.47 | 45d | 1 | 1.18mi |
| 1211 Robinwood Rd Decatur, GA | 2.0 | 1.0 | 1053 | $1,850 | $1.76 | 45d | 1 | 1.18mi |
| 2501 Lawrenceville Hwy Decatur, GA | 1.0–2.0 | 1.0–1.5 | 875 | $1,328 | $1.52 | 0d | 2 | 1.20mi |
| 3800 Brockett Trl Clarkston, GA | 1.0–3.0 | 1.0–2.0 | 1192 | $1,979 | $1.66 | 1d | 15 | 1.21mi |
| 3642 Marlborough Dr Tucker, GA | 3.0 | 1.5 | 1833 | $2,300 | $1.25 | 14d | 1 | 1.22mi |
| 524 Warren Ave Scottdale, GA | 2.0 | 3.5 | 1248 | $1,500 | $1.20 | 14d | 1 | 1.22mi |
| 1319 Kingston Trl Decatur, GA | 3.0 | 4.0 | 1940 | $2,600 | $1.34 | 22d | 1 | 1.22mi |
| 1319 Kingston Trl Unit 1 Decatur, GA | 3.0 | 4.0 | 1940 | $2,600 | $1.34 | 7d | 1 | 1.22mi |
| 1290 Hopkins Dr Decatur, GA | 4.0 | 4.0 | 2050 | $2,895 | $1.41 | 26d | 1 | 1.24mi |
| 3524 Mount Blue Ave Tucker, GA | 4.0 | 3.0 | 2194 | $3,295 | $1.50 | 17d | 1 | 1.40mi |
| 3524 Mount Blue Ave Tucker, GA | 4.0 | 3.5 | 2194 | $2,895 | $1.32 | 1d | 1 | 1.40mi |
Listing history 38 events
-
2026-06-21days on market $309,998 Active 44 DOM
-
2026-06-18days on market $309,998 Active 41 DOM
-
2026-06-17days on market $309,998 Active 40 DOM
-
2026-06-16days on market $309,998 Active 39 DOM
-
2026-06-15days on market $309,998 Active 38 DOM
-
2026-06-13days on market $309,998 Active 36 DOM
-
2026-06-09days on market $309,998 Active 32 DOM
-
2026-06-08days on market $309,998 Active 31 DOM
-
2026-06-07days on market $309,998 Active 30 DOM
-
2026-06-04days on market $309,998 Active 27 DOM
-
2026-06-03days on market $309,998 Active 26 DOM
-
2026-06-02days on market $309,998 Active 25 DOM
-
2026-06-01days on market $309,998 Active 24 DOM
-
2026-05-31days on market $309,998 Active 23 DOM
-
2026-05-08$319,998 New 1237-char remark
Show marketing remark (1237 chars)
Beautifully refreshed split-level home in Clarkston featuring warm hardwood floors, updated interior paint, abundant natural light, and flexible living spaces throughout. The home offers a comfortable layout with multiple gathering areas, spacious bedrooms, and a bright kitchen with granite countertops, dark wood cabinetry, stainless steel appliances, and ample storage. The main living area features vaulted ceilings and large windows that create an open and inviting atmosphere, while the lower-level living space with fireplace provides additional flexibility for a second family room, office, media room, or fourth bedroom. A unique bonus feature is the detached enclosed hot tub/flex structure, offering potential for relaxation, entertaining, workout space, hobby use, or creative studio possibilities. The property has been professionally cleaned, refreshed, and thoughtfully prepared for market. Several photos have been virtually staged to help illustrate furniture placement and room potential. Conveniently located near major highways, shopping, dining, parks, and downtown Decatur/Atlanta access while still offering a quiet residential setting. Move-in ready and priced to allow strong value opportunity in today's market.
-
2026-05-08$319,998 Active 1243-char remark
Show marketing remark (1237 chars)
Beautifully refreshed split-level home in Clarkston featuring warm hardwood floors, updated interior paint, abundant natural light, and flexible living spaces throughout. The home offers a comfortable layout with multiple gathering areas, spacious bedrooms, and a bright kitchen with granite countertops, dark wood cabinetry, stainless steel appliances, and ample storage. The main living area features vaulted ceilings and large windows that create an open and inviting atmosphere, while the lower-level living space with fireplace provides additional flexibility for a second family room, office, media room, or fourth bedroom. A unique bonus feature is the detached enclosed hot tub/flex structure, offering potential for relaxation, entertaining, workout space, hobby use, or creative studio possibilities. The property has been professionally cleaned, refreshed, and thoughtfully prepared for market. Several photos have been virtually staged to help illustrate furniture placement and room potential. Conveniently located near major highways, shopping, dining, parks, and downtown Decatur/Atlanta access while still offering a quiet residential setting. Move-in ready and priced to allow strong value opportunity in today's market.
-
2019-02-02historical
-
2018-11-01$189,000 New
-
2016-01-19price $88,000
-
2016-01-07price $88,000
-
2016-01-05soldstatus $88,000
-
2015-12-31soldstatus $88,000 Sold
-
2015-12-31price $149,900
-
2015-12-31soldstatus $88,000 Sold
-
2015-12-29historical Pending
-
2015-12-29status Under Contract
-
2015-12-28price $149,900
-
2015-12-18status Back On Market
-
2015-12-18status Active
-
2015-12-07status Under Contract
-
2015-12-07historical Pending
-
2015-12-07historical
-
2015-10-21price $149,900
-
2015-10-21price $149,900
-
2015-09-30$180,000 New
-
2015-09-28$180,000 Active
-
1981-05-04soldstatus $52,700
-
1981-05-04soldstatus $52,700
ⓘ Source: listings_history table (triggers on properties + properties_extension) + one-shot
backfill from property_details.listing_events for pre-trigger history.
Tax reassessment forecast GA · Resets to sale price
- Current annual tax
- $6,622 · $552/mo
- Projected year-2 tax
- $6,622 · $552/mo
- Expected delta
- $0/yr ($0/mo · 0.0%)
ⓘ Screening estimate from a state-policy table — verify with the county assessor before closing.
Climate risk First Street
- Flood 1/10 Low FEMA zone X (unshaded) · 0% chance over 30 yrs
- Wildfire 1/10 Low
- Heat 5/10 Major 7 d/yr ≥104°F today · 16 d/yr by 30 yrs out
- Wind 5/10 Major 23% chance of damaging wind over 30 yrs
- Air quality 6/10 Major 8 unhealthy d/yr today · 11 by 30 yrs out
Nearby sold comps map
Loading sold comps map…
Walkable amenities ~0.75 mi
Loading nearby amenities…
Taxation est. · year 1
- Rental income
- $22,701
- − Mortgage interest
- −$17,365
- − Property taxes
- −$6,622
- − Insurance
- −$1,550
- − Repairs & maintenance
- −$1,816
- − Management
- −$1,816
- − Depreciation
- −$9,018
- Taxable loss
- −$15,486
- Est. tax savings @ 24.0%
- +$3,717
- After-tax cash flow
- $-6,030/yr
For passive investors: Depreciation is non-cash, so a rental often shows a tax loss while cash-flowing — sheltering income. Rental losses are passive: they offset passive income freely, and up to $25,000/yr can offset ordinary (W-2) income if you actively participate and your MAGI is under $100k (phasing out to $0 by $150k); unused losses carry forward. On sale, claimed depreciation is recaptured at up to 25%, and gains may owe capital-gains tax (a 1031 exchange can defer both). Figures are a year-1 estimate at your 24.0% rate — not tax advice; consult a CPA.
Schools (NCES district)
- District
- Dekalb County
- NCES district ID
- 1301740
- Math proficiency
- 19% ▼ -12.00%
- Reading proficiency
- 28% ▼ -7.00%
- Median HH income
- $51,448
- Composite
- 20.92/100
- National rank
- #8482
- State rank
- #125 of 174 in GA
Livability — Clarkston
- Score
- 79/100
- State rank
- #14
- US rank
- #2067
Category grades
Schools grade is shown separately in the Schools card above.
Census & demographics
- Census place
- Clarkston, GA
- County
- Dekalb County · 782,738 people
- City population
- 27,781
- Metro
- Atlanta-Sandy Springs-Alpharetta, GA
- Population (ZIP)
- 27,781
- Household income
- $52,278
- Rent vs Own
- Severe rent burden
- 1622.0
Population outlook (DeKalb County) Hauer SSP2
- Today (2025)
- 839,977 people
- By 2030
- 891,768 · +6.2%
- By 2040
- 988,894 · +17.7%
- By 2050
- 1,074,583 · +27.9%
- By 2075
- 1,245,026 · +48.2%
- By 2100
- 1,303,135 · +55.1%
Race, ethnicity, and origin ACS 2023
- Neighborhood character
- Diverse neighborhood (Simpson 0.57)
- Race & ethnicity
- Black 62% Asian 15% White 14% Two or more races 6% Hispanic / Latino 5%
- Hispanic origin (detail)
- Common ancestry
- Ukrainian 1% Italian 1% Slovak 1%
- Foreign-born
- 43% · Philippines, Canada, India
- Languages at home
- 43% English-only · Other Indo-European 8% Spanish 5% Other Asian/Pacific 5%
Political lean MEDSL · DeKalb
- 2024 margin
- Solid D (+64.8) · D 81.9% · R 17.1% · Other 1.0%
- 2008→2024 swing
- +6.1pp toward D · 2008: 58.6pp · 2024: 64.8pp
- All cycles
- 2024: D+64.8 2020: D+67.4 2016: D+64.8 2012: D+56.8 2008: D+58.6
Not yet ingested
- Civics
- —
Market trends
- HPI YoY
- ▲ 41.94%
- Current HPI
- 360.0584
- Rent YoY
- ▲ 5.88%
- Metro
- Atlanta-Sandy Springs-Alpharetta, GA
- State GDP YoY
- ▲ 2.66%
- F500 in state
- 28
Industry mix (Fortune 500 HQ in GA)
| Industry | F500 HQs | Revenue |
|---|---|---|
| Paper / Packaging | 2 | $29B |
|
||
| Retail | 1 | $160B |
|
||
| Transportation / Logistics | 1 | $91B |
|
||
| Airlines | 1 | $62B |
|
||
| Consumer Goods | 1 | $47B |
|
||
| Utilities | 1 | $25B |
|
||
Price history
+488.2% since first listed26 events — show timeline
- 2026-05-19 Price Changed $309,998 GAMLS
- 2026-05-19 Price Changed $309,998 FMLS
- 2026-05-08 Listed $319,998 FMLS
- 2026-05-08 Listed $319,998 GAMLS
- 2019-02-02 Listing Removed — GAMLS
- 2018-11-01 Listed $189,000 GAMLS
- 2016-01-19 Price Changed $88,000 GAMLS
- 2016-01-07 Price Changed $88,000 FMLS
- 2016-01-05 Sold (Public Records) $88,000 Public Records
- 2015-12-31 Sold (MLS) $88,000 GAMLS
- 2015-12-31 Sold (MLS) $88,000 FMLS
- 2015-12-31 Price Changed $149,900 FMLS
- 2015-12-29 Contingent — FMLS
- 2015-12-29 Pending — GAMLS
- 2015-12-28 Price Changed $149,900 GAMLS
- 2015-12-18 Relisted — GAMLS
- 2015-12-18 Relisted — FMLS
- 2015-12-07 Pending — GAMLS
- 2015-12-07 Contingent — FMLS
- 2015-12-07 Listing Removed — GAMLS
- 2015-10-21 Price Changed $149,900 GAMLS
- 2015-10-21 Price Changed $149,900 FMLS
- 2015-09-30 Listed $180,000 GAMLS
- 2015-09-28 Listed $180,000 FMLS
- 1981-05-04 Sold (Public Records) $52,700 Public Records
- 1981-05-04 Sold (Public Records) $52,700 Public Records
Property tax history
+8.1%/yrLatest (2025): $6,622 · +5.6% YoY. Source: county tax records.
Cash-flow waterfall
monthlySold comps — $/sqft
last 12 mo · ≤1 miLoading sold comps…