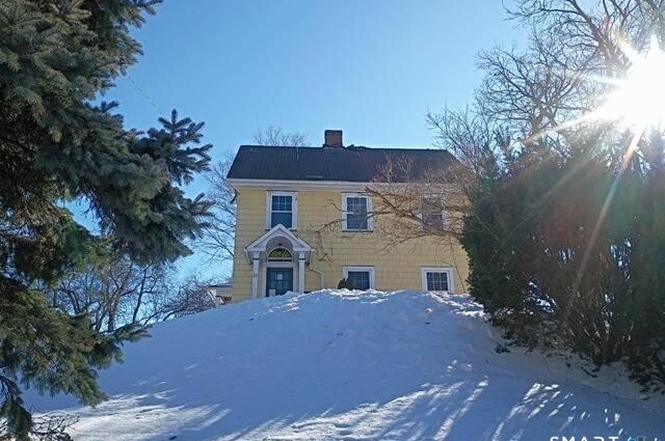
15 Woodruff St · Plantsville, CT
Flood risk 1/10 · Minimal
- FEMA flood zone
- X (unshaded)
- Chance of flooding over 30 yrs
- 0.0%
- Est. flood insurance / yr
- $473 – $860
Fire risk 3/10 · Minor
- Est. fire insurance / yr
- $829 – $1,539
Heat risk 5/10 · Moderate
- Hot days now (above 97°F)
- 7 days/yr
- Hot days in 30 yrs
- 15 days/yr
Wind risk 6/10 · Moderate
- Chance of severe wind over 30 yrs
- 27.0%
Air-quality risk 3/10 · Minor
- Unhealthy air days now
- 2 days/yr
- Unhealthy air days in 30 yrs
- 3 days/yr
Risk factors via First Street. Map © Google.
Why this score? — see what drove the C+ grade
The composite is a weighted blend of 9 inputs, each scored 0–100. Each bar is that input's sub-score; the figure is the points it added to the 100-point composite (weight × sub-score).
- Cash flow +21.1/30.0
- ARV discount +15.0/15.0
- DSCR +6.7/10.0
- 1% rule +6.1/10.0
- Schools +5.2/10.0
- Livability +3.9/5.0
- Rent growth +2.5/5.0
- Condition / age +2.5/5.0
- Appreciation +0.0/10.0
$209,000
🖨 Deal sheet (PDF) 📄 Offer letter ✓ Due diligence
Listing remarks MLS
Lovely well cared for colonial in move in condition. Special features include good size kitchen, handcrafted built-in book cases, red brick fpl, screened in porch off din/liv rm and more. Ask about buyer exclusion.
Key facts
- Near memorial park
- Natural light
- Original finishes
Tags
Neighborhood map
What this means for you Summary
Snapshot
- This is a 3-bed/1.0-bath single-family listed at $209k.
Deal economics
- At list price, monthly cash flow is $298 ($4k/yr) — positive.
- The deal already cash-flows at list — no discount required.
- Meets the 1% rule at list price ($2k rent vs $209k).
- Cap rate 8.0% vs local median 3.1% in Plantsville — top-decile yield for the area; either an underpriced asset or a hidden risk that comps aren't pricing in. Stress-test before assuming the spread holds.
Location & tenants
- Location reads 77/100 on livability (#46 in CT, #3,164 nationally) — a middle-class / working-renter tenant base. Strengths: crime A+, employment A+, housing A+; Watch: cost of living C-, amenities F, commute F.
- Southington School District (suburban): math 52% / reading 64% proficiency, ranked #51 of 153 in CT (top 33%) — acceptable for families but not a draw, mixed tenant base, ~2y average lease; only 11% free/reduced lunch — higher-income household profile.
- Zoned schools: Hatton Elementary School (math 67% / reading 62%, grade B, #118 of 553 statewide, top 23%, 327 students, 29% FRL); Joseph A. Depaolo Middle School (math 43% / reading 63%, grade C+, #71 of 175 statewide, top 41%, 694 students, 24% FRL); Southington High School (math 48% / reading 68%, grade C, #50 of 194 statewide, top 25%, 1,945 students, 22% FRL).
- Market conditions: 111 active listings in the ZIP; 6 comparable units currently listed for rent nearby; rentals at typical pace (median 26d on market — plan ~3-4 weeks tenant-placement turnaround); high-income renter base; 1,867 units permitted in Capitol Planning Region in 2024 (1,399 in 5+ unit buildings).
Forward outlook
- Local home prices are declining (-3.0%/yr); year-one equity from $1k of loan paydown is wiped out by about $6k of value loss. Plan a longer hold.
Negotiation context
- Only 9 days on market — expect competitive offers; lowballing is unlikely to land.
- 5 sale attempts since 21y ago with the ask held roughly flat each time — persistent listings suggest the price (not the market) is what's stuck; bring a comps-based counter.
Risks & watch-outs
- Watch-outs: built in 1928 — expect roof / HVAC / electrical / plumbing capex.
- Climate carrying-cost: major wind risk, 27% chance of damaging wind over 30y; extreme-heat days projected 7→15/yr by 2055 (HVAC capex compounding) — expect insurance premiums to compound above CPI over the hold.
Questions for the listing agent
- Built in 1928 — when were the roof, HVAC, electrical panel, plumbing, and water heater last replaced?
- Is there a deadline driving the sale (1031 exchange, divorce, estate, relocation)? That informs how much negotiation room exists.
- Schools are A-rated — typically a magnet for longer-tenancy family renters. What's the average tenant stay here, and is there a school-zone premium baked into asking?
- What's the average days-on-market for RENTAL listings here right now (not sales)? A rising rental-DOM trend means longer vacancies and softer asking-rent achievability than the comps imply.
- What's the recent tenant-quality profile in this submarket — average credit score on applications, eviction rate, late-payment / NSF rate, and stable-employment percentage? A property-management company in the area should have these aggregated.
- How much new for-sale + rental construction is in the pipeline within 1–3 miles? Heavy new supply typically softens prices + rents 12–24 months out; constrained supply supports both.
Investment metrics
- 1% rule
- 1.11% ✓
- Cap rate
- 8.01%
- Cash-on-cash
- 6.12%
- DSCR
- 1.27
- GRM
- 7.5
CMA / ARV
- ARV (on-the-fly)
- $361,620
- Comps found
- 12
Show comp detail 12 sales within ~0.75 mi
| Address | Dist | Beds/Ba | Sqft | Sold | Price | $/sf | Match |
|---|---|---|---|---|---|---|---|
| 15 Woodruff St | 0.00mi | 3/1.5 | 1,435 (0%) | 1mo | $225,000 | $157 | 98 |
| 180 Berlin Ave | 0.08mi | 3/1.5 | 1,292 (-10%) | 9mo | $325,000 | $252 | 70 |
| 44 Oakland Rd | 0.34mi | 3/2.0 | 1,396 (-3%) | 9mo | $355,000 | $254 | 69 |
| 100 Berlin St | 0.42mi | 4/1.5 (+1) | 1,386 (-3%) | 7mo | $357,000 | $258 | 62 |
| 90 Berlin St | 0.41mi | 4/2.0 (+1) | 1,450 (+1%) | 12mo | $345,000 | $238 | 60 |
| 65 Bristol St | 0.58mi | 3/1.5 | 1,394 (-3%) | 7mo | $374,900 | $269 | 60 |
| 278 Hobart St | 0.58mi | 3/1.5 | 1,308 (-9%) | 1mo | $386,000 | $295 | 56 |
| 131 Michael Dr | 0.40mi | 3/1.5 | 1,254 (-13%) | 7mo | $430,000 | $343 | 52 |
| 108 Hobart St | 0.46mi | 4/1.0 (+1) | 1,249 (-13%) | 5mo | $290,000 | $232 | 48 |
| 78 Homesdale Ave | 0.74mi | 4/2.0 (+1) | 1,476 (+3%) | 6mo | $339,000 | $230 | 47 |
| 216 Belleview Ave | 0.72mi | 2/1.0 (-1) | 1,520 (+6%) | 11mo | $325,000 | $214 | 43 |
| 141 Old Turnpike Rd | 0.73mi | 3/2.0 | 1,634 (+14%) | 4mo | $390,000 | $239 | 36 |
Match score weights: distance 35% · size 25% · config 20% · recency 20%. Top-matched comps best support the ARV.
Projected returns pro-forma
-3.0% appreciation · 3.0% rent growth · sell at horizon
- IRR
- -6.8%
- Equity multiple
- 0.75×
- Total profit
- $-14,783
- Equity at exit
- $31,163
- IRR
- 2.8%
- Equity multiple
- 1.20×
- Total profit
- $11,939
- Equity at exit
- $18,071
Cash invested: $58,520 (down + closing). Projections, not guarantees.
Landlord ↔ Tenant lean methodology
- Overall (STATE)
- 27 Tenant-Leaning
- State Connecticut
- 27 Tenant-Leaning · D+7
- County
- — inherits STATE
- City
- — inherits STATE
ZIP-level market 06489
- Active inventory
- 111
- Price-to-rent
- 7.5×
Monthly cashflow live
- Estimated rent
- $2,312 high interval (Pro) →
- Mortgage (P&I)
- −$1,096
- Tax from tax record
- −$345 /mo · $4,138/yr
- Insurance
- −$87
- HOA
- −$0
- Vacancy / Maint / Mgmt
- −$485
- Net cashflow
- $298
Break-even live
Sensitivity live
| Price | -10% $417 | -5% $357 | +0% $298 | +5% $239 | +10% $180 |
|---|---|---|---|---|---|
| Rent | -10% $116 | -5% $207 | +0% $298 | +5% $390 | +10% $481 |
| Rate | -1.0pp $404 | -0.5pp $351 | base $298 | +0.5pp $244 | +1.0pp $189 |
UW: 25.0% down · 7.5% · 30yr · 1.5% tax · 5.0% vac · 8.0% maint · 8.0% mgmt
Financing live
Cash to close
- Down payment
- $52,250
- Closing costs
- $6,270
- Reserves months
- —
- Total cash needed
- —
Loan-product check · same deal, 3 products live
Conventional
25% down · 7.5% · 30yr
- Down + closing
- —
- Monthly P&I
- —
- Monthly cashflow
- —
- DSCR
- —
- Eligible?
- —
Personal DTI + credit; lowest rate.
DSCR
20% down · 8.5% · 30yr
- Down + closing
- —
- Monthly P&I
- —
- Monthly cashflow
- —
- DSCR
- —
- Eligible?
- —
No personal income docs; deal must DSCR.
Hard money
10% down · 12.0% · 12mo
- Down + closing
- —
- Monthly P&I
- —
- Monthly cashflow
- —
- DSCR
- —
- Eligible?
- —
Short-term bridge; refi at stabilization.
Rent comps 6 comps
| Address | Beds | Baths | Sqft | Rent | $/sqft | DOM | Units | Dist |
|---|---|---|---|---|---|---|---|---|
| 53 Academy St Southington, CT | 3.0 | 1.0 | 1000 | $2,250 | $2.25 | 45d | 1 | 0.23mi |
| 151 W Center St Southington, CT | 2.0 | 1.0 | 1480 | $1,650 | $1.11 | 45d | 1 | 0.75mi |
| 40 Cornerstone Ct #26 Plantsville, CT | 2.0 | 1.5 | 1088 | $2,000 | $1.84 | 5d | 1 | 1.11mi |
| 8 Queen St Unit 8 D Southington, CT | 2.0 | 1.5 | 1380 | $1,750 | $1.27 | 25d | 1 | 1.16mi |
| 201 Partridge Dr Southington, CT | 3.0 | 2.5 | 1568 | $3,700 | $2.36 | 23d | 1 | 1.23mi |
| 519 W Center St Southington, CT | 3.0 | 1.0 | 1300 | $2,200 | $1.69 | 25d | 1 | 1.40mi |
Listing history 11 events
-
2026-03-16status Under Contract
-
2026-03-16status Active
-
2026-02-26status Under Contract
-
2026-02-24status Active
-
2026-02-23status Under Contract
-
2026-02-16$209,000 Active
-
2006-11-03historical
-
2006-05-04$275,000
-
2005-09-06soldstatus $224,000
-
2005-09-02soldstatus $224,000 214-char remark
Show marketing remark (214 chars)
Lovely well cared for colonial in move in condition. Special features include good size kitchen, handcrafted built-in book cases, red brick fpl, screened in porch off din/liv rm and more. Ask about buyer exclusion.
-
2005-06-14$223,000 214-char remark
Show marketing remark (214 chars)
Lovely well cared for colonial in move in condition. Special features include good size kitchen, handcrafted built-in book cases, red brick fpl, screened in porch off din/liv rm and more. Ask about buyer exclusion.
ⓘ Source: listings_history table (triggers on properties + properties_extension) + one-shot
backfill from property_details.listing_events for pre-trigger history.
Tax reassessment forecast CT · Partial reset (capped growth)
- Current annual tax
- $4,138 · $345/mo
- Projected year-2 tax
- $4,305 · $359/mo
- Expected delta
- +$167/yr (+$14/mo · 4.0%)
ⓘ Screening estimate from a state-policy table — verify with the county assessor before closing.
Climate risk First Street
- Flood 1/10 Low FEMA zone X (unshaded) · 0% chance over 30 yrs
- Wildfire 3/10 Moderate
- Heat 5/10 Major 7 d/yr ≥97°F today · 15 d/yr by 30 yrs out
- Wind 6/10 Major 27% chance of damaging wind over 30 yrs
- Air quality 3/10 Moderate 2 unhealthy d/yr today · 3 by 30 yrs out
Nearby sold comps map
Loading sold comps map…
Walkable amenities ~0.75 mi
Loading nearby amenities…
Taxation est. · year 1
- Rental income
- $27,740
- − Mortgage interest
- −$11,707
- − Property taxes
- −$4,138
- − Insurance
- −$1,045
- − Repairs & maintenance
- −$2,219
- − Management
- −$2,219
- − Depreciation
- −$6,080
- Taxable income
- $331
- Est. tax owed @ 24.0%
- −$80
- After-tax cash flow
- $3,500/yr
For passive investors: Depreciation is non-cash, so a rental often shows a tax loss while cash-flowing — sheltering income. Rental losses are passive: they offset passive income freely, and up to $25,000/yr can offset ordinary (W-2) income if you actively participate and your MAGI is under $100k (phasing out to $0 by $150k); unused losses carry forward. On sale, claimed depreciation is recaptured at up to 25%, and gains may owe capital-gains tax (a 1031 exchange can defer both). Figures are a year-1 estimate at your 24.0% rate — not tax advice; consult a CPA.
Schools (NCES district)
- District
- Southington School District
- NCES district ID
- 0904230
- Math proficiency
- 52% ▼ -9.00%
- Reading proficiency
- 64% ▼ -5.00%
- Median HH income
- $81,467
- Composite
- 52.38/100
- National rank
- #1581
- State rank
- #51 of 153 in CT
Livability — Plantsville
- Score
- 77/100
- State rank
- #46
- US rank
- #3164
Category grades
Schools grade is shown separately in the Schools card above.
Census & demographics
- County
- Hartford County · 754,208 people
- City population
- 61,684
- Metro
- Hartford-East Hartford-Middletown, CT
- Population (ZIP)
- 32,706
- Household income
- $126,465
- Rent vs Own
- Severe rent burden
- 513.0
Population outlook (Capitol County) Hauer SSP2
- By 2040
- 1,063,519
Race, ethnicity, and origin ACS 2023
- Neighborhood character
- Predominantly White (87%)
- Race & ethnicity
- White 87% Two or more races 6% Hispanic / Latino 5% Asian 2% Black 1%
- Hispanic origin (detail)
- Puerto Rican 3%
- Common ancestry
- Romanian 13% Lithuanian 7% Russian 2%
- Foreign-born
- 9% · Canada, China, Jamaica
- Languages at home
- 88% English-only · Other Indo-European 4% Spanish 3% Russian/Polish/Slavic 2%
Political lean MEDSL · Capitol
- 2024 margin
- Strong D (+21.9) · D 60.1% · R 38.2% · Other 1.7%
- All cycles
- 2024: D+21.9
Not yet ingested
- Civics
- —
Market trends
- HPI YoY
- ▼ -161.57%
- Current HPI
- 179.8884
- Rent YoY
- —
- Metro
- Hartford-East Hartford-Middletown, CT
- State GDP YoY
- ▲ 1.06%
- F500 in state
- 38
Industry mix (Fortune 500 HQ in CT)
| Industry | F500 HQs | Revenue |
|---|---|---|
| Industrial Machinery | 4 | $38B |
|
||
| Insurance | 3 | $71B |
|
||
| Financial Services | 2 | $25B |
|
||
| Transportation / Logistics | 2 | $18B |
|
||
| Healthcare | 1 | $247B |
|
||
| Telecommunications | 1 | $55B |
|
||
Price history
-6.3% since first listed11 events — show timeline
- 2026-03-16 Pending — Smart MLS
- 2026-03-16 Relisted — Smart MLS
- 2026-02-26 Pending — Smart MLS
- 2026-02-24 Relisted — Smart MLS
- 2026-02-23 Pending — Smart MLS
- 2026-02-16 Listed $209,000 Smart MLS
- 2006-11-03 Listing Removed — Smart MLS
- 2006-05-04 Listed $275,000 Smart MLS
- 2005-09-06 Sold (Public Records) $224,000 Public Records
- 2005-09-02 Sold (MLS) $224,000 Smart MLS
- 2005-06-14 Listed $223,000 Smart MLS
Property tax history
+1.6%/yrLatest (2025): $4,138 · +5.6% YoY. Source: county tax records.
Cash-flow waterfall
monthlySold comps — $/sqft
last 12 mo · ≤1 miLoading sold comps…