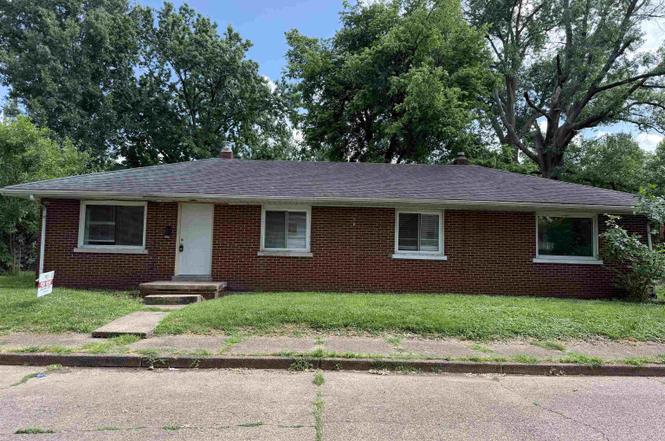
 Duplex
1500 S Harlan Ave · Evansville, IN
Flood risk 1/10 · Minimal
- FEMA flood zone
- X (shaded)
- Chance of flooding over 30 yrs
- 0.0%
- Est. flood insurance / yr
- $507 – $1,088
Fire risk 1/10 · Minimal
- Est. fire insurance / yr
- $717 – $1,331
Heat risk 5/10 · Moderate
- Hot days now (above 107°F)
- 7 days/yr
- Hot days in 30 yrs
- 19 days/yr
Wind risk 2/10 · Minimal
- Chance of severe wind over 30 yrs
- 3.0%
Air-quality risk 3/10 · Minor
- Unhealthy air days now
- 3 days/yr
- Unhealthy air days in 30 yrs
- 4 days/yr
Risk factors via First Street. Map © Google.
Why this score? — see what drove the C+ grade
The composite is a weighted blend of 9 inputs, each scored 0–100. Each bar is that input's sub-score; the figure is the points it added to the 100-point composite (weight × sub-score).
- Cash flow +26.7/30.0
- DSCR +9.1/10.0
- ARV discount +7.5/15.0
- 1% rule +6.6/10.0
- Rent growth +4.5/5.0
- Schools +3.3/10.0
- Livability +3.2/5.0
- Condition / age +2.5/5.0
- Appreciation +0.0/10.0
$150,000
🖨 Deal sheet 📄 Offer letter ✓ Due diligence
Multi-family units
County records classify this as Multi-Family (2-4 Unit). Listing-text estimate: 2 units. confirmed
Listing remarks
Investment opportunity! This duplex features two 2-bedroom, 1-bath units, offering strong income potential for investors or owner-occupants alike. Live in one unit and rent the other, or maximize cash flow by leasing both. Conveniently located and ready for its next owner, this property is a great addition to any real estate portfolio.
Key facts
- 6,534 sq ft lot
- Built 1935
- Listed 3 days
Property features AI
Finance
- Other: Pets allowed with breed restrictions
Exterior
- Utilities: Public water; Public sewer
- Home design: Duplex (residential income); Single-story
- Construction: Brick construction
- Exterior features: Level lot; Lot dimensions approximately 131 x 50
Interior
- Kitchen: Range; Refrigerator
- Flooring: Laminate
- Bathrooms: 2 full bathrooms; 4 main-level bathrooms
- Heating & cooling: Central air conditioning
- Interior features: Range; Refrigerator; Laminate flooring; Crawl space basement
- Laundry & utility: Washer hookup
Neighborhood map
What this means for you Summary
Snapshot
- This is a 2 × 2-bed/1.0-bath units multifamily listed at $150k.
Deal economics
- At list price, monthly cash flow is $404 ($5k/yr) — positive. Per door: $202/mo.
- The deal already cash-flows at list — no discount required.
- Meets the 1% rule at list price ($2k rent vs $150k).
- Cap rate 9.5% vs local median 4.6% in Evansville — top-decile yield for the area; either an underpriced asset or a hidden risk that comps aren't pricing in. Stress-test before assuming the spread holds.
Location & tenants
- Location reads 63/100 on livability (#416 in IN) — a middle-class / working-renter tenant base. Strengths: cost of living A+, housing A+, health & safety A+; Watch: crime F, commute F, employment D-.
- Evansville Vanderburgh School Corporation (urban): math 36% / reading 43% proficiency, ranked #153 of 301 in IN (top 51%) — families likely to look elsewhere, expect single-tenant / working-renter base with shorter leases.
- Zoned schools: Harper Elementary School (math 32% / reading 27%, grade F, #697 of 994 statewide, top 73%, 337 students, 74% FRL); Washington Middle School (math 14% / reading 24%, grade F, #274 of 330 statewide, top 83%, 353 students, 70% FRL) — zoned schools average 72% FRL vs 50% district-wide (22 pts higher); higher-poverty schools than district average — tighter screening recommended.
- Zoned-school proficiency averages 24% at this address vs 40% district-wide (-15 pts) — the specific schools serving this property underperform the Evansville Vanderburgh School Corporation average; the district grade overstates school quality for this exact location.
- Market conditions: Rents rising fast (+7.9%/yr); 188 active listings in the ZIP; 10 comparable units currently listed for rent nearby; rentals at typical pace (median 21d on market — plan ~3-4 weeks tenant-placement turnaround); 508 units permitted in Vanderburgh County in 2024 (32 in 5+ unit buildings).
- This rent runs 37% of the median local income ($56k/yr) — at the standard rent-burdened threshold; future hikes will face affordability resistance.
Forward outlook
- Local home prices are declining (-3.0%/yr); year-one equity from $1k of loan paydown is wiped out by about $4k of value loss. Plan a longer hold.
- At projected returns (-3.0% appreciation + 7.9% rent growth), your $42k cash investment doubles in ~7 years — after that, you're playing with house money.
Negotiation context
- Only 3 days on market — expect competitive offers; lowballing is unlikely to land.
- 3 sale attempts since 3y ago with the ask held roughly flat each time — persistent listings suggest the price (not the market) is what's stuck; bring a comps-based counter.
Risks & watch-outs
- Watch-outs: built in 1935 — expect roof / HVAC / electrical / plumbing capex.
- Climate carrying-cost: extreme-heat days projected 7→19/yr by 2055 (HVAC capex compounding) — expect insurance premiums to compound above CPI over the hold.
Questions for the listing agent
- Can we see the unit-by-unit rent roll, current vacancy, and any below-market leases? What's the average tenancy length?
- What capital expenditures (roof, boiler, parking lot, exteriors) have been made in the last 5 years, and what's planned in the next 2?
- Built in 1935 — when were the roof, HVAC, electrical panel, plumbing, and water heater last replaced?
- Is there a deadline driving the sale (1031 exchange, divorce, estate, relocation)? That informs how much negotiation room exists.
- Schools are D-rated, which usually means shorter tenancies and higher turnover. Who's the typical renter profile here, and what's been the actual vacancy rate?
- Crime grade is F in this area — have there been break-ins, vandalism, or insurance claims at this property in the last 3 years? What carrier currently insures it and at what premium?
- What's the average days-on-market for RENTAL listings here right now (not sales)? A rising rental-DOM trend means longer vacancies and softer asking-rent achievability than the comps imply.
- What's the recent tenant-quality profile in this submarket — average credit score on applications, eviction rate, late-payment / NSF rate, and stable-employment percentage? A property-management company in the area should have these aggregated.
- How much new apartment / multifamily construction is in the pipeline within 1–3 miles? Heavy new supply (>2% of stock underway) typically softens rents 12–24 months out; light construction supports rent growth.
Investment metrics
- 1% rule
- 1.16% ✓
- Cap rate
- 9.53%
- Cash-on-cash
- 11.55%
- DSCR
- 1.51
- GRM
- 7.2
CMA / ARV
- ARV (on-the-fly)
- $58,800
- Comps found
- 1
Show comp detail 1 sale within ~0.75 mi
| Address | Dist | Beds/Ba | Sqft | Sold | Price | $/sf | Match |
|---|---|---|---|---|---|---|---|
| 814 Taylor Ave | 0.54mi | 2/1.0 | 800 (+14%) | 12mo | $67,000 | $84 | 41 |
Match score weights: distance 35% · size 25% · config 20% · recency 20%. Top-matched comps best support the ARV.
Projected returns pro-forma
-3.0% appreciation · 7.86% rent growth · sell at horizon
- IRR
- 6.0%
- Equity multiple
- 1.25×
- Total profit
- $10,380
- Equity at exit
- $22,365
- IRR
- 19.3%
- Equity multiple
- 2.97×
- Total profit
- $82,783
- Equity at exit
- $12,969
Cash invested: $42,000 (down + closing). Projections, not guarantees.
Landlord ↔ Tenant lean methodology
- Overall (STATE)
- 90 Strongly Landlord-Friendly
- State Indiana
- 90 Strongly Landlord-Friendly · R+11
- County
- — inherits STATE
- City
- — inherits STATE
ZIP-level market 47714
- Rents YoY
- 7.9%
- Active inventory
- 188
- Price-to-rent
- 14.3×
Monthly cashflow live
- Estimated rent
- $1,746 medium interval (Pro) →
- Mortgage (P&I)
- −$787
- Tax from tax record
- −$126 /mo · $1,513/yr
- Insurance
- −$62
- HOA
- −$0
- Vacancy / Maint / Mgmt
- −$367
- Net cashflow
- $404
Break-even live
2-unit breakdown (identical units grouped — click to expand)
| Units | Beds | Baths | Est. rent |
|---|---|---|---|
| 2× units | 2 | 1 | $1,746 |
| #1 | 2 | 1 | $873 |
| #2 | 2 | 1 | $873 |
| Total (2 units) | $1,746 | ||
UW: 25.0% down · 7.5% · 30yr · 1.5% tax · 5.0% vac · 8.0% maint · 8.0% mgmt
Financing live
Cash to close
- Down payment
- $37,500
- Closing costs
- $4,500
- Reserves months
- —
- Total cash needed
- —
Loan-product check · same deal, 3 products live
Conventional
25% down · 7.5% · 30yr
- Down + closing
- —
- Monthly P&I
- —
- Monthly cashflow
- —
- DSCR
- —
- Eligible?
- —
Personal DTI + credit; lowest rate.
DSCR
20% down · 8.5% · 30yr
- Down + closing
- —
- Monthly P&I
- —
- Monthly cashflow
- —
- DSCR
- —
- Eligible?
- —
No personal income docs; deal must DSCR.
Hard money
10% down · 12.0% · 12mo
- Down + closing
- —
- Monthly P&I
- —
- Monthly cashflow
- —
- DSCR
- —
- Eligible?
- —
Short-term bridge; refi at stabilization.
Rent comps 10 comps
| Address | Beds | Baths | Sqft | Rent | $/sqft | DOM | Units | Dist |
|---|---|---|---|---|---|---|---|---|
| 1500 S Harlan Ave Evansville, IN | 2.0 | 1.0 | 712 | $900 | $1.26 | 13d | 1 | 0.02mi |
| 1909 Taylor Ave Evansville, IN | 2.0 | 1.0 | 700 | $1,200 | $1.71 | 13d | 1 | 0.62mi |
| 2340 Sunburst Blvd Unit 2210-104 Evansville, IN | 1.0 | 1.0 | 631 | $785 | $1.24 | 21d | 1 | 0.97mi |
| 1231 Culver Dr Unit C Evansville, IN | 1.0 | 1.0 | 575 | $625 | $1.09 | 21d | 1 | 1.14mi |
| 507 S Evans Ave Evansville, IN | 2.0 | 1.0 | 750 | $795 | $1.06 | 21d | 1 | 1.16mi |
| 1407 Howard St Evansville, IN | 1.0 | 1.0 | 483 | $725 | $1.50 | 21d | 1 | 1.23mi |
| 538 S Spring St Evansville, IN | 1.0 | 1.0 | 500 | $850 | $1.70 | 21d | 1 | 1.24mi |
| 8 E Blackford Ave Evansville, IN | 1.0 | 1.0 | 750 | $825 | $1.10 | 21d | 1 | 1.37mi |
| 1440 E Division St Evansville, IN | 2.0 | 1.0 | 689 | $1,250 | $1.81 | 13d | 1 | 1.43mi |
| 2501 Pollack Ave Evansville, IN | 2.0 | 1.0 | 648 | $1,080 | $1.67 | 21d | 1 | 1.44mi |
Listing history 4 events
-
2026-06-18days on market $150,000 Active 3 DOM
-
2026-06-17days on market $150,000 Active 2 DOM
-
2026-06-16remarks 337-char remark
-
2026-06-16$150,000 Active 1 DOM
ⓘ Source: listings_history table (triggers on properties + properties_extension) + one-shot
backfill from property_details.listing_events for pre-trigger history.
Tax reassessment forecast IN · Partial reset (capped growth)
- Current annual tax
- $1,513 · $126/mo
- Projected year-2 tax
- $1,513 · $126/mo
- Expected delta
- $0/yr ($0/mo · 0.0%)
ⓘ Screening estimate from a state-policy table — verify with the county assessor before closing.
Climate risk First Street
- Flood 1/10 Low FEMA zone X (shaded) · 0% chance over 30 yrs
- Wildfire 1/10 Low
- Heat 5/10 Major 7 d/yr ≥107°F today · 19 d/yr by 30 yrs out
- Wind 2/10 Low 3% chance of damaging wind over 30 yrs
- Air quality 3/10 Moderate 3 unhealthy d/yr today · 4 by 30 yrs out
Nearby sold comps map
Loading sold comps map…
Walkable amenities ~0.75 mi
Loading nearby amenities…
Taxation est. · year 1
- Rental income
- $20,952
- − Mortgage interest
- −$8,402
- − Property taxes
- −$1,513
- − Insurance
- −$750
- − Repairs & maintenance
- −$1,676
- − Management
- −$1,676
- − Depreciation
- −$4,364
- Taxable income
- $2,571
- Est. tax owed @ 24.0%
- −$617
- After-tax cash flow
- $4,233/yr
For passive investors: Depreciation is non-cash, so a rental often shows a tax loss while cash-flowing — sheltering income. Rental losses are passive: they offset passive income freely, and up to $25,000/yr can offset ordinary (W-2) income if you actively participate and your MAGI is under $100k (phasing out to $0 by $150k); unused losses carry forward. On sale, claimed depreciation is recaptured at up to 25%, and gains may owe capital-gains tax (a 1031 exchange can defer both). Figures are a year-1 estimate at your 24.0% rate — not tax advice; consult a CPA.
Schools (NCES district)
- District
- Evansville Vanderburgh School Corporation
- NCES district ID
- 1803450
- Math proficiency
- 36% ▼ -7.00%
- Reading proficiency
- 43% ▼ -3.00%
- Median HH income
- $43,270
- Composite
- 33.41/100
- National rank
- #5471
- State rank
- #153 of 301 in IN
Livability — Evansville
- Score
- 63/100
- State rank
- #416
- US rank
- #15047
Category grades
Schools grade is shown separately in the Schools card above.
Census & demographics
- Census place
- Evansville, IN
- County
- Vanderburgh County · 146,793 people
- City population
- 146,793
- Metro
- Evansville, IN-KY
- Population (ZIP)
- 32,132
- Household income
- $55,910
- Rent vs Own
- Severe rent burden
- 1394.0
Population outlook (Vanderburgh County) Hauer SSP2
- Today (2025)
- 187,038 people
- By 2030
- 188,907 · +1.0%
- By 2040
- 190,272 · +1.7%
- By 2050
- 188,871 · +1.0%
- By 2075
- 180,751 · -3.4%
- By 2100
- 163,015 · -12.8%
Race, ethnicity, and origin ACS 2023
- Neighborhood character
- Predominantly White (71%)
- Race & ethnicity
- White 71% Black 17% Two or more races 6% Hispanic / Latino 6% Asian 1%
- Hispanic origin (detail)
- Mexican 3%
- Common ancestry
- Italian 3% Lithuanian 2% Slovak 1%
- Foreign-born
- 6% · Canada, China
- Languages at home
- 92% English-only · Spanish 4% Other Asian/Pacific 1% French/Haitian/Cajun 1%
Political lean MEDSL · Vanderburgh
- 2024 margin
- R (+12.7) · D 43.0% · R 55.6% · Other 1.4%
- 2008→2024 swing
- -15.1pp toward R · 2008: 2.5pp · 2024: -12.7pp
- All cycles
- 2024: R+12.7 2020: R+9.6 2016: R+16.9 2012: R+10.8 2008: D+2.5
Not yet ingested
- Civics
- —
Market trends
- HPI YoY
- ▼ -124.80%
- Current HPI
- 211.1755
- Rent YoY
- ▲ 7.86%
- Metro
- Evansville, IN-KY
- State GDP YoY
- ▲ 2.90%
- F500 in state
- 18
Industry mix (Fortune 500 HQ in IN)
| Industry | F500 HQs | Revenue |
|---|---|---|
| Industrial Machinery | 2 | $37B |
|
||
| Healthcare | 1 | $177B |
|
||
| Pharmaceuticals | 1 | $45B |
|
||
| Metals / Steel | 1 | $18B |
|
||
| Agriculture | 1 | $17B |
|
||
| Packaging | 1 | $12B |
|
||
Price history
4 events — show timeline
- 2026-06-15 Listed $150,000 IRMLS
- 2026-06-06 Listed for Rent $900 SHOWMOJO
- 2024-02-05 Rental Removed $725 APPFOLIO
- 2023-11-29 Listed for Rent $725 APPFOLIO
Property tax history
+1.0%/yrLatest (2024): $1,513 · +57.6% YoY. Source: county tax records.
Cash-flow waterfall
monthlySold comps — $/sqft
last 12 mo · ≤1 miLoading sold comps…