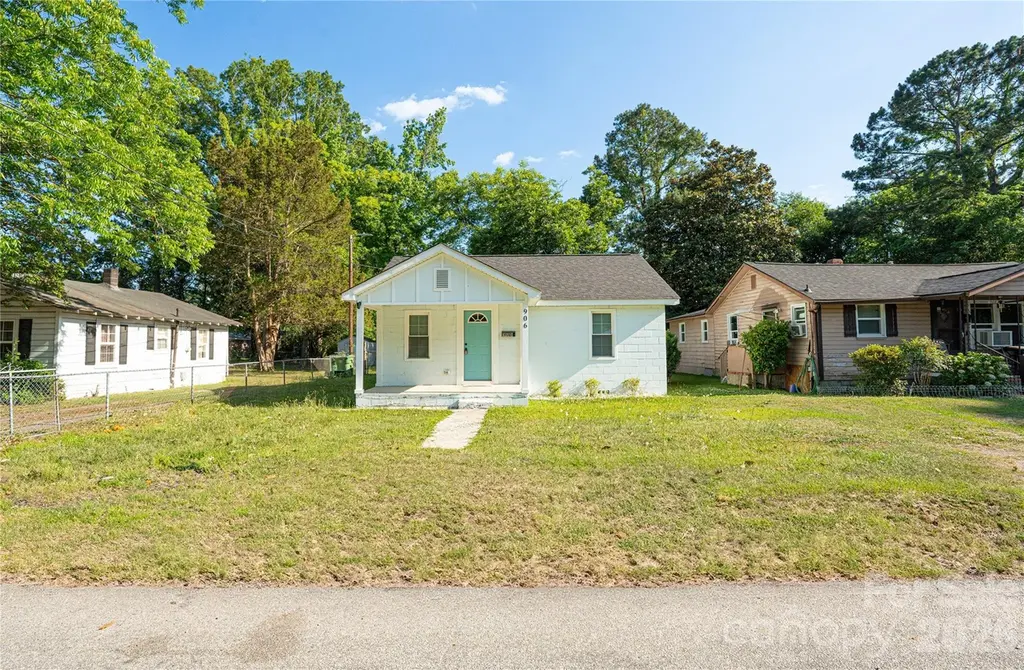
906 Gladstone St · Florence, SC
Flood risk 1/10 · Minimal
- FEMA flood zone
- X (unshaded)
- Chance of flooding over 30 yrs
- 0.0%
- Est. flood insurance / yr
- $507 – $1,088
Fire risk 4/10 · Minor
- Est. fire insurance / yr
- $783 – $1,453
Heat risk 7/10 · Major
- Hot days now (above 107°F)
- 7 days/yr
- Hot days in 30 yrs
- 15 days/yr
Wind risk 8/10 · Major
- Chance of severe wind over 30 yrs
- 80.0%
Air-quality risk 1/10 · Minimal
- Unhealthy air days now
- 0 days/yr
- Unhealthy air days in 30 yrs
- 0 days/yr
Risk factors via First Street. Map © Google.
Why this score? — see what drove the C- grade
The composite is a weighted blend of 9 inputs, each scored 0–100. Each bar is that input's sub-score; the figure is the points it added to the 100-point composite (weight × sub-score).
- Cash flow +20.5/30.0
- ARV discount +7.5/15.0
- DSCR +6.5/10.0
- 1% rule +4.7/10.0
- Rent growth +3.7/5.0
- Schools +3.2/10.0
- Livability +3.1/5.0
- Condition / age +2.5/5.0
- Appreciation +0.0/10.0
$129,000
🖨 Deal sheet 📄 Offer letter ✓ Due diligence
Listing remarks
Charming 2-bedroom, 1 full bath home situated on a 0.16-acre lot in Florence offering convenience and potential. This 896 sqft property features a functional layout and is located just minutes from downtown Florence, shopping, dining, and everyday essentials. Convenient access to local parks, schools, and major roadways makes commuting simple while still enjoying nearby entertainment and recreation. Schedule your showing today!
Key facts
- Access to schools
- 0.16-acre lot
- 6,969 sq ft lot
Tags
Property features AI
Finance
- Other: Zoning: RI
- HOA & community: No HOA
Exterior
- Parking: Driveway
- Utilities: City water; Public sewer
- Home design: Single-family residence; One story; Site-built
- Construction: Brick exterior; Crawl space foundation; Completed development
- Exterior features: Dirt and paved road access; Publicly maintained road
Interior
- Kitchen: Electric range; Exhaust hood; Microwave; Dishwasher; Refrigerator; Garbage disposal
- Bedrooms: 2 bedrooms on the main level
- Bathrooms: 1 full bathroom on the main level
- Heating & cooling: Forced air heating; Central air conditioning
- Interior features: Open floor plan (1 total room listed); Dishwasher, Disposal, Electric Range, Exhaust Hood, Microwave, Refrigerator
- Laundry & utility: Indoor laundry
Neighborhood map
What this means for you Summary
Snapshot
- This is a 2-bed/1.0-bath single-family listed at $129k.
Deal economics
- At list price, monthly cash flow is $169 ($2k/yr) — positive.
- The deal already cash-flows at list — no discount required.
- To meet the 1% rule (rent ≥ 1% of price), the offer needs to be $125k (3.2% below list).
- Recommended offer: $125k (3.2% below list) — sets the bar for 1% rule.
- Cap rate 7.9% vs local median 3.5% in Florence — top-decile yield for the area; either an underpriced asset or a hidden risk that comps aren't pricing in. Stress-test before assuming the spread holds.
Location & tenants
- Location reads 62/100 on livability (#196 in SC) — a middle-class / working-renter tenant base. Strengths: cost of living A+, housing A+, health & safety B+; Watch: employment C-, crime F, amenities F.
- Florence 01 (urban): math 29% / reading 47% proficiency, ranked #34 of 80 in SC (top 42%) — families likely to look elsewhere, expect single-tenant / working-renter base with shorter leases.
- Market conditions: Rents rising fast (+4.7%/yr); 328 active listings in the ZIP; 657 units permitted in Florence County in 2024 (40 in 5+ unit buildings).
Forward outlook
- Local home prices are declining (-3.0%/yr); year-one equity from $892 of loan paydown is wiped out by about $4k of value loss. Plan a longer hold.
Negotiation context
- It's been on market 23 days — a 2% lower offer ($127k) is reasonable based on typical stale-listing flexibility.
- 6 sale attempts since 3y ago with the ask held roughly flat each time — persistent listings suggest the price (not the market) is what's stuck; bring a comps-based counter.
- Current owner paid $11k; list at $129k implies a 1073% gain — meaningful room to come down on a strong offer.
Risks & watch-outs
- Watch-outs: built in 1955 — expect roof / HVAC / electrical / plumbing capex.
- Climate carrying-cost: severe wind risk, 80% chance of damaging wind over 30y; extreme-heat days projected 7→15/yr by 2055 (HVAC capex compounding) — expect insurance premiums to compound above CPI over the hold.
Questions for the listing agent
- Built in 1955 — when were the roof, HVAC, electrical panel, plumbing, and water heater last replaced?
- Is there a deadline driving the sale (1031 exchange, divorce, estate, relocation)? That informs how much negotiation room exists.
- Crime grade is F in this area — have there been break-ins, vandalism, or insurance claims at this property in the last 3 years? What carrier currently insures it and at what premium?
- What's the average days-on-market for RENTAL listings here right now (not sales)? A rising rental-DOM trend means longer vacancies and softer asking-rent achievability than the comps imply.
- What's the recent tenant-quality profile in this submarket — average credit score on applications, eviction rate, late-payment / NSF rate, and stable-employment percentage? A property-management company in the area should have these aggregated.
- How much new for-sale + rental construction is in the pipeline within 1–3 miles? Heavy new supply typically softens prices + rents 12–24 months out; constrained supply supports both.
Investment metrics
- 1% rule
- 0.97% ✗
- Cap rate
- 7.87%
- Cash-on-cash
- 5.63%
- DSCR
- 1.25
- GRM
- 8.6
CMA / ARV
- ARV (on-the-fly)
- $52,864
- Comps found
- 7
Show comp detail 7 sales within ~0.75 mi
| Address | Dist | Beds/Ba | Sqft | Sold | Price | $/sf | Match |
|---|---|---|---|---|---|---|---|
| 921 Ingram St | 0.26mi | 2/1.0 | 945 (+6%) | 23mo | $50,000 | $53 | 60 |
| 515 W Pennsylvania St | 0.46mi | 2/1.0 | 1,023 (+14%) | 1mo | $55,000 | $54 | 54 |
| 506 Sanborn St | 0.46mi | 3/2.0 (+1) | 950 (+6%) | 13mo | $115,000 | $121 | 49 |
| 517 N Mcqueen St | 0.53mi | 2/1.0 | 832 (-7%) | 22mo | $85,000 | $102 | 45 |
| 715 N Mcqueen St | 0.58mi | 3/1.0 (+1) | 996 (+11%) | 6mo | $54,000 | $54 | 44 |
| 320 N Schofield St | 0.55mi | 3/1.0 (+1) | 1,000 (+12%) | 8mo | $165,000 | $165 | 43 |
| 311 W Sumter St | 0.59mi | 3/1.0 (+1) | 829 (-8%) | 24mo | $48,750 | $59 | 35 |
Match score weights: distance 35% · size 25% · config 20% · recency 20%. Top-matched comps best support the ARV.
Projected returns pro-forma
-3.0% appreciation · 4.7% rent growth · sell at horizon
- IRR
- -5.8%
- Equity multiple
- 0.78×
- Total profit
- $-7,968
- Equity at exit
- $19,234
- IRR
- 5.6%
- Equity multiple
- 1.44×
- Total profit
- $16,073
- Equity at exit
- $11,154
Cash invested: $36,120 (down + closing). Projections, not guarantees.
Landlord ↔ Tenant lean methodology
- Overall (STATE)
- 90 Strongly Landlord-Friendly
- State South Carolina
- 90 Strongly Landlord-Friendly · R+6
- County
- — inherits STATE
- City
- — inherits STATE
ZIP-level market 29501
- Rents YoY
- 4.7%
- Active inventory
- 328
- Price-to-rent
- 8.6×
Monthly cashflow live
- Estimated rent
- $1,248 medium interval (Pro) →
- Mortgage (P&I)
- −$676
- Tax from tax record
- −$87 /mo · $1,039/yr
- Insurance
- −$54
- HOA
- −$0
- Vacancy / Maint / Mgmt
- −$262
- Net cashflow
- $169
Break-even live
UW: 25.0% down · 7.5% · 30yr · 1.5% tax · 5.0% vac · 8.0% maint · 8.0% mgmt
Financing live
Cash to close
- Down payment
- $32,250
- Closing costs
- $3,870
- Reserves months
- —
- Total cash needed
- —
Loan-product check · same deal, 3 products live
Conventional
25% down · 7.5% · 30yr
- Down + closing
- —
- Monthly P&I
- —
- Monthly cashflow
- —
- DSCR
- —
- Eligible?
- —
Personal DTI + credit; lowest rate.
DSCR
20% down · 8.5% · 30yr
- Down + closing
- —
- Monthly P&I
- —
- Monthly cashflow
- —
- DSCR
- —
- Eligible?
- —
No personal income docs; deal must DSCR.
Hard money
10% down · 12.0% · 12mo
- Down + closing
- —
- Monthly P&I
- —
- Monthly cashflow
- —
- DSCR
- —
- Eligible?
- —
Short-term bridge; refi at stabilization.
Listing history 28 events
-
2026-06-19days on market $129,000 Active 23 DOM
-
2026-06-18days on market $129,000 Active 22 DOM
-
2026-06-17days on market $129,000 Active 21 DOM
-
2026-06-16days on market $129,000 Active 20 DOM
-
2026-06-15days on market $129,000 Active 19 DOM
-
2026-06-14days on market $129,000 Active 17 DOM
-
2026-06-13days on market $129,000 Active 16 DOM
-
2026-06-10days on market $129,000 Active 14 DOM
-
2026-06-09days on market $129,000 Active 13 DOM
-
2026-06-08days on market $129,000 Active 12 DOM
-
2026-06-07days on market $129,000 Active 11 DOM
-
2026-06-05days on market $129,000 Active 8 DOM
-
2026-06-02days on market $129,000 Active 6 DOM
-
2026-06-01days on market $129,000 Active 5 DOM
-
2026-05-31days on market $129,000 Active 4 DOM
-
2026-05-30days on market $129,000 Active 3 DOM
-
2026-05-27$129,000 Active
-
2025-09-23price $139,000
-
2025-07-09price $143,000
-
2025-06-05$149,900 Active
-
2024-08-21status Pending
-
2024-08-10historical Active Under Contract
-
2024-07-10$144,900 Active
-
2024-07-10$144,900 Active
-
2023-11-27soldstatus Closed
-
2023-07-14$20,000
-
2023-01-27$30,000
-
2000-08-31soldstatus $11,000
ⓘ Source: listings_history table (triggers on properties + properties_extension) + one-shot
backfill from property_details.listing_events for pre-trigger history.
Tax reassessment forecast SC · Resets to sale price
- Current annual tax
- $1,039 · $87/mo
- Projected year-2 tax
- $1,039 · $87/mo
- Expected delta
- $0/yr ($0/mo · 0.0%)
ⓘ Screening estimate from a state-policy table — verify with the county assessor before closing.
Climate risk First Street
- Flood 1/10 Low FEMA zone X (unshaded) · 0% chance over 30 yrs
- Wildfire 4/10 Moderate
- Heat 7/10 Severe 7 d/yr ≥107°F today · 15 d/yr by 30 yrs out
- Wind 8/10 Severe 80% chance of damaging wind over 30 yrs
- Air quality 1/10 Low 0 unhealthy d/yr today · 0 by 30 yrs out
Nearby sold comps map
Loading sold comps map…
Walkable amenities ~0.75 mi
Loading nearby amenities…
Taxation est. · year 1
- Rental income
- $14,981
- − Mortgage interest
- −$7,226
- − Property taxes
- −$1,039
- − Insurance
- −$645
- − Repairs & maintenance
- −$1,198
- − Management
- −$1,198
- − Depreciation
- −$3,753
- Taxable loss
- −$79
- Est. tax savings @ 24.0%
- +$19
- After-tax cash flow
- $2,052/yr
For passive investors: Depreciation is non-cash, so a rental often shows a tax loss while cash-flowing — sheltering income. Rental losses are passive: they offset passive income freely, and up to $25,000/yr can offset ordinary (W-2) income if you actively participate and your MAGI is under $100k (phasing out to $0 by $150k); unused losses carry forward. On sale, claimed depreciation is recaptured at up to 25%, and gains may owe capital-gains tax (a 1031 exchange can defer both). Figures are a year-1 estimate at your 24.0% rate — not tax advice; consult a CPA.
Schools (NCES district)
- District
- Florence 01
- NCES district ID
- 4502130
- Math proficiency
- 29% ▼ -10.00%
- Reading proficiency
- 47% ▬ 0.00%
- Median HH income
- $45,782
- Composite
- 32.36/100
- National rank
- #5737
- State rank
- #34 of 80 in SC
Livability — Florence
- Score
- 62/100
- State rank
- #196
- US rank
- #17076
Category grades
Schools grade is shown separately in the Schools card above.
Census & demographics
- Census place
- Florence, SC
- County
- Florence County · 93,345 people
- City population
- 93,345
- Metro
- Florence, SC
- Population (ZIP)
- 48,673
- Household income
- $71,671
- Rent vs Own
- Severe rent burden
- 1792.0
Population outlook (Florence County) Hauer SSP2
- Today (2025)
- 141,714 people
- By 2030
- 142,121 · +0.3%
- By 2040
- 141,344 · -0.3%
- By 2050
- 139,478 · -1.6%
- By 2075
- 132,275 · -6.7%
- By 2100
- 118,374 · -16.5%
Race, ethnicity, and origin ACS 2023
- Neighborhood character
- Diverse neighborhood (Simpson 0.56)
- Race & ethnicity
- White 56% Black 35% Asian 3% Hispanic / Latino 3% Two or more races 3%
- Common ancestry
- Serbian 2% Slovak 2% Lithuanian 1%
- Foreign-born
- 4% · Canada, China
- Languages at home
- 93% English-only · Spanish 3% Other Indo-European 1% Russian/Polish/Slavic 1%
Political lean MEDSL · Florence
- 2024 margin
- Lean R (+8.0) · D 45.3% · R 53.3% · Other 1.3%
- 2008→2024 swing
- -4.8pp toward R · 2008: -3.2pp · 2024: -8.0pp
- All cycles
- 2024: R+8.0 2020: R+2.3 2016: R+5.0 2012: R+0.5 2008: R+3.2
Not yet ingested
- Civics
- —
Market trends
- HPI YoY
- ▼ -181.85%
- Current HPI
- 171.4154
- Rent YoY
- ▲ 4.70%
- Metro
- Florence, SC
- State GDP YoY
- ▲ 4.51%
- F500 in state
- 2
Industry mix (Fortune 500 HQ in SC)
| Industry | F500 HQs | Revenue |
|---|---|---|
| Packaging | 1 | $7B |
|
||
Price history
+1072.7% since first listed12 events — show timeline
- 2026-05-27 Listed $129,000 CANOPYMLS as Distributed by MLS Grid
- 2025-09-23 Price Changed $139,000 RAGPD
- 2025-07-09 Price Changed $143,000 RAGPD
- 2025-06-05 Listed $149,900 RAGPD
- 2024-08-21 Pending — Consolidated MLS
- 2024-08-10 Contingent — RAGPD
- 2024-07-10 Listed $144,900 RAGPD
- 2024-07-10 Listed $144,900 Consolidated MLS
- 2023-11-27 Sold (MLS) — RAGPD
- 2023-07-14 Listed $20,000 RAGPD
- 2023-01-27 Listed $30,000 RAGPD
- 2000-08-31 Sold (Public Records) $11,000 Public Records
Property tax history
+15.8%/yrLatest (2025): $1,039 · +6.5% YoY. Source: county tax records.
Cash-flow waterfall
monthlySold comps — $/sqft
last 12 mo · ≤1 miLoading sold comps…