 🏗️ New Construction
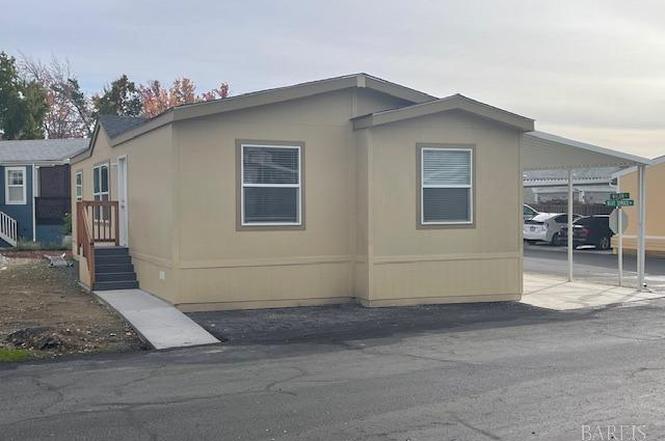
8182 Willow St · Windsor, CA
Flood risk 1/10 · Minimal
- FEMA flood zone
- X (unshaded)
- Chance of flooding over 30 yrs
- 0.0%
- Est. flood insurance / yr
- $507 – $1,088
Fire risk 5/10 · Moderate
- Est. fire insurance / yr
- $659 – $1,223
Heat risk 4/10 · Minor
- Hot days now (above 92°F)
- 7 days/yr
- Hot days in 30 yrs
- 16 days/yr
Wind risk 1/10 · Minimal
- Chance of severe wind over 30 yrs
- —
Air-quality risk 9/10 · Severe
- Unhealthy air days now
- 18 days/yr
- Unhealthy air days in 30 yrs
- 20 days/yr
Risk factors via First Street. Map © Google.
Why this score? — see what drove the B- grade
The composite is a weighted blend of 9 inputs, each scored 0–100. Each bar is that input's sub-score; the figure is the points it added to the 100-point composite (weight × sub-score).
- Cash flow +30.0/30.0
- 1% rule +10.0/10.0
- DSCR +10.0/10.0
- ARV discount +7.5/15.0
- Livability +3.6/5.0
- Rent growth +2.5/5.0
- Schools +2.5/10.0
- Condition / age +2.5/5.0
- Appreciation +0.0/10.0
$285,500
🖨 Deal sheet (PDF) 📄 Offer letter ✓ Due diligence
Listing remarks
Beautiful new 3 bedroom 2 bath Champion/Redman Manufactured Home with new stainless steel appliances and factory warranty. New large driveway with carport. Laundry hookups in utility room. Large lot can enable Buyer to build large deck on front door side of home. Buyer required to apply and be approved for tenancy at Windsor Mobile Country Club, the best 55+ community in Sonoma County.
Key facts
- 8.3 acre lot
- 2 parking spots
- Built 2023
Neighborhood map
What this means for you Summary
Snapshot
- This is a 3-bed/2.0-bath manufactured listed at $286k.
Deal economics
- At list price, monthly cash flow is $1k ($18k/yr) — positive.
- The deal already cash-flows at list — no discount required.
- Meets the 1% rule at list price ($3k rent vs $286k).
- Cap rate 17.7% vs local median 3.0% in Windsor — top-decile yield for the area; either an underpriced asset or a hidden risk that comps aren't pricing in. Stress-test before assuming the spread holds.
Location & tenants
- Location reads 71/100 on livability (#210 in CA) — a middle-class / working-renter tenant base. Strengths: employment A+, housing A+, health & safety A+; Watch: schools C-, amenities F, commute F.
- Windsor Unified (suburban): math 25% / reading 25% proficiency, ranked #362 of 517 in CA (top 70%) — low school quality limits family demand, transient renter base, plan for 1-2y turnover.
- Market conditions: 107 active listings in the ZIP; 9 comparable units currently listed for rent nearby; rentals at typical pace (median 22d on market — plan ~3-4 weeks tenant-placement turnaround); 44% of comp listings sitting > 30 days — soft ceiling on asking rent; high-income renter base; 1,039 units permitted in Sonoma County in 2024 (185 in 5+ unit buildings).
Forward outlook
- Local home prices are declining (-3.0%/yr); year-one equity from $1k of loan paydown is wiped out by about $5k of value loss. Plan a longer hold.
- Sonoma County population projected at +8% by 2050 — modest demand growth; plan on rents tracking national, not racing it.
- At projected returns (-3.0% appreciation + 3.0% rent growth), your $44k cash investment doubles in ~3 years — after that, you're playing with house money.
Negotiation context
- Only 14 days on market — expect competitive offers; lowballing is unlikely to land.
Risks & watch-outs
- Climate carrying-cost: moderate wildfire risk — expect insurance premiums to compound above CPI over the hold.
Questions for the listing agent
- Is there a deadline driving the sale (1031 exchange, divorce, estate, relocation)? That informs how much negotiation room exists.
- What's the average days-on-market for RENTAL listings here right now (not sales)? A rising rental-DOM trend means longer vacancies and softer asking-rent achievability than the comps imply.
- What's the recent tenant-quality profile in this submarket — average credit score on applications, eviction rate, late-payment / NSF rate, and stable-employment percentage? A property-management company in the area should have these aggregated.
- How much new for-sale + rental construction is in the pipeline within 1–3 miles? Heavy new supply typically softens prices + rents 12–24 months out; constrained supply supports both.
Investment metrics
- 1% rule
- 2.07% ✓
- Cap rate
- 17.66%
- Cash-on-cash
- 40.59%
- DSCR
- 2.81
- GRM
- 4.0
CMA / ARV
- ARV (on-the-fly)
- $155,774
- Comps found
- 11
Show comp detail 11 sales within ~0.75 mi
| Address | Dist | Beds/Ba | Sqft | Sold | Price | $/sf | Match |
|---|---|---|---|---|---|---|---|
| 8155 Willow St | 0.13mi | 2/2.0 (-1) | 1,120 (+2%) | 5mo | $145,000 | $129 | 81 |
| 8167 Willow St | 0.07mi | 2/2.0 (-1) | 1,100 (+0%) | 13mo | $155,000 | $141 | 80 |
| 8109 B St | 0.22mi | 2/2.0 (-1) | 1,152 (+5%) | 3mo | $199,000 | $173 | 74 |
| 1036 Maple Dr | 0.27mi | 2/1.5 (-1) | 1,056 (-4%) | 3mo | $150,000 | $142 | 71 |
| 8133 C St | 0.23mi | 2/2.0 (-1) | 1,040 (-5%) | 12mo | $195,000 | $188 | 66 |
| 8095 A St | 0.23mi | 3/2.0 | 1,133 (+3%) | 24mo | $195,000 | $172 | 64 |
| 708 Sequoia Dr | 0.18mi | 2/2.0 (-1) | 1,152 (+5%) | 20mo | $155,000 | $135 | 61 |
| 8132 Willow St | 0.19mi | 2/2.0 (-1) | 1,040 (-5%) | 22mo | $135,000 | $130 | 59 |
| 8114 B St | 0.22mi | 2/2.0 (-1) | 1,000 (-9%) | 16mo | $261,500 | $262 | 57 |
| 703 Sequoia | 0.22mi | 2/2.0 (-1) | 1,248 (+14%) | 18mo | $172,000 | $138 | 47 |
| 1002 Maple Dr | 0.30mi | 2/2.0 (-1) | 1,200 (+9%) | 23mo | $175,000 | $146 | 46 |
Match score weights: distance 35% · size 25% · config 20% · recency 20%. Top-matched comps best support the ARV.
Projected returns pro-forma
-3.0% appreciation · 3.0% rent growth · sell at horizon
- IRR
- 37.1%
- Equity multiple
- 2.58×
- Total profit
- $68,767
- Equity at exit
- $23,226
- IRR
- 43.7%
- Equity multiple
- 5.15×
- Total profit
- $181,068
- Equity at exit
- $13,468
Cash invested: $43,617 (down + closing). Projections, not guarantees.
Landlord ↔ Tenant lean methodology
- Overall (STATE)
- 18 Strongly Tenant-Friendly
- State California
- 18 Strongly Tenant-Friendly · D+13
- County
- — inherits STATE
- City
- — inherits STATE
ZIP-level market 95492
- Active inventory
- 107
- Price-to-rent
- 7.4×
Monthly cashflow live
- Estimated rent
- $3,230 high interval (Pro) →
- Mortgage (P&I)
- −$817
- Tax est. 1.5%
- −$195 /mo · $2,337/yr
- Insurance
- −$65
- HOA
- −$0
- Vacancy / Maint / Mgmt
- −$678
- Net cashflow
- $1,475
Break-even live
Sensitivity live
| Price | -10% $1,583 | -5% $1,529 | +0% $1,475 | +5% $1,421 | +10% $1,368 |
|---|---|---|---|---|---|
| Rent | -10% $1,220 | -5% $1,348 | +0% $1,475 | +5% $1,603 | +10% $1,730 |
| Rate | -1.0pp $1,554 | -0.5pp $1,515 | base $1,475 | +0.5pp $1,435 | +1.0pp $1,394 |
UW: 25.0% down · 7.5% · 30yr · 1.5% tax · 5.0% vac · 8.0% maint · 8.0% mgmt
Financing live
Cash to close
- Down payment
- $38,944
- Closing costs
- $4,673
- Reserves months
- —
- Total cash needed
- —
Loan-product check · same deal, 3 products live
Conventional
25% down · 7.5% · 30yr
- Down + closing
- —
- Monthly P&I
- —
- Monthly cashflow
- —
- DSCR
- —
- Eligible?
- —
Personal DTI + credit; lowest rate.
DSCR
20% down · 8.5% · 30yr
- Down + closing
- —
- Monthly P&I
- —
- Monthly cashflow
- —
- DSCR
- —
- Eligible?
- —
No personal income docs; deal must DSCR.
Hard money
10% down · 12.0% · 12mo
- Down + closing
- —
- Monthly P&I
- —
- Monthly cashflow
- —
- DSCR
- —
- Eligible?
- —
Short-term bridge; refi at stabilization.
Rent comps 9 comps
| Address | Beds | Baths | Sqft | Rent | $/sqft | DOM | Units | Dist |
|---|---|---|---|---|---|---|---|---|
| 208 Courtyards E Windsor, CA | 2.0 | 2.0 | 980 | $2,300 | $2.35 | 14d | 1 | 0.09mi |
| 172 Courtyards E Windsor, CA | 2.0 | 2.0 | 980 | $2,650 | $2.70 | 14d | 1 | 0.12mi |
| 10 3rd St Unit 10 Windsor, CA | 2.0 | 1.5 | 1000 | $2,395 | $2.40 | 44d | 1 | 0.28mi |
| 776 McClelland Dr Windsor, CA | 2.0 | 2.5 | 1344 | $2,900 | $2.16 | 44d | 1 | 0.62mi |
| 7924 Ferrari Way Windsor, CA | 3.0 | 2.0 | 1476 | $3,400 | $2.30 | 44d | 1 | 0.70mi |
| 9631 Old Redwood Hwy Unit 9631 Windsor, CA | 2.0 | 1.0 | 1047 | $2,375 | $2.27 | 22d | 1 | 1.05mi |
| 1011 Ventana Dr Windsor, CA | 3.0 | 2.0 | 1100 | $3,400 | $3.09 | 44d | 1 | 1.11mi |
| 1145 Shiloh Rd Windsor, CA | 3.0 | 1.0–2.0 | 776 | $4,395 | $5.66 | 8d | 14 | 1.14mi |
| 339 Pollard Way Windsor, CA | 3.0 | 2.0 | 1158 | $4,500 | $3.89 | 14d | 1 | 1.41mi |
Climate risk First Street
- Flood 1/10 Low FEMA zone X (unshaded) · 0% chance over 30 yrs
- Wildfire 5/10 Major
- Heat 4/10 Moderate 7 d/yr ≥92°F today · 16 d/yr by 30 yrs out
- Wind 1/10 Low
- Air quality 9/10 Extreme 18 unhealthy d/yr today · 20 by 30 yrs out
Nearby sold comps map
Loading sold comps map…
Walkable amenities ~0.75 mi
Loading nearby amenities…
Taxation est. · year 1
- Rental income
- $38,761
- − Mortgage interest
- −$8,726
- − Property taxes
- −$2,337
- − Insurance
- −$779
- − Repairs & maintenance
- −$3,101
- − Management
- −$3,101
- − Depreciation
- −$4,532
- Taxable income
- $16,187
- Est. tax owed @ 24.0%
- −$3,885
- After-tax cash flow
- $13,818/yr
For passive investors: Depreciation is non-cash, so a rental often shows a tax loss while cash-flowing — sheltering income. Rental losses are passive: they offset passive income freely, and up to $25,000/yr can offset ordinary (W-2) income if you actively participate and your MAGI is under $100k (phasing out to $0 by $150k); unused losses carry forward. On sale, claimed depreciation is recaptured at up to 25%, and gains may owe capital-gains tax (a 1031 exchange can defer both). Figures are a year-1 estimate at your 24.0% rate — not tax advice; consult a CPA.
Schools (NCES district)
- District
- Windsor Unified
- NCES district ID
- 0600034
- Math proficiency
- 25% ▼ -10.00%
- Reading proficiency
- 25% ▼ -22.00%
- Median HH income
- $81,297
- Composite
- 25.06/100
- National rank
- #7541
- State rank
- #362 of 517 in CA
Livability — Windsor
- Score
- 71/100
- State rank
- #210
- US rank
- #6671
Category grades
Schools grade is shown separately in the Schools card above.
Census & demographics
- Census place
- Windsor, CA
- County
- Sonoma County · 449,805 people
- City population
- 27,429
- Metro
- Santa Rosa-Petaluma, CA
- Population (ZIP)
- 27,429
- Household income
- $134,211
- Rent vs Own
- Severe rent burden
- 628.0
Population outlook (Sonoma County) Hauer SSP2
- Today (2025)
- 539,935 people
- By 2030
- 554,870 · +2.8%
- By 2040
- 573,262 · +6.2%
- By 2050
- 580,715 · +7.6%
- By 2075
- 579,229 · +7.3%
- By 2100
- 547,835 · +1.5%
Race, ethnicity, and origin ACS 2023
- Neighborhood character
- Majority White (59%)
- Race & ethnicity
- White 59% Hispanic / Latino 33% Two or more races 13% Native American 4% Asian 2% Black 1%
- Hispanic origin (detail)
- Mexican 28%
- Common ancestry
- Italian 4% Slovak 3% Lithuanian 2%
- Foreign-born
- 14% · Canada
- Languages at home
- 72% English-only · Spanish 25% French/Haitian/Cajun 1% Vietnamese 1%
Political lean MEDSL · Sonoma
- 2024 margin
- Solid D (+46.2) · D 71.4% · R 25.2% · Other 3.3%
- 2008→2024 swing
- -3.4pp toward R · 2008: 49.6pp · 2024: 46.2pp
- All cycles
- 2024: D+46.2 2020: D+51.5 2016: D+47.9 2012: D+44.9 2008: D+49.6
Not yet ingested
- Civics
- —
Market trends
- HPI YoY
- ▼ -348.03%
- Current HPI
- 249.6052
- Rent YoY
- —
- Metro
- Santa Rosa-Petaluma, CA
- State GDP YoY
- ▲ 3.21%
- F500 in state
- 116
Industry mix (Fortune 500 HQ in CA)
| Industry | F500 HQs | Revenue |
|---|---|---|
| Technology | 27 | $1,492B |
|
||
| Financial Services | 3 | $174B |
|
||
| Retail | 3 | $44B |
|
||
| Insurance | 3 | $26B |
|
||
| Media / Entertainment | 2 | $115B |
|
||
| Pharmaceuticals / Biotech | 2 | $62B |
|
||
Cash-flow waterfall
monthlySold comps — $/sqft
last 12 mo · ≤1 miLoading sold comps…