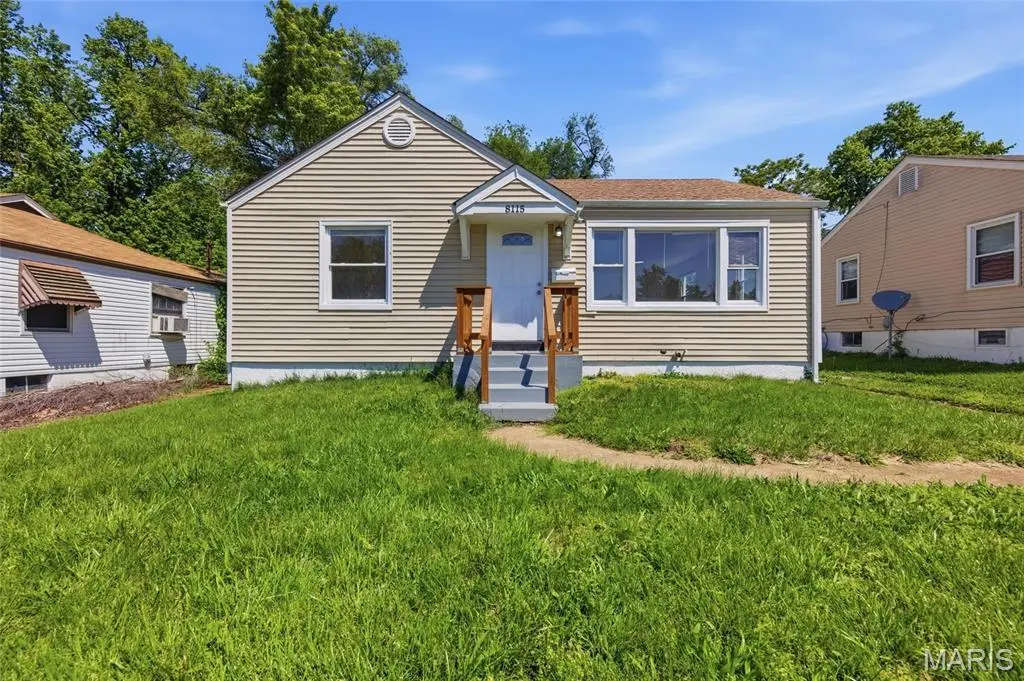
8115 Myrick St · Berkeley, MO
Flood risk 1/10 · Minimal
- FEMA flood zone
- X (unshaded)
- Chance of flooding over 30 yrs
- 0.0%
- Est. flood insurance / yr
- $473 – $860
Fire risk 1/10 · Minimal
- Est. fire insurance / yr
- $1,054 – $1,958
Heat risk 4/10 · Minor
- Hot days now (above 106°F)
- 7 days/yr
- Hot days in 30 yrs
- 21 days/yr
Wind risk 2/10 · Minimal
- Chance of severe wind over 30 yrs
- 1.0%
Air-quality risk 4/10 · Minor
- Unhealthy air days now
- 4 days/yr
- Unhealthy air days in 30 yrs
- 5 days/yr
Risk factors via First Street. Map © Google.
Why this score? — see what drove the C- grade
The composite is a weighted blend of 9 inputs, each scored 0–100. Each bar is that input's sub-score; the figure is the points it added to the 100-point composite (weight × sub-score).
- Cash flow +27.8/30.0
- DSCR +9.8/10.0
- 1% rule +6.6/10.0
- Rent growth +2.9/5.0
- Livability +2.7/5.0
- Condition / age +2.5/5.0
- Schools +1.2/10.0
- ARV discount +0.0/15.0
- Appreciation +0.0/10.0
$105,000
🖨 Deal sheet (PDF) 📄 Offer letter ✓ Due diligence
Listing remarks
Looking for a solid home with great potential? 8115 Myrick St in Berkeley has exactly what you need! This 2 bedroom, 1 bathroom home features hardwood floors in the living room and bedrooms, ceramic tile in the kitchen and bathroom, and a bright eat-in kitchen perfect for everyday living. Natural light pours through the large living room window, creating a warm and welcoming atmosphere from the moment you walk in. The unfinished basement is a true bonus — complete with laundry hookups, a rec area, and tons of storage space just waiting to be finished to your liking. Top it all off with a spacious backyard and you have a property with fantastic upside. Please note this property is bein
Key facts
- 5,998 sq ft lot
- Built 1950
- Listed 45 days
Property features AI
Exterior
- Parking: Driveway; Off-street parking
- Security: Smoke detector(s)
- Utilities: Public water; Public sewer; Electricity connected (Ameren)
- Home design: Single-family residence; One level; Private ownership; House structure
- Construction: Vinyl siding; Architectural shingle roof
- Exterior features: Deck; Front yard; Back yard; Aggregate road surface; City street frontage (50' frontage)
Interior
- Kitchen: Eat-in kitchen
- Bedrooms: 2 bedrooms on the main level
- Bathrooms: 1 full bathroom on the main level
- Heating & cooling: Forced air heating; Central air conditioning
- Interior features: Ceiling fan(s); Eat-in kitchen; Basement with 8 ft+ poured construction
- Laundry & utility: Laundry in basement
Neighborhood map
What this means for you Summary
Snapshot
- This is a 2-bed/1.0-bath single-family listed at $105k.
Deal economics
- At list price, monthly cash flow is $321 ($4k/yr) — positive.
- The deal already cash-flows at list — no discount required.
- Meets the 1% rule at list price ($1k rent vs $105k).
- Recommended offer: $102k (3.0% below list) — sets the bar for market timing.
Location & tenants
- Location reads 54/100 on livability (#774 in MO) — a working-class tenant base; expect higher turnover. Strengths: cost of living A+, housing A; Watch: health & safety C-, crime F, amenities F.
- Ferguson-Florissant R-II (suburban): math 7% / reading 20% proficiency, ranked #311 of 324 in MO (top 96%) — low school quality limits family demand, transient renter base, plan for 1-2y turnover; 70% free/reduced lunch — lower-income household profile, screen leases tightly.
- Zoned schools: Berkeley Elementary School (math 4% / reading 13%, grade F, #1,050 of 1,115 statewide, top 94%, 346 students, 99% FRL); Mccluer North High (math 5% / reading 28%, grade F, #487 of 521 statewide, top 93%, 1,136 students, 100% FRL) — zoned schools average 99% FRL vs 70% district-wide (30 pts higher); higher-poverty schools than district average — tighter screening recommended.
- Market conditions: Rents rising (+1.6%/yr); 70 active listings in the ZIP; 40 comparable units currently listed for rent nearby; rentals at typical pace (median 24d on market — plan ~3-4 weeks tenant-placement turnaround); lower-income renter base — watch delinquency; 920 units permitted in St. Louis County in 2024 (250 in 5+ unit buildings).
- This rent runs 33% of the median local income ($45k/yr) — at the standard rent-burdened threshold; future hikes will face affordability resistance.
Forward outlook
- Local home prices are declining (-3.0%/yr); year-one equity from $726 of loan paydown is wiped out by about $3k of value loss. Plan a longer hold.
Negotiation context
- It's been on market 45 days — a 3% lower offer ($102k) is reasonable based on typical stale-listing flexibility.
- 5 sale attempts since 3y ago; this cycle's ask has dropped $7k (6%) from the opening price — seller is motivated, your offer sets the floor, not the list.
Risks & watch-outs
- Watch-outs: built in 1950 — expect roof / HVAC / electrical / plumbing capex.
Questions for the listing agent
- It's been on market 45 days. Have you received any prior offers? Is the seller open to a 3% concession, seller financing, or rate buy-down credit?
- Built in 1950 — when were the roof, HVAC, electrical panel, plumbing, and water heater last replaced?
- Is there a deadline driving the sale (1031 exchange, divorce, estate, relocation)? That informs how much negotiation room exists.
- Schools are F-rated, which usually means shorter tenancies and higher turnover. Who's the typical renter profile here, and what's been the actual vacancy rate?
- Crime grade is F in this area — have there been break-ins, vandalism, or insurance claims at this property in the last 3 years? What carrier currently insures it and at what premium?
- What's the average days-on-market for RENTAL listings here right now (not sales)? A rising rental-DOM trend means longer vacancies and softer asking-rent achievability than the comps imply.
- What's the recent tenant-quality profile in this submarket — average credit score on applications, eviction rate, late-payment / NSF rate, and stable-employment percentage? A property-management company in the area should have these aggregated.
- How much new for-sale + rental construction is in the pipeline within 1–3 miles? Heavy new supply typically softens prices + rents 12–24 months out; constrained supply supports both.
Investment metrics
- 1% rule
- 1.16% ✓
- Cap rate
- 9.96%
- Cash-on-cash
- 13.11%
- DSCR
- 1.58
- GRM
- 7.2
CMA / ARV
- ARV (median comp)
- $70,690
- List price
- $105,000
- Delta
- 48.54%
- Verdict
- OVERPRICED
- Comps
- 20 within 1.0 mi
Show comp detail 12 sales within ~0.75 mi
| Address | Dist | Beds/Ba | Sqft | Sold | Price | $/sf | Match |
|---|---|---|---|---|---|---|---|
| 8234 Airport Rd | 0.22mi | 2/1.0 | 792 (0%) | 4mo | $75,000 | $95 | 87 |
| 6317 Abbott Dr | 0.27mi | 2/1.0 | 792 (0%) | 5mo | $79,900 | $101 | 83 |
| 222 Henquin Dr | 0.30mi | 2/1.0 | 816 (+3%) | 1mo | $115,000 | $141 | 80 |
| 8235 Davenport Dr | 0.35mi | 1/1.0 (-1) | 792 (0%) | 5mo | $63,000 | $80 | 74 |
| 308 Henquin Dr | 0.33mi | 2/1.0 | 861 (+9%) | 1mo | $80,000 | $93 | 69 |
| 6301 Jefferson Ave | 0.46mi | 3/1.0 (+1) | 816 (+3%) | 6mo | $62,500 | $77 | 64 |
| 213 Henquin Dr | 0.27mi | 1/1.0 (-1) | 696 (-12%) | 4mo | $34,900 | $50 | 59 |
| 6153 Hancock Ave | 0.56mi | 2/1.0 | 732 (-8%) | 5mo | $59,900 | $82 | 57 |
| 6330 Washington Ave | 0.53mi | 3/1.0 (+1) | 864 (+9%) | 1mo | $50,000 | $58 | 54 |
| 6300 Evergreen Blvd | 0.56mi | 3/1.0 (+1) | 864 (+9%) | 2mo | $99,000 | $115 | 52 |
| 221 S Harvey Ave | 0.72mi | 2/1.0 | 864 (+9%) | 3mo | $135,000 | $156 | 49 |
| 619 Carson Rd | 0.55mi | 1/1.0 (-1) | 901 (+14%) | 5mo | $75,000 | $83 | 42 |
Match score weights: distance 35% · size 25% · config 20% · recency 20%. Top-matched comps best support the ARV.
Projected returns pro-forma
-3.0% appreciation · 1.61% rent growth · sell at horizon
- IRR
- 1.6%
- Equity multiple
- 1.06×
- Total profit
- $1,730
- Equity at exit
- $15,656
- IRR
- 9.8%
- Equity multiple
- 1.71×
- Total profit
- $21,016
- Equity at exit
- $9,078
Cash invested: $29,400 (down + closing). Projections, not guarantees.
Landlord ↔ Tenant lean methodology
- Overall (STATE)
- 81 Strongly Landlord-Friendly
- State Missouri
- 81 Strongly Landlord-Friendly · R+10
- County
- — inherits STATE
- City
- — inherits STATE
ZIP-level market 63134
- Rents YoY
- 1.6%
- Active inventory
- 70
- Price-to-rent
- 7.2×
Monthly cashflow live
- Estimated rent
- $1,215 high interval (Pro) →
- Mortgage (P&I)
- −$551
- Tax from tax record
- −$44 /mo · $533/yr
- Insurance
- −$44
- HOA
- −$0
- Vacancy / Maint / Mgmt
- −$255
- Net cashflow
- $321
Break-even live
Sensitivity live
| Price | -10% $381 | -5% $351 | +0% $321 | +5% $291 | +10% $262 |
|---|---|---|---|---|---|
| Rent | -10% $225 | -5% $273 | +0% $321 | +5% $369 | +10% $417 |
| Rate | -1.0pp $374 | -0.5pp $348 | base $321 | +0.5pp $294 | +1.0pp $266 |
UW: 25.0% down · 7.5% · 30yr · 1.5% tax · 5.0% vac · 8.0% maint · 8.0% mgmt
Financing live
Cash to close
- Down payment
- $26,250
- Closing costs
- $3,150
- Reserves months
- —
- Total cash needed
- —
Loan-product check · same deal, 3 products live
Conventional
25% down · 7.5% · 30yr
- Down + closing
- —
- Monthly P&I
- —
- Monthly cashflow
- —
- DSCR
- —
- Eligible?
- —
Personal DTI + credit; lowest rate.
DSCR
20% down · 8.5% · 30yr
- Down + closing
- —
- Monthly P&I
- —
- Monthly cashflow
- —
- DSCR
- —
- Eligible?
- —
No personal income docs; deal must DSCR.
Hard money
10% down · 12.0% · 12mo
- Down + closing
- —
- Monthly P&I
- —
- Monthly cashflow
- —
- DSCR
- —
- Eligible?
- —
Short-term bridge; refi at stabilization.
Rent comps 40 comps
| Address | Beds | Baths | Sqft | Rent | $/sqft | DOM | Units | Dist |
|---|---|---|---|---|---|---|---|---|
| 6044 Cascade Dr Saint Louis, MO | 2.0 | 1.0 | 984 | $1,150 | $1.17 | 8d | 1 | 0.09mi |
| 6132 Eaton Dr Saint Louis, MO | 2.0 | 1.0 | 792 | $1,125 | $1.42 | 24d | 1 | 0.10mi |
| 8306 Whitewater Dr Saint Louis, MO | 3.0 | 1.0 | 792 | $1,195 | $1.51 | 8d | 1 | 0.20mi |
| 6156 Wulff Dr Saint Louis, MO | 3.0 | 2.0 | 960 | $1,425 | $1.48 | 11d | 1 | 0.21mi |
| 6333 Peurifoy Ave Saint Louis, MO | 3.0 | 2.0 | 840 | $1,295 | $1.54 | 24d | 1 | 0.29mi |
| 222 Henquin Dr Saint Louis, MO | 2.0 | 1.0 | 816 | $1,050 | $1.29 | 18d | 1 | 0.32mi |
| 910 Disco Dr Saint Louis, MO | 3.0 | 1.0 | 924 | $1,260 | $1.36 | 17d | 1 | 0.32mi |
| 60 Mayme Dr Saint Louis, MO | 3.0 | 1.0 | 960 | $1,285 | $1.34 | 44d | 1 | 0.32mi |
| 6214 Jefferson Ave Saint Louis, MO | 2.0 | 1.0 | 816 | $1,195 | $1.46 | 24d | 1 | 0.36mi |
| 6315 Washington Ave Berkeley, MO | 2.0 | 1.0 | 739 | $1,175 | $1.59 | 17d | 1 | 0.51mi |
| 6334 Washington Ave Berkeley, MO | 3.0 | 1.0 | 864 | $1,100 | $1.27 | 5d | 1 | 0.52mi |
| 6042 Hancock Ave Berkeley, MO | 3.0 | 1.0 | 1041 | $1,495 | $1.44 | 24d | 1 | 0.52mi |
| 6336 Washington Ave Berkeley, MO | 2.0 | 1.0 | 720 | $1,175 | $1.63 | 44d | 1 | 0.52mi |
| 6234 Hancock Ave Berkeley, MO | 2.0 | 1.0 | 846 | $1,050 | $1.24 | 44d | 1 | 0.56mi |
| 601 Carson Rd Saint Louis, MO | 2.0 | 1.0 | 743 | $950 | $1.28 | 24d | 1 | 0.61mi |
| 6625 Thurston Ave Saint Louis, MO | 2.0 | 1.0 | 939 | $1,300 | $1.38 | 44d | 1 | 0.69mi |
| 6625 Thurston Ave Saint Louis, MO | 2.0 | 1.0 | 939 | $1,400 | $1.49 | 24d | 1 | 0.69mi |
| 334 Mueller Ave Saint Louis, MO | 1.0 | 1.0 | 713 | $825 | $1.16 | 24d | 1 | 0.79mi |
| 422 Plaza Ave Saint Louis, MO | 3.0 | 1.0 | 792 | $1,000 | $1.26 | 8d | 1 | 0.93mi |
| 519 Graf Ave Saint Louis, MO | 3.0 | 2.0 | 887 | $1,297 | $1.46 | 21d | 1 | 0.94mi |
| 360 S Harvey Ave Saint Louis, MO | 2.0 | 1.0 | 936 | $925 | $0.99 | 44d | 1 | 0.94mi |
| 450 S Dade Ave Saint Louis, MO | 2.0 | 1.0 | 1040 | $1,200 | $1.15 | 24d | 1 | 1.02mi |
| 8330 Woodhurst Dr Saint Louis, MO | 3.0 | 1.0 | 1120 | $1,000 | $0.89 | 8d | 1 | 1.02mi |
| 246 Louisa Ave Saint Louis, MO | 3.0 | 1.0 | 1036 | $1,600 | $1.54 | 44d | 1 | 1.02mi |
| 5500 Mable Ave Unit 5518 B4 St. Louis, MO | 2.0 | 1.0 | 750 | $835 | $1.11 | 44d | 1 | 1.03mi |
| 5500 Mable Ave Unit 5530 B1 St. Louis, MO | 3.0 | 1.0 | 850 | $915 | $1.08 | 44d | 1 | 1.03mi |
| 709 Suburban Ave Saint Louis, MO | 2.0 | 1.0 | 975 | $1,400 | $1.44 | 44d | 1 | 1.04mi |
| 222 Randolph Ave Saint Louis, MO | 2.0 | 1.0 | 964 | $1,400 | $1.45 | 8d | 1 | 1.11mi |
| 24 Vierling Dr Saint Louis, MO | 2.0 | 1.0 | 850 | $1,290 | $1.52 | 8d | 1 | 1.12mi |
| 153 Bascom Dr Saint Louis, MO | 3.0 | 1.0 | 1076 | $1,195 | $1.11 | 20d | 1 | 1.19mi |
| 171 Elbring Dr Saint Louis, MO | 3.0 | 1.5 | 1008 | $1,395 | $1.38 | 13d | 1 | 1.22mi |
| 806 Marvin Ave Saint Louis, MO | 2.0 | 1.0 | 726 | $1,100 | $1.52 | 44d | 1 | 1.24mi |
| 419 S Florissant Rd Ferguson, MO | 2.0 | 1.0 | 1100 | $1,200 | $1.09 | 44d | 1 | 1.26mi |
| 223 Wiegel Dr Saint Louis, MO | 3.0 | 1.0 | 864 | $1,560 | $1.81 | 13d | 1 | 1.26mi |
| 5300 Grove Ave Saint Louis, MO | 3.0 | 1.0 | 840 | $1,295 | $1.54 | 24d | 1 | 1.27mi |
| 46 Bascom Dr Saint Louis, MO | 2.0 | 1.0 | 932 | $1,175 | $1.26 | 44d | 1 | 1.28mi |
| 260 Sadonia Ave Saint Louis, MO | 3.0 | 2.0 | 1088 | $1,623 | $1.49 | 21d | 1 | 1.28mi |
| 801 Thomas Ave Saint Louis, MO | 3.0 | 1.0 | 864 | $1,350 | $1.56 | 44d | 1 | 1.30mi |
| 263 Sadonia Ave Saint Louis, MO | 3.0 | 2.0 | 888 | $1,350 | $1.52 | 44d | 1 | 1.31mi |
| 1275 N Florissant Rd Saint Louis, MO | 2.0 | 1.0 | 1008 | $1,275 | $1.26 | 24d | 1 | 1.35mi |
Listing history 30 events
-
2026-06-18days on market $105,000 Active 45 DOM
-
2026-06-17price $105,000 Active 44 DOM
-
2026-06-17days on market $107,000 Active 44 DOM
-
2026-06-16days on market $107,000 Active 43 DOM
-
2026-06-15days on market $107,000 Active 42 DOM
-
2026-06-13days on market $107,000 Active 40 DOM
-
2026-06-13days on market $107,000 Active 39 DOM
-
2026-06-09days on market $107,000 Active 36 DOM
-
2026-06-08days on market $107,000 Active 35 DOM
-
2026-06-07days on market $107,000 Active 34 DOM
-
2026-06-05days on market $107,000 Active 31 DOM
-
2026-06-03days on market $107,000 Active 30 DOM
-
2026-06-02days on market $107,000 Active 29 DOM
-
2026-06-01days on market $107,000 Active 28 DOM
-
2026-05-31days on market $107,000 Active 27 DOM
-
2026-05-04$112,000 Active 865-char remark
-
2026-03-26price $104,999
-
2026-03-06price $105,000
-
2026-02-14price $110,000
-
2026-01-09$115,000 Active
-
2026-01-06historical
-
2025-08-23status Active
-
2025-08-12status Pending
-
2025-07-12price $105,000
-
2025-06-20price $110,000
-
2025-05-31$102,500 Active
-
2023-08-18soldstatus Closed
-
2023-06-21status Pending
-
2023-06-20price $49,900
-
2023-06-16$54,900 Active
ⓘ Source: listings_history table (triggers on properties + properties_extension) + one-shot
backfill from property_details.listing_events for pre-trigger history.
Tax reassessment forecast MO · Resets to sale price
- Current annual tax
- $533 · $44/mo
- Projected year-2 tax
- $1,018 · $85/mo
- Expected delta
- +$485/yr (+$40/mo · 91.1%)
ⓘ Screening estimate from a state-policy table — verify with the county assessor before closing.
Climate risk First Street
- Flood 1/10 Low FEMA zone X (unshaded) · 0% chance over 30 yrs
- Wildfire 1/10 Low
- Heat 4/10 Moderate 7 d/yr ≥106°F today · 21 d/yr by 30 yrs out
- Wind 2/10 Low 100% chance of damaging wind over 30 yrs
- Air quality 4/10 Moderate 4 unhealthy d/yr today · 5 by 30 yrs out
Nearby sold comps map
Loading sold comps map…
Walkable amenities ~0.75 mi
Loading nearby amenities…
Taxation est. · year 1
- Rental income
- $14,582
- − Mortgage interest
- −$5,882
- − Property taxes
- −$533
- − Insurance
- −$525
- − Repairs & maintenance
- −$1,167
- − Management
- −$1,167
- − Depreciation
- −$3,055
- Taxable income
- $2,255
- Est. tax owed @ 24.0%
- −$541
- After-tax cash flow
- $3,313/yr
For passive investors: Depreciation is non-cash, so a rental often shows a tax loss while cash-flowing — sheltering income. Rental losses are passive: they offset passive income freely, and up to $25,000/yr can offset ordinary (W-2) income if you actively participate and your MAGI is under $100k (phasing out to $0 by $150k); unused losses carry forward. On sale, claimed depreciation is recaptured at up to 25%, and gains may owe capital-gains tax (a 1031 exchange can defer both). Figures are a year-1 estimate at your 24.0% rate — not tax advice; consult a CPA.
Schools (NCES district)
- District
- Ferguson-Florissant R-II
- NCES district ID
- 2912010
- Math proficiency
- 7% ▼ -9.00%
- Reading proficiency
- 20% ▼ -6.00%
- Median HH income
- $44,610
- Composite
- 11.96/100
- National rank
- #9666
- State rank
- #311 of 324 in MO
Livability — Berkeley
- Score
- 54/100
- State rank
- #774
- US rank
- #23800
Category grades
Schools grade is shown separately in the Schools card above.
Census & demographics
- Census place
- Berkeley, MO
- County
- Saint Louis County · 888,823 people
- City population
- 13,059
- Metro
- St. Louis, MO-IL
- Population (ZIP)
- 13,059
- Household income
- $44,680
- Rent vs Own
- Severe rent burden
- 655.0
Population outlook (St. Louis County) Hauer SSP2
- Today (2025)
- 1,025,227 people
- By 2030
- 1,028,023 · +0.3%
- By 2040
- 1,020,940 · -0.4%
- By 2050
- 1,007,280 · -1.8%
- By 2075
- 987,277 · -3.7%
- By 2100
- 921,984 · -10.1%
Race, ethnicity, and origin ACS 2023
- Neighborhood character
- Predominantly Black (66%)
- Race & ethnicity
- Black 66% White 17% Hispanic / Latino 13% Two or more races 7%
- Hispanic origin (detail)
- Mexican 8%
- Common ancestry
- Lithuanian 1%
- Foreign-born
- 6% · Canada
- Languages at home
- 86% English-only · Spanish 11%
Political lean MEDSL · St. Louis
- 2024 margin
- Strong D (+23.4) · D 60.8% · R 37.4% · Other 1.7%
- 2008→2024 swing
- +3.5pp toward D · 2008: 19.9pp · 2024: 23.4pp
- All cycles
- 2024: D+23.4 2020: D+24.0 2016: D+16.2 2012: D+13.7 2008: D+19.9
Not yet ingested
- Civics
- —
Market trends
- HPI YoY
- ▼ -164.02%
- Current HPI
- 226.9524
- Rent YoY
- ▲ 1.61%
- Metro
- St. Louis, MO-IL
- State GDP YoY
- ▲ 1.84%
- F500 in state
- 20
Industry mix (Fortune 500 HQ in MO)
| Industry | F500 HQs | Revenue |
|---|---|---|
| Healthcare | 1 | $163B |
|
||
| Insurance | 1 | $21B |
|
||
| Industrial Technology | 1 | $17B |
|
||
| Retail | 1 | $16B |
|
||
| Industrial Distribution | 1 | $10B |
|
||
| Utilities | 1 | $9B |
|
||
Price history
+91.3% since first listed18 events — show timeline
- 2026-06-17 Price Changed $105,000 MARIS as Distributed by MLS Grid
- 2026-05-27 Price Changed $107,000 MARIS as Distributed by MLS Grid
- 2026-05-21 Price Changed $110,000 MARIS as Distributed by MLS Grid
- 2026-05-04 Listed $112,000 MARIS as Distributed by MLS Grid
- 2026-03-26 Price Changed $104,999 MARIS as Distributed by MLS Grid
- 2026-03-06 Price Changed $105,000 MARIS as Distributed by MLS Grid
- 2026-02-14 Price Changed $110,000 MARIS as Distributed by MLS Grid
- 2026-01-09 Listed $115,000 MARIS as Distributed by MLS Grid
- 2026-01-06 Coming Soon — MARIS as Distributed by MLS Grid
- 2025-08-23 Relisted — MARIS as Distributed by MLS Grid
- 2025-08-12 Pending — MARIS as Distributed by MLS Grid
- 2025-07-12 Price Changed $105,000 MARIS as Distributed by MLS Grid
- 2025-06-20 Price Changed $110,000 MARIS as Distributed by MLS Grid
- 2025-05-31 Listed $102,500 MARIS as Distributed by MLS Grid
- 2023-08-18 Sold (MLS) — MARIS as Distributed by MLS Grid
- 2023-06-21 Pending — MARIS as Distributed by MLS Grid
- 2023-06-20 Price Changed $49,900 MARIS as Distributed by MLS Grid
- 2023-06-16 Listed $54,900 MARIS as Distributed by MLS Grid
Property tax history
-6.1%/yrLatest (2022): $533 · +0.6% YoY. Source: county tax records.
Cash-flow waterfall
monthlySold comps — $/sqft
last 12 mo · ≤1 miLoading sold comps…