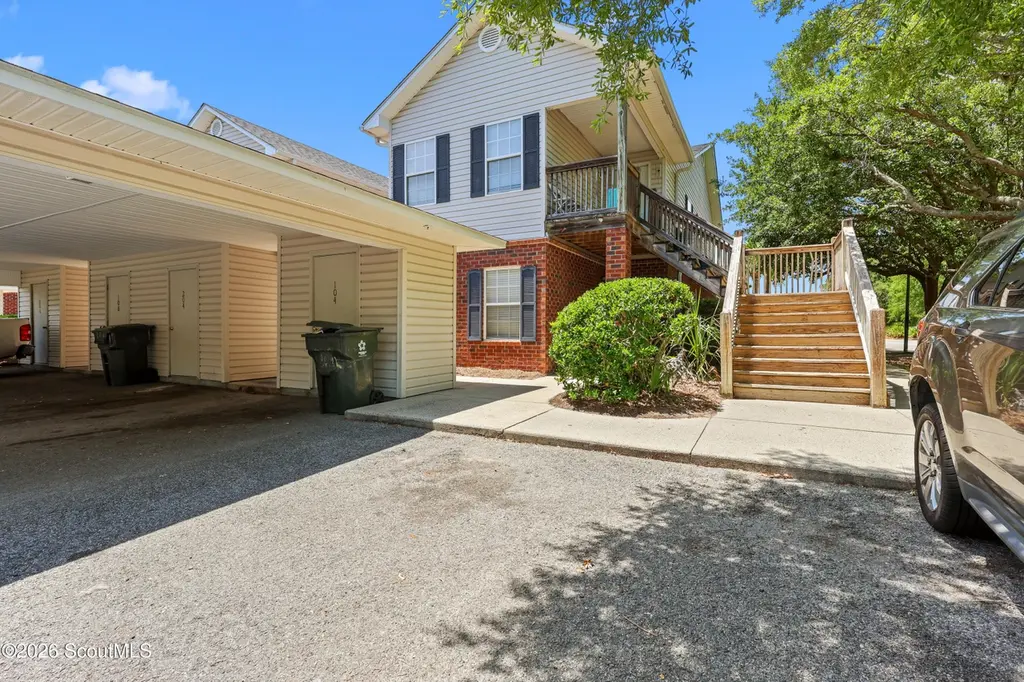
104 Red Bud Ct · Dock Junction, GA
Flood risk 3/10 · Minor
- FEMA flood zone
- X (unshaded)
- Chance of flooding over 30 yrs
- 0.12%
- Est. flood insurance / yr
- $507 – $1,088
Fire risk 3/10 · Minor
- Est. fire insurance / yr
- $963 – $1,789
Heat risk 10/10 · Severe
- Hot days now (above 108°F)
- 7 days/yr
- Hot days in 30 yrs
- 20 days/yr
Wind risk 9/10 · Severe
- Chance of severe wind over 30 yrs
- 99.0%
Air-quality risk 4/10 · Minor
- Unhealthy air days now
- 5 days/yr
- Unhealthy air days in 30 yrs
- 5 days/yr
Risk factors via First Street. Map © Google.
Why this score? — see what drove the C+ grade
The composite is a weighted blend of 9 inputs, each scored 0–100. Each bar is that input's sub-score; the figure is the points it added to the 100-point composite (weight × sub-score).
- Cash flow +25.8/30.0
- 1% rule +9.2/10.0
- DSCR +8.6/10.0
- ARV discount +7.5/15.0
- Rent growth +3.8/5.0
- Schools +3.4/10.0
- Livability +3.1/5.0
- Condition / age +2.5/5.0
- Appreciation +0.0/10.0
$119,000
🖨 Deal sheet 📄 Offer letter ✓ Due diligence
Listing remarks MLS
This unit is mint! Has new carpet, and is freshly painted throughout. Vacant with immediate occupancy.
Key facts
- $280 HOA
- 2 parking spots
- Built 2002
Property features AI
Finance
- HOA & community: Homeowners association (Azalea Place Condominium Association); Monthly association fee of $280; Association provides management
Exterior
- Parking: Has carport with 2 spaces; Paved parking
- Utilities: Public water
- Home design: Condo zoning; Has property attached
- Construction: Brick construction; Shingle roof; Slab foundation
- Exterior features: Porch; Asphalt road surface; Property currently used as residential
Interior
- Kitchen: Dishwasher; Microwave; Range; Refrigerator
- Bedrooms: 3 main-level bedrooms
- Bathrooms: 2 full bathrooms
- Heating & cooling: Central heating; Electric heating; Has cooling
- Interior features: Unfurnished; Total of 5 rooms
Neighborhood map
What this means for you Summary
Snapshot
- This is a 3-bed/2.0-bath condo listed at $119k.
Deal economics
- At list price, monthly cash flow is $290 ($3k/yr) — positive.
- The deal already cash-flows at list — no discount required.
- Meets the 1% rule at list price ($2k rent vs $119k).
- Cap rate 9.2% vs local median 3.6% in Dock Junction — top-decile yield for the area; either an underpriced asset or a hidden risk that comps aren't pricing in. Stress-test before assuming the spread holds.
Location & tenants
- Location reads 62/100 on livability (#298 in GA) — a middle-class / working-renter tenant base. Strengths: cost of living A+, housing A+; Watch: schools F, amenities F, commute F.
- Glynn County (other): math 37% / reading 42% proficiency, ranked #47 of 174 in GA (top 27%) — families likely to look elsewhere, expect single-tenant / working-renter base with shorter leases.
- Market conditions: Rents rising fast (+5.1%/yr); 183 active listings in the ZIP; 9 comparable units currently listed for rent nearby; rentals lingering (median 44d on market — plan ~5-8 weeks vacancy on turnover, expect pricing pressure); 78% of comp listings sitting > 30 days — soft ceiling on asking rent; lower-income renter base — watch delinquency; 734 units permitted in Glynn County in 2024 (136 in 5+ unit buildings).
- At $1,692/mo this rent would consume 51% of the median local household income ($40k/yr) (locally 1406% of renters already pay >50% of income on rent) — very limited rent-growth headroom before tenants either downsize or default.
Forward outlook
- Local home prices are declining (-3.0%/yr); year-one equity from $823 of loan paydown is wiped out by about $4k of value loss. Plan a longer hold.
- Glynn County population projected at +13% by 2050 — modest demand growth; plan on rents tracking national, not racing it.
- At projected returns (-3.0% appreciation + 5.1% rent growth), your $33k cash investment doubles in ~9 years — after that, you're playing with house money.
Negotiation context
- Only 13 days on market — expect competitive offers; lowballing is unlikely to land.
- 4 sale attempts since 24y ago with the ask held roughly flat each time — persistent listings suggest the price (not the market) is what's stuck; bring a comps-based counter.
Risks & watch-outs
- Climate carrying-cost: severe wind risk, 99% chance of damaging wind over 30y; extreme-heat days projected 7→20/yr by 2055 (HVAC capex compounding) — expect insurance premiums to compound above CPI over the hold.
Questions for the listing agent
- What does the HOA fee cover, when was the last increase, and are there any pending special assessments or reserve-fund shortfalls?
- Any open or pending special assessments — roof, HVAC, plumbing, elevator, façade? What's the per-unit balance and payoff schedule, and is the seller paying it off at close or rolling it to the buyer?
- Is there a deadline driving the sale (1031 exchange, divorce, estate, relocation)? That informs how much negotiation room exists.
- Schools are F-rated, which usually means shorter tenancies and higher turnover. Who's the typical renter profile here, and what's been the actual vacancy rate?
- What's the average days-on-market for RENTAL listings here right now (not sales)? A rising rental-DOM trend means longer vacancies and softer asking-rent achievability than the comps imply.
- What's the recent tenant-quality profile in this submarket — average credit score on applications, eviction rate, late-payment / NSF rate, and stable-employment percentage? A property-management company in the area should have these aggregated.
- How much new apartment / multifamily construction is in the pipeline within 1–3 miles? Heavy new supply (>2% of stock underway) typically softens rents 12–24 months out; light construction supports rent growth.
Investment metrics
- 1% rule
- 1.42% ✓
- Cap rate
- 9.22%
- Cash-on-cash
- 10.44%
- DSCR
- 1.46
- GRM
- 5.9
CMA / ARV
No comps found within radius.
Projected returns pro-forma
-3.0% appreciation · 5.08% rent growth · sell at horizon
- IRR
- 2.3%
- Equity multiple
- 1.09×
- Total profit
- $2,960
- Equity at exit
- $17,743
- IRR
- 14.2%
- Equity multiple
- 2.28×
- Total profit
- $42,496
- Equity at exit
- $10,289
Cash invested: $33,320 (down + closing). Projections, not guarantees.
Landlord ↔ Tenant lean methodology
- Overall (STATE)
- 90 Strongly Landlord-Friendly
- State Georgia
- 90 Strongly Landlord-Friendly · R+3
- County
- — inherits STATE
- City
- — inherits STATE
ZIP-level market 31520
- Rents YoY
- 5.1%
- Active inventory
- 183
- Price-to-rent
- 5.9×
Monthly cashflow live
- Estimated rent
- $1,692 high interval (Pro) →
- Mortgage (P&I)
- −$624
- Tax from tax record
- −$93 /mo · $1,118/yr
- Insurance
- −$50
- HOA
- −$280
- Vacancy / Maint / Mgmt
- −$355
- Net cashflow
- $290
Break-even live
UW: 25.0% down · 7.5% · 30yr · 1.5% tax · 5.0% vac · 8.0% maint · 8.0% mgmt
Financing live
Cash to close
- Down payment
- $29,750
- Closing costs
- $3,570
- Reserves months
- —
- Total cash needed
- —
Loan-product check · same deal, 3 products live
Conventional
25% down · 7.5% · 30yr
- Down + closing
- —
- Monthly P&I
- —
- Monthly cashflow
- —
- DSCR
- —
- Eligible?
- —
Personal DTI + credit; lowest rate.
DSCR
20% down · 8.5% · 30yr
- Down + closing
- —
- Monthly P&I
- —
- Monthly cashflow
- —
- DSCR
- —
- Eligible?
- —
No personal income docs; deal must DSCR.
Hard money
10% down · 12.0% · 12mo
- Down + closing
- —
- Monthly P&I
- —
- Monthly cashflow
- —
- DSCR
- —
- Eligible?
- —
Short-term bridge; refi at stabilization.
Rent comps 9 comps
| Address | Beds | Baths | Sqft | Rent | $/sqft | DOM | Units | Dist |
|---|---|---|---|---|---|---|---|---|
| 500 Coastal Club Cir Brunswick, GA | 2.0 | 2.0 | 1153 | $1,314 | $1.14 | 43d | 5 | 0.40mi |
| 294 Windridge Dr Brunswick, GA | 3.0 | 2.0 | 1430 | $1,600 | $1.12 | 43d | 1 | 0.57mi |
| 500 Beverly Villas Dr Brunswick, GA | 2.0 | 2.0 | 1336 | $1,712 | $1.28 | 43d | 4 | 0.57mi |
| 5600 Altama Ave Brunswick, GA | 2.0 | 1.0 | 750 | $1,175 | $1.57 | 43d | 3 | 0.94mi |
| 3200 Cypress Mill Rd Brunswick, GA | 2.0–3.0 | 2.0 | 1168 | $1,485 | $1.27 | 7d | 13 | 1.11mi |
| 1105 Fountain Lake Dr Brunswick, GA | 2.0–3.0 | 2.0–2.5 | 1157 | $1,575 | $1.36 | 2d | 6 | 1.33mi |
| 111 S Palm Dr Brunswick, GA | 1.0–3.0 | 1.0–2.0 | 1077 | $1,589 | $1.48 | 43d | 11 | 1.46mi |
| 2640 Canary Dr Brunswick, GA | 4.0 | 2.0 | 1450 | $2,200 | $1.52 | 43d | 1 | 1.49mi |
| 3742 Ogg Ave Brunswick, GA | 2.0 | 1.0 | 797 | $1,250 | $1.57 | 43d | 1 | 1.49mi |
HOA detail condo
- Monthly dues
- $280 · $3,360/yr
- Assessments
- None detected in remarks — confirm with the listing agent.
Listing history 13 events
-
2026-06-05statusdays on market $119,000 Pending 13 DOM
-
2026-06-03days on market $119,000 Active 12 DOM
-
2026-06-02days on market $119,000 Active 11 DOM
-
2026-06-01days on market $119,000 Active 10 DOM
-
2026-05-31days on market $119,000 Active 9 DOM
-
2026-05-30days on market $119,000 Active 8 DOM
-
2026-05-21$119,000 Active
-
2009-01-31historical
-
2006-07-25soldstatus $105,000 102-char remark
Show marketing remark (102 chars)
This unit is mint! Has new carpet, and is freshly painted throughout. Vacant with immediate occupancy.
-
2006-02-08$105,000 102-char remark
Show marketing remark (102 chars)
This unit is mint! Has new carpet, and is freshly painted throughout. Vacant with immediate occupancy.
-
2004-10-12soldstatus $112,500
-
2004-09-08$116,500
-
2002-06-21$100,000
ⓘ Source: listings_history table (triggers on properties + properties_extension) + one-shot
backfill from property_details.listing_events for pre-trigger history.
Tax reassessment forecast GA · Resets to sale price
- Current annual tax
- $1,118 · $93/mo
- Projected year-2 tax
- $1,118 · $93/mo
- Expected delta
- $0/yr ($0/mo · 0.0%)
ⓘ Screening estimate from a state-policy table — verify with the county assessor before closing.
Climate risk First Street
- Flood 3/10 Moderate FEMA zone X (unshaded) · 12% chance over 30 yrs
- Wildfire 3/10 Moderate
- Heat 10/10 Extreme 7 d/yr ≥108°F today · 20 d/yr by 30 yrs out
- Wind 9/10 Extreme 99% chance of damaging wind over 30 yrs
- Air quality 4/10 Moderate 5 unhealthy d/yr today · 5 by 30 yrs out
Nearby sold comps map
Loading sold comps map…
Walkable amenities ~0.75 mi
Loading nearby amenities…
Taxation est. · year 1
- Rental income
- $20,304
- − Mortgage interest
- −$6,666
- − Property taxes
- −$1,118
- − Insurance
- −$595
- − Repairs & maintenance
- −$1,624
- − Management
- −$1,624
- − HOA
- −$3,360
- − Depreciation
- −$3,462
- Taxable income
- $1,855
- Est. tax owed @ 24.0%
- −$445
- After-tax cash flow
- $3,034/yr
For passive investors: Depreciation is non-cash, so a rental often shows a tax loss while cash-flowing — sheltering income. Rental losses are passive: they offset passive income freely, and up to $25,000/yr can offset ordinary (W-2) income if you actively participate and your MAGI is under $100k (phasing out to $0 by $150k); unused losses carry forward. On sale, claimed depreciation is recaptured at up to 25%, and gains may owe capital-gains tax (a 1031 exchange can defer both). Figures are a year-1 estimate at your 24.0% rate — not tax advice; consult a CPA.
Schools (NCES district)
- District
- Glynn County
- NCES district ID
- 1302400
- Math proficiency
- 37% ▼ -9.00%
- Reading proficiency
- 42% ▼ -7.00%
- Median HH income
- $47,554
- Composite
- 33.83/100
- National rank
- #5359
- State rank
- #47 of 174 in GA
Livability — Dock Junction
- Score
- 62/100
- State rank
- #298
- US rank
- #16233
Category grades
Schools grade is shown separately in the Schools card above.
Census & demographics
- Census place
- Dock Junction, GA
- County
- Glynn County · 69,019 people
- Metro
- Brunswick, GA
- Population (ZIP)
- 22,313
- Household income
- $40,071
- Rent vs Own
- Severe rent burden
- 1406.0
Population outlook (Glynn County) Hauer SSP2
- Today (2025)
- 91,404 people
- By 2030
- 94,806 · +3.7%
- By 2040
- 100,060 · +9.5%
- By 2050
- 103,258 · +13.0%
- By 2075
- 107,970 · +18.1%
- By 2100
- 103,363 · +13.1%
Race, ethnicity, and origin ACS 2023
- Neighborhood character
- Diverse neighborhood (Simpson 0.63)
- Race & ethnicity
- Black 50% White 33% Hispanic / Latino 11% Two or more races 9% Asian 1%
- Hispanic origin (detail)
- Mexican 7%
- Common ancestry
- Italian 2% Slovak 1% Serbian 1%
- Foreign-born
- 8% · Canada, South Korea
- Languages at home
- 87% English-only · Spanish 10% French/Haitian/Cajun 1% Korean 1%
Political lean MEDSL · Glynn
- 2024 margin
- Strong R (+26.0) · D 36.8% · R 62.8%
- 2008→2024 swing
- -2.6pp toward R · 2008: -23.4pp · 2024: -26.0pp
- All cycles
- 2024: R+26.0 2020: R+23.2 2016: R+28.6 2012: R+27.0 2008: R+23.4
Not yet ingested
- Civics
- —
Market trends
- HPI YoY
- ▼ -274.83%
- Current HPI
- 180.4581
- Rent YoY
- ▲ 5.08%
- Metro
- Brunswick, GA
- State GDP YoY
- ▲ 2.66%
- F500 in state
- 28
Industry mix (Fortune 500 HQ in GA)
| Industry | F500 HQs | Revenue |
|---|---|---|
| Paper / Packaging | 2 | $29B |
|
||
| Retail | 1 | $160B |
|
||
| Transportation / Logistics | 1 | $91B |
|
||
| Airlines | 1 | $62B |
|
||
| Consumer Goods | 1 | $47B |
|
||
| Utilities | 1 | $25B |
|
||
Price history
+19.0% since first listed7 events — show timeline
- 2026-05-21 Listed $119,000 GIAR
- 2009-01-31 Listing Removed — GIAR
- 2006-07-25 Sold (MLS) $105,000 GIAR
- 2006-02-08 Listed $105,000 GIAR
- 2004-10-12 Sold (MLS) $112,500 GIAR
- 2004-09-08 Listed $116,500 GIAR
- 2002-06-21 Listed $100,000 GIAR
Property tax history
+7.4%/yrLatest (2025): $1,118 · -0.0% YoY. Source: county tax records.
Cash-flow waterfall
monthlySold comps — $/sqft
last 12 mo · ≤1 miLoading sold comps…