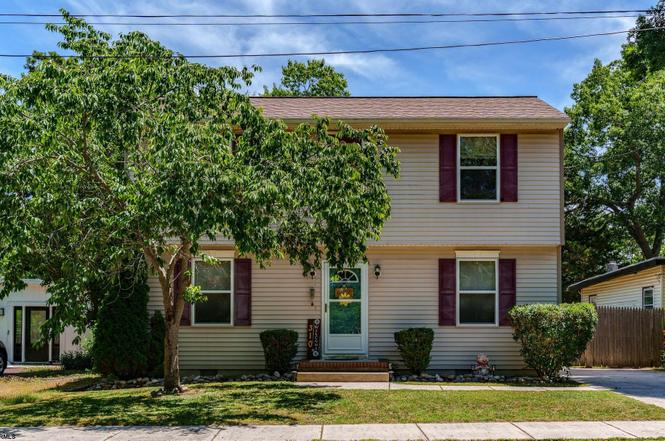
310 Elmwood Ave · Egg Harbor, NJ
Flood risk 7/10 · Major
- FEMA flood zone
- X (unshaded)
- Chance of flooding over 30 yrs
- 0.99%
- Est. flood insurance / yr
- $507 – $1,088
Fire risk 3/10 · Minor
- Est. fire insurance / yr
- $526 – $976
Heat risk 7/10 · Major
- Hot days now (above 101°F)
- 7 days/yr
- Hot days in 30 yrs
- 15 days/yr
Wind risk 8/10 · Major
- Chance of severe wind over 30 yrs
- 80.0%
Air-quality risk 2/10 · Minimal
- Unhealthy air days now
- 1 days/yr
- Unhealthy air days in 30 yrs
- 2 days/yr
Risk factors via First Street. Map © Google.
Why this score? — see what drove the D+ grade
The composite is a weighted blend of 9 inputs, each scored 0–100. Each bar is that input's sub-score; the figure is the points it added to the 100-point composite (weight × sub-score).
- ARV discount +15.0/15.0
- Cash flow +14.7/30.0
- DSCR +4.5/10.0
- 1% rule +4.0/10.0
- Schools +3.0/10.0
- Rent growth +2.5/5.0
- Livability +2.5/5.0
- Condition / age +2.5/5.0
- Appreciation +0.0/10.0
$269,000
🖨 Deal sheet (PDF) 📄 Offer letter ✓ Due diligence
Listing remarks MLS
BRAND NEW CONSTRUCTION!HOME IS UP AND READY TO SELL!BUILDER WANTS SOLD!READY TO SEE NOW!NOW IS YOUR TIME-2 BR 2BA 2 STORY-IN NICE AREA OF EHT CLOSE TO EVERYTHING!EXACTLY WHAT YOUR BUYERS WANT-READY FOR DELIVERY! EZ TO SHOW- WONT LAST!LOWEST PRICED NEW CONSTRUCTION IN EHT!BRING ALL REASONABLE OFFERS!!
Key facts
- New appliances
- New roof
- Large fenced in yard
Tags
Property features AI
Finance
- Other: For sale
Exterior
- Parking: Two-car exterior parking (no garage)
- Utilities: Public water; Public sewer; Gas water heater
- Home design: Tan exterior; Vinyl siding; Approximately 11–15 years old
- Construction: Vinyl exterior
- Exterior features: Fenced yard; Lot dimensions approximately 100 x 150; Not waterfront
Interior
- Kitchen: Eat-in kitchen; Disposal; Dishwasher; Gas stove; Microwave; Self-cleaning oven
- Bedrooms: Total rooms: 6
- Flooring: Tile; Wall-to-wall carpet; Laminate
- Bathrooms: 1 full bathroom; 1 half bathroom
- Heating & cooling: Central air conditioning; Forced air heating; Natural gas heating
- Interior features: Carbon monoxide detector; Smoke/fire alarm; Walk-in closet; Blinds
- Laundry & utility: Washer; Dryer
Neighborhood map
What this means for you Summary
Snapshot
- This is a 2-bed/1.5-bath single-family listed at $269k.
Deal economics
- At list price, monthly cash flow is $1 ($7/yr) — positive.
- The deal already cash-flows at list — no discount required.
- To meet the 1% rule (rent ≥ 1% of price), the offer needs to be $242k (9.9% below list).
- Recommended offer: $242k (9.9% below list) — sets the bar for 1% rule.
Location & tenants
- Location reads: area grade D — affects rentability + tenant quality, not the cash-flow math above.
- Egg Harbor Township School District (suburban): math 18% / reading 46% proficiency, ranked #311 of 472 in NJ (top 66%) — families likely to look elsewhere, expect single-tenant / working-renter base with shorter leases.
- Zoned schools: Clayton J. Davenport Elementary School (math 17% / reading 32%, grade F, #878 of 1,303 statewide, top 70%, 757 students, 64% FRL); Fernwood Avenue Middle School (math 13% / reading 50%, grade F, #289 of 431 statewide, top 69%, 883 students, 50% FRL); Egg Harbor Township High School (math 32% / reading 52%, grade F, #169 of 399 statewide, top 44%, 2,335 students, 47% FRL) — zoned schools average 54% FRL vs 34% district-wide (19 pts higher); higher-poverty schools than district average — tighter screening recommended.
- Market conditions: 363 active listings in the ZIP; 1 comparable units currently listed for rent nearby; 672 units permitted in Atlantic County in 2024 (258 in 5+ unit buildings).
Forward outlook
- Local home prices are declining (-3.0%/yr); year-one equity from $2k of loan paydown is wiped out by about $8k of value loss. Plan a longer hold.
- Atlantic County population projected at -12% by 2050 — secular population decline; favor cash flow + early exit over multi-decade hold.
Negotiation context
- Only 3 days on market — expect competitive offers; lowballing is unlikely to land.
- 6 sale attempts since 26y ago with the ask held roughly flat each time — persistent listings suggest the price (not the market) is what's stuck; bring a comps-based counter.
- Current owner paid $129k; list at $269k implies a 109% gain — meaningful room to come down on a strong offer.
Risks & watch-outs
- Watch-outs: flood insurance adds $66/mo.
- Climate carrying-cost: major flood risk; severe wind risk, 80% chance of damaging wind over 30y; extreme-heat days projected 7→15/yr by 2055 (HVAC capex compounding) — expect insurance premiums to compound above CPI over the hold.
Questions for the listing agent
- What's the actual annual flood-insurance premium (NFIP or private), and is the property in a SFHA with mandatory coverage?
- Is there a deadline driving the sale (1031 exchange, divorce, estate, relocation)? That informs how much negotiation room exists.
- The area grade is low — what's the realistic commute time and amenity access for the typical tenant pool here? Any planned neighborhood developments (good or bad) we should know about?
- What's the average days-on-market for RENTAL listings here right now (not sales)? A rising rental-DOM trend means longer vacancies and softer asking-rent achievability than the comps imply.
- What's the recent tenant-quality profile in this submarket — average credit score on applications, eviction rate, late-payment / NSF rate, and stable-employment percentage? A property-management company in the area should have these aggregated.
- How much new for-sale + rental construction is in the pipeline within 1–3 miles? Heavy new supply typically softens prices + rents 12–24 months out; constrained supply supports both.
Investment metrics
- 1% rule
- 0.90% ✗
- Cap rate
- 6.59%
- Cash-on-cash
- 1.07%
- DSCR
- 1.05
- GRM
- 9.2
CMA / ARV
- ARV (on-the-fly)
- $323,268
- Comps found
- 1
Show comp detail 1 sale within ~0.75 mi
| Address | Dist | Beds/Ba | Sqft | Sold | Price | $/sf | Match |
|---|---|---|---|---|---|---|---|
| 4 Essex Dr | 0.57mi | 2/1.0 | 1,092 (+7%) | 1mo | $345,000 | $316 | 60 |
Match score weights: distance 35% · size 25% · config 20% · recency 20%. Top-matched comps best support the ARV.
Projected returns pro-forma
-3.0% appreciation · 3.0% rent growth · sell at horizon
- IRR
- -16.3%
- Equity multiple
- 0.42×
- Total profit
- $-43,479
- Equity at exit
- $40,109
- IRR
- -7.9%
- Equity multiple
- 0.50×
- Total profit
- $-37,522
- Equity at exit
- $23,258
Cash invested: $75,320 (down + closing). Projections, not guarantees.
Landlord ↔ Tenant lean methodology
- Overall (STATE)
- 21 Tenant-Leaning
- State New Jersey
- 21 Tenant-Leaning · D+6
- County
- — inherits STATE
- City
- — inherits STATE
ZIP-level market 08234
- Home prices YoY
- -6.7%
- Active inventory
- 363
- Price-to-rent
- 9.2×
Monthly cashflow live
- Estimated rent
- $2,425 medium interval (Pro) →
- Mortgage (P&I)
- −$1,411
- Tax from tax record
- −$326 /mo · $3,911/yr
- Insurance
- −$112
- Flood insurance flood zone
- −$66 /mo · $798/yr
- HOA
- −$0
- Vacancy / Maint / Mgmt
- −$509
- Net cashflow
- $1
Break-even live
Sensitivity live
| Price | -10% $153 | -5% $77 | +0% $1 | +5% $-76 | +10% $-152 |
|---|---|---|---|---|---|
| Rent | -10% $-191 | -5% $-95 | +0% $1 | +5% $96 | +10% $192 |
| Rate | -1.0pp $136 | -0.5pp $69 | base $1 | +0.5pp $-69 | +1.0pp $-140 |
UW: 25.0% down · 7.5% · 30yr · 1.5% tax · 5.0% vac · 8.0% maint · 8.0% mgmt
Financing live
Cash to close
- Down payment
- $67,250
- Closing costs
- $8,070
- Reserves months
- —
- Total cash needed
- —
Loan-product check · same deal, 3 products live
Conventional
25% down · 7.5% · 30yr
- Down + closing
- —
- Monthly P&I
- —
- Monthly cashflow
- —
- DSCR
- —
- Eligible?
- —
Personal DTI + credit; lowest rate.
DSCR
20% down · 8.5% · 30yr
- Down + closing
- —
- Monthly P&I
- —
- Monthly cashflow
- —
- DSCR
- —
- Eligible?
- —
No personal income docs; deal must DSCR.
Hard money
10% down · 12.0% · 12mo
- Down + closing
- —
- Monthly P&I
- —
- Monthly cashflow
- —
- DSCR
- —
- Eligible?
- —
Short-term bridge; refi at stabilization.
Rent comps 1 comps
| Address | Beds | Baths | Sqft | Rent | $/sqft | DOM | Units | Dist |
|---|---|---|---|---|---|---|---|---|
| 6020 Delilah Rd Egg Harbor Township, NJ | 1.0–2.0 | 1.0–2.0 | 1009 | $2,425 | $2.40 | 15d | 1 | 1.01mi |
Listing history 3 events
-
2026-06-22days on market $269,000 Active 3 DOM
-
2026-06-19remarks 277-char remark
-
2026-06-19$269,000 Active 1 DOM
ⓘ Source: listings_history table (triggers on properties + properties_extension) + one-shot
backfill from property_details.listing_events for pre-trigger history.
Tax reassessment forecast NJ · Partial reset (capped growth)
- Current annual tax
- $3,911 · $326/mo
- Projected year-2 tax
- $5,305 · $442/mo
- Expected delta
- +$1,393/yr (+$116/mo · 35.6%)
ⓘ Screening estimate from a state-policy table — verify with the county assessor before closing.
Climate risk First Street
- Flood 7/10 Severe FEMA zone X (unshaded) · 99% chance over 30 yrs
- Wildfire 3/10 Moderate
- Heat 7/10 Severe 7 d/yr ≥101°F today · 15 d/yr by 30 yrs out
- Wind 8/10 Severe 80% chance of damaging wind over 30 yrs
- Air quality 2/10 Low 1 unhealthy d/yr today · 2 by 30 yrs out
Nearby sold comps map
Loading sold comps map…
Walkable amenities ~0.75 mi
Loading nearby amenities…
Taxation est. · year 1
- Rental income
- $29,100
- − Mortgage interest
- −$15,068
- − Property taxes
- −$3,911
- − Insurance
- −$2,142
- − Repairs & maintenance
- −$2,328
- − Management
- −$2,328
- − Depreciation
- −$7,825
- Taxable loss
- −$4,503
- Est. tax savings @ 24.0%
- +$1,081
- After-tax cash flow
- $1,088/yr
For passive investors: Depreciation is non-cash, so a rental often shows a tax loss while cash-flowing — sheltering income. Rental losses are passive: they offset passive income freely, and up to $25,000/yr can offset ordinary (W-2) income if you actively participate and your MAGI is under $100k (phasing out to $0 by $150k); unused losses carry forward. On sale, claimed depreciation is recaptured at up to 25%, and gains may owe capital-gains tax (a 1031 exchange can defer both). Figures are a year-1 estimate at your 24.0% rate — not tax advice; consult a CPA.
Schools (NCES district)
- District
- Egg Harbor Township School District
- NCES district ID
- 3404560
- Math proficiency
- 18% ▼ -24.00%
- Reading proficiency
- 46% ▼ -6.00%
- Median HH income
- $71,612
- Composite
- 29.81/100
- National rank
- #6421
- State rank
- #311 of 472 in NJ
Livability — Egg Harbor
No livability data for this city. (Only ~50 U.S. cities are tracked.)
Census & demographics
- Population (ZIP)
- 46,856
Population outlook (Atlantic County) Hauer SSP2
- Today (2025)
- 268,948 people
- By 2030
- 264,497 · -1.7%
- By 2040
- 252,261 · -6.2%
- By 2050
- 237,846 · -11.6%
- By 2075
- 210,650 · -21.7%
- By 2100
- 180,234 · -33.0%
Race, ethnicity, and origin ACS 2023
- Neighborhood character
- Diverse neighborhood (Simpson 0.63)
- Race & ethnicity
- White 56% Hispanic / Latino 16% Asian 13% Black 9% Two or more races 9%
- Hispanic origin (detail)
- Mexican 3% Puerto Rican 6% Dominican 2%
- Common ancestry
- Romanian 3% Italian 1% Slovak 1%
- Foreign-born
- 17% · Canada, China, Vietnam
- Languages at home
- 73% English-only · Spanish 12% Other Indo-European 4% Tagalog/Filipino 3%
Political lean MEDSL · Atlantic
- 2024 margin
- Toss-up / Even · D 47.7% · R 50.7% · Other 1.6%
- 2008→2024 swing
- -18.1pp toward R · 2008: 15.1pp · 2024: -3.0pp
- All cycles
- 2024: R+3.0 2020: D+6.7 2016: D+6.2 2012: D+17.2 2008: D+15.1
Not yet ingested
- Civics
- —
Market trends
- HPI YoY
- ▼ -22.76%
- Current HPI
- 319.2948
- Rent YoY
- —
- Metro
- —
- State GDP YoY
- ▲ 2.05%
- F500 in state
- 34
Industry mix (Fortune 500 HQ in NJ)
| Industry | F500 HQs | Revenue |
|---|---|---|
| Consumer Goods | 3 | $31B |
|
||
| Pharmaceuticals | 2 | $153B |
|
||
| Technology | 2 | $21B |
|
||
| Insurance | 2 | $20B |
|
||
| Healthcare | 2 | $19B |
|
||
| Financial Services | 1 | $70B |
|
||
Price history
+2052.0% since first listed16 events — show timeline
- 2026-06-18 Listed $269,000 SJSRMLS
- 2013-06-07 Sold (MLS) $129,000 SJSRMLS
- 2013-05-01 Listing Removed — SJSRMLS
- 2012-12-19 Listed $139,000 SJSRMLS
- 2012-12-14 Sold (MLS) $10,258 SJSRMLS
- 2012-09-19 Listing Removed — SJSRMLS
- 2012-08-24 Listed $24,995 SJSRMLS
- 2012-07-01 Listing Removed — SJSRMLS
- 2011-07-08 Listed $19,900 SJSRMLS
- 2011-04-06 Listing Removed — SJSRMLS
- 2010-10-22 Listed $34,900 SJSRMLS
- 2001-06-12 Sold (Public Records) $25,000 Public Records
- 2001-06-12 Sold (MLS) $25,000 SJSRMLS
- 2001-05-16 Listing Removed — SJSRMLS
- 2000-12-12 Listed $24,000 SJSRMLS
- 1993-02-05 Sold (Public Records) $12,500 Public Records
Property tax history
+1.4%/yrLatest (2025): $3,911 · +1.4% YoY. Source: county tax records.
Cash-flow waterfall
monthlySold comps — $/sqft
last 12 mo · ≤1 miLoading sold comps…