 Triplex
2505 Jefferson St · Muskegon Heights, MI
Flood risk 1/10 · Minimal
- FEMA flood zone
- X (unshaded)
- Chance of flooding over 30 yrs
- 0.0%
- Est. flood insurance / yr
- $473 – $860
Fire risk 1/10 · Minimal
- Est. fire insurance / yr
- $784 – $1,456
Heat risk 2/10 · Minimal
- Hot days now (above 93°F)
- 7 days/yr
- Hot days in 30 yrs
- 15 days/yr
Wind risk 1/10 · Minimal
- Chance of severe wind over 30 yrs
- —
Air-quality risk 4/10 · Minor
- Unhealthy air days now
- 4 days/yr
- Unhealthy air days in 30 yrs
- 6 days/yr
Risk factors via First Street. Map © Google.
Why this score? — see what drove the B grade
The composite is a weighted blend of 9 inputs, each scored 0–100. Each bar is that input's sub-score; the figure is the points it added to the 100-point composite (weight × sub-score).
- Cash flow +30.0/30.0
- 1% rule +10.0/10.0
- DSCR +10.0/10.0
- ARV discount +7.5/15.0
- Schools +5.0/10.0
- Livability +3.1/5.0
- Rent growth +2.5/5.0
- Condition / age +2.5/5.0
- Appreciation +0.0/10.0
$110,000
🖨 Deal sheet (PDF) 📄 Offer letter ✓ Due diligence
Multi-family units
County records classify this as Multi-Family (2-4 Unit). Listing-text estimate: 3 units. confirmed
Listing remarks MLS
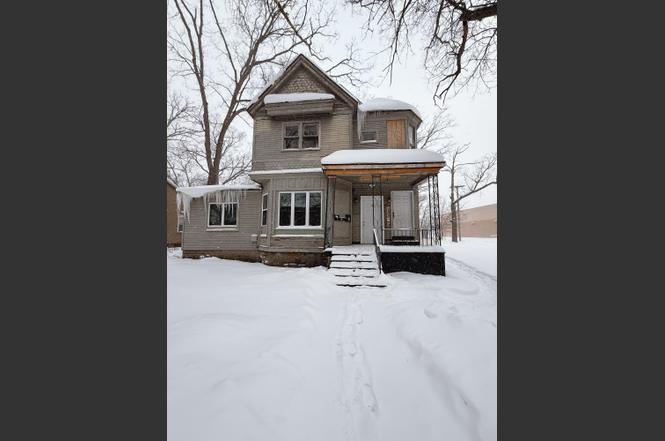
Welcome to 2505 Jefferson Street, Muskegon Heights, MI 49444, a well-maintained multi-family triplex. The property consists of three separate units and includes a detached garage, offering added functionality and value. Unit 1 features two bedrooms and one bathroom, Unit 2 offers one bedroom and one bathroom, and Unit 3 includes three bedrooms and one bathroom with a designated laundry area. Significant capital improvements have been completed, including a new roof, updated electrical system, a new boiler system, and updated water lines with PEX.
Key facts
- Multi-family triplex
- Corner lot
- New roof
Tags
Neighborhood map
What this means for you Summary
Snapshot
- This is a 2×2bd/1.0ba + 1×3bd/1.0ba units multifamily listed at $110k.
Deal economics
- At list price, monthly cash flow is $2k ($18k/yr) — positive. Per door: $502/mo.
- The deal already cash-flows at list — no discount required.
- Meets the 1% rule at list price ($3k rent vs $110k).
- Recommended offer: $103k (6.0% below list) — sets the bar for market timing.
- Cap rate 22.7% vs local median 8.4% in Muskegon Heights — top-decile yield for the area; either an underpriced asset or a hidden risk that comps aren't pricing in. Stress-test before assuming the spread holds.
Location & tenants
- Location reads 61/100 on livability (#574 in MI) — a middle-class / working-renter tenant base. Strengths: cost of living A+, housing A; Watch: schools D+, crime F, amenities F.
- Market conditions: 239 active listings in the ZIP; 438 units permitted in Muskegon County in 2024 (115 in 5+ unit buildings).
- At $2,960/mo this rent would consume 67% of the median local household income ($53k/yr) (locally 930% of renters already pay >50% of income on rent) — very limited rent-growth headroom before tenants either downsize or default.
Forward outlook
- Local home prices are declining (-3.0%/yr); year-one equity from $761 of loan paydown is wiped out by about $3k of value loss. Plan a longer hold.
- Muskegon County population projected to shrink 8% by 2050 — rents likely to lag national; underwrite the cash flow, not the appreciation.
- At projected returns (-3.0% appreciation + 3.0% rent growth), your $31k cash investment doubles in ~2 years — after that, you're playing with house money.
Negotiation context
- It's been on market 74 days — a 6% lower offer ($103k) is reasonable based on typical stale-listing flexibility.
- 2 sale attempts; this cycle's ask has dropped $10k (8%) from the opening price — seller is motivated, your offer sets the floor, not the list.
- Current owner paid $40k; list at $110k implies a 175% gain — meaningful room to come down on a strong offer.
Risks & watch-outs
- Watch-outs: built in 1935 — expect roof / HVAC / electrical / plumbing capex.
Questions for the listing agent
- It's been on market 74 days. Have you received any prior offers? Is the seller open to a 6% concession, seller financing, or rate buy-down credit?
- Can we see the unit-by-unit rent roll, current vacancy, and any below-market leases? What's the average tenancy length?
- What capital expenditures (roof, boiler, parking lot, exteriors) have been made in the last 5 years, and what's planned in the next 2?
- Built in 1935 — when were the roof, HVAC, electrical panel, plumbing, and water heater last replaced?
- Why hasn't it sold? Are there any deal-killer items the seller is aware of (foundation, flood, title, zoning, code violations)?
- Is there a deadline driving the sale (1031 exchange, divorce, estate, relocation)? That informs how much negotiation room exists.
- Schools are D-rated, which usually means shorter tenancies and higher turnover. Who's the typical renter profile here, and what's been the actual vacancy rate?
- Crime grade is F in this area — have there been break-ins, vandalism, or insurance claims at this property in the last 3 years? What carrier currently insures it and at what premium?
- What's the average days-on-market for RENTAL listings here right now (not sales)? A rising rental-DOM trend means longer vacancies and softer asking-rent achievability than the comps imply.
- What's the recent tenant-quality profile in this submarket — average credit score on applications, eviction rate, late-payment / NSF rate, and stable-employment percentage? A property-management company in the area should have these aggregated.
- How much new apartment / multifamily construction is in the pipeline within 1–3 miles? Heavy new supply (>2% of stock underway) typically softens rents 12–24 months out; light construction supports rent growth.
Investment metrics
- 1% rule
- 2.69% ✓
- Cap rate
- 22.73%
- Cash-on-cash
- 58.70%
- DSCR
- 3.61
- GRM
- 3.1
CMA / ARV
No comps found within radius.
Projected returns pro-forma
-3.0% appreciation · 3.0% rent growth · sell at horizon
- IRR
- 57.3%
- Equity multiple
- 3.54×
- Total profit
- $78,226
- Equity at exit
- $16,401
- IRR
- 62.2%
- Equity multiple
- 7.24×
- Total profit
- $192,043
- Equity at exit
- $9,511
Cash invested: $30,800 (down + closing). Projections, not guarantees.
Landlord ↔ Tenant lean methodology
- Overall (STATE)
- 62 Landlord-Friendly
- State Michigan
- 62 Landlord-Friendly · EVEN
- County
- — inherits STATE
- City
- — inherits STATE
ZIP-level market 49444
- Active inventory
- 239
- Price-to-rent
- 10.2×
Monthly cashflow live
- Estimated rent
- $2,960 high interval (Pro) →
- Mortgage (P&I)
- −$577
- Tax from tax record
- −$209 /mo · $2,508/yr
- Insurance
- −$46
- HOA
- −$0
- Vacancy / Maint / Mgmt
- −$622
- Net cashflow
- $1,507
Break-even live
Sensitivity live
| Price | -10% $1,569 | -5% $1,538 | +0% $1,507 | +5% $1,476 | +10% $1,444 |
|---|---|---|---|---|---|
| Rent | -10% $1,273 | -5% $1,390 | +0% $1,507 | +5% $1,624 | +10% $1,741 |
| Rate | -1.0pp $1,562 | -0.5pp $1,535 | base $1,507 | +0.5pp $1,478 | +1.0pp $1,449 |
3-unit breakdown (identical units grouped — click to expand)
| Units | Beds | Baths | Est. rent |
|---|---|---|---|
| 2× units | 2 | 1 | $1,804 |
| #1 | 2 | 1 | $902 |
| #2 | 2 | 1 | $902 |
| 1× unit | 3 | 1 | $1,156 |
| Total (3 units) | $2,960 | ||
UW: 25.0% down · 7.5% · 30yr · 1.5% tax · 5.0% vac · 8.0% maint · 8.0% mgmt
Financing live
Cash to close
- Down payment
- $27,500
- Closing costs
- $3,300
- Reserves months
- —
- Total cash needed
- —
Loan-product check · same deal, 3 products live
Conventional
25% down · 7.5% · 30yr
- Down + closing
- —
- Monthly P&I
- —
- Monthly cashflow
- —
- DSCR
- —
- Eligible?
- —
Personal DTI + credit; lowest rate.
DSCR
20% down · 8.5% · 30yr
- Down + closing
- —
- Monthly P&I
- —
- Monthly cashflow
- —
- DSCR
- —
- Eligible?
- —
No personal income docs; deal must DSCR.
Hard money
10% down · 12.0% · 12mo
- Down + closing
- —
- Monthly P&I
- —
- Monthly cashflow
- —
- DSCR
- —
- Eligible?
- —
Short-term bridge; refi at stabilization.
Listing history 15 events
-
2026-06-15status $110,000 Pending 74 DOM
-
2026-06-15days on market $110,000 Active 74 DOM
-
2026-06-14days on market $110,000 Active 72 DOM
-
2026-06-13days on market $110,000 Active 71 DOM
-
2026-06-10days on market $110,000 Active 69 DOM
-
2026-06-09days on market $110,000 Active 68 DOM
-
2026-06-08days on market $110,000 Active 67 DOM
-
2026-06-07statusdays on market $110,000 Active 66 DOM
-
2026-04-02status Pending 552-char remark
Show marketing remark (552 chars)
Welcome to 2505 Jefferson Street, Muskegon Heights, MI 49444, a well-maintained multi-family triplex. The property consists of three separate units and includes a detached garage, offering added functionality and value. Unit 1 features two bedrooms and one bathroom, Unit 2 offers one bedroom and one bathroom, and Unit 3 includes three bedrooms and one bathroom with a designated laundry area. Significant capital improvements have been completed, including a new roof, updated electrical system, a new boiler system, and updated water lines with PEX.
-
2026-04-02status Pending
Show marketing remark (552 chars)
Welcome to 2505 Jefferson Street, Muskegon Heights, MI 49444, a well-maintained multi-family triplex. The property consists of three separate units and includes a detached garage, offering added functionality and value. Unit 1 features two bedrooms and one bathroom, Unit 2 offers one bedroom and one bathroom, and Unit 3 includes three bedrooms and one bathroom with a designated laundry area. Significant capital improvements have been completed, including a new roof, updated electrical system, a new boiler system, and updated water lines with PEX.
-
2026-02-18price $110,000 552-char remark
Show marketing remark (552 chars)
Welcome to 2505 Jefferson Street, Muskegon Heights, MI 49444, a well-maintained multi-family triplex. The property consists of three separate units and includes a detached garage, offering added functionality and value. Unit 1 features two bedrooms and one bathroom, Unit 2 offers one bedroom and one bathroom, and Unit 3 includes three bedrooms and one bathroom with a designated laundry area. Significant capital improvements have been completed, including a new roof, updated electrical system, a new boiler system, and updated water lines with PEX.
-
2026-02-17price $110,000
-
2026-01-28$120,000 Active 552-char remark
Show marketing remark (552 chars)
Welcome to 2505 Jefferson Street, Muskegon Heights, MI 49444, a well-maintained multi-family triplex. The property consists of three separate units and includes a detached garage, offering added functionality and value. Unit 1 features two bedrooms and one bathroom, Unit 2 offers one bedroom and one bathroom, and Unit 3 includes three bedrooms and one bathroom with a designated laundry area. Significant capital improvements have been completed, including a new roof, updated electrical system, a new boiler system, and updated water lines with PEX.
-
2026-01-28$120,000 Active
Show marketing remark (552 chars)
Welcome to 2505 Jefferson Street, Muskegon Heights, MI 49444, a well-maintained multi-family triplex. The property consists of three separate units and includes a detached garage, offering added functionality and value. Unit 1 features two bedrooms and one bathroom, Unit 2 offers one bedroom and one bathroom, and Unit 3 includes three bedrooms and one bathroom with a designated laundry area. Significant capital improvements have been completed, including a new roof, updated electrical system, a new boiler system, and updated water lines with PEX.
-
2004-06-22soldstatus $40,000
ⓘ Source: listings_history table (triggers on properties + properties_extension) + one-shot
backfill from property_details.listing_events for pre-trigger history.
Tax reassessment forecast MI · Partial reset (capped growth)
- Current annual tax
- $2,508 · $209/mo
- Projected year-2 tax
- $2,508 · $209/mo
- Expected delta
- $0/yr ($0/mo · 0.0%)
ⓘ Screening estimate from a state-policy table — verify with the county assessor before closing.
Climate risk First Street
- Flood 1/10 Low FEMA zone X (unshaded) · 0% chance over 30 yrs
- Wildfire 1/10 Low
- Heat 2/10 Low 7 d/yr ≥93°F today · 15 d/yr by 30 yrs out
- Wind 1/10 Low
- Air quality 4/10 Moderate 4 unhealthy d/yr today · 6 by 30 yrs out
Nearby sold comps map
Loading sold comps map…
Walkable amenities ~0.75 mi
Loading nearby amenities…
Taxation est. · year 1
- Rental income
- $35,520
- − Mortgage interest
- −$6,162
- − Property taxes
- −$2,508
- − Insurance
- −$550
- − Repairs & maintenance
- −$2,842
- − Management
- −$2,842
- − Depreciation
- −$3,200
- Taxable income
- $17,417
- Est. tax owed @ 24.0%
- −$4,180
- After-tax cash flow
- $13,900/yr
For passive investors: Depreciation is non-cash, so a rental often shows a tax loss while cash-flowing — sheltering income. Rental losses are passive: they offset passive income freely, and up to $25,000/yr can offset ordinary (W-2) income if you actively participate and your MAGI is under $100k (phasing out to $0 by $150k); unused losses carry forward. On sale, claimed depreciation is recaptured at up to 25%, and gains may owe capital-gains tax (a 1031 exchange can defer both). Figures are a year-1 estimate at your 24.0% rate — not tax advice; consult a CPA.
Schools (NCES district)
No district data.
Livability — Muskegon Heights
- Score
- 61/100
- State rank
- #574
- US rank
- #18269
Category grades
Schools grade is shown separately in the Schools card above.
Census & demographics
- Census place
- Muskegon Heights, MI
- County
- Muskegon County · 107,917 people
- Metro
- Muskegon, MI
- Population (ZIP)
- 26,372
- Household income
- $53,054
- Rent vs Own
- Severe rent burden
- 930.0
Population outlook (Muskegon County) Hauer SSP2
- Today (2025)
- 174,032 people
- By 2030
- 173,365 · -0.4%
- By 2040
- 168,877 · -3.0%
- By 2050
- 160,306 · -7.9%
- By 2075
- 134,426 · -22.8%
- By 2100
- 98,836 · -43.2%
Race, ethnicity, and origin ACS 2023
- Neighborhood character
- Diverse neighborhood (Simpson 0.55)
- Race & ethnicity
- White 59% Black 31% Two or more races 6% Hispanic / Latino 4% Native American 1%
- Common ancestry
- Iranian 6% Romanian 4% Lithuanian 2%
- Foreign-born
- 1% · Canada
- Languages at home
- 97% English-only · Spanish 2%
Political lean MEDSL · Muskegon
- 2024 margin
- Toss-up / Even · D 48.4% · R 50.2% · Other 1.5%
- 2008→2024 swing
- -31.1pp toward R · 2008: 29.3pp · 2024: -1.8pp
- All cycles
- 2024: R+1.8 2020: D+0.6 2016: D+0.9 2012: D+17.8 2008: D+29.3
Not yet ingested
- Civics
- —
Market trends
- HPI YoY
- ▼ -150.02%
- Current HPI
- 209.2698
- Rent YoY
- —
- Metro
- Muskegon, MI
- State GDP YoY
- ▲ 1.37%
- F500 in state
- 28
Industry mix (Fortune 500 HQ in MI)
| Industry | F500 HQs | Revenue |
|---|---|---|
| Automotive Parts | 3 | $48B |
|
||
| Automotive | 2 | $372B |
|
||
| Chemicals | 1 | $45B |
|
||
| Automotive Retail | 1 | $29B |
|
||
| Healthcare / Medical Devices | 1 | $23B |
|
||
| Automotive Technology | 1 | $20B |
|
||
Price history
+175.0% since first listed7 events — show timeline
- 2026-04-02 Pending — MiRealSource-MiMLS
- 2026-04-02 Pending — REALCOMP
- 2026-02-18 Price Changed $110,000 MiRealSource-MiMLS
- 2026-02-17 Price Changed $110,000 REALCOMP
- 2026-01-28 Listed $120,000 REALCOMP
- 2026-01-28 Listed $120,000 MiRealSource-MiMLS
- 2004-06-22 Sold (Public Records) $40,000 Public Records
Property tax history
+5.4%/yrLatest (2025): $2,508 · +2.8% YoY. Source: county tax records.
Cash-flow waterfall
monthlySold comps — $/sqft
last 12 mo · ≤1 miLoading sold comps…