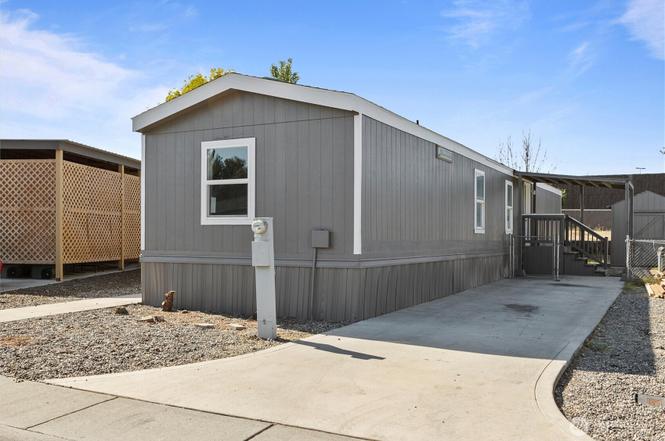
681 Lonetree Ln · Richland, WA
Flood risk 1/10 · Minimal
- FEMA flood zone
- X
- Chance of flooding over 30 yrs
- 0.0%
- Est. flood insurance / yr
- $473 – $860
Fire risk 5/10 · Moderate
- Est. fire insurance / yr
- $604 – $1,122
Heat risk 5/10 · Moderate
- Hot days now (above 99°F)
- 7 days/yr
- Hot days in 30 yrs
- 15 days/yr
Wind risk 1/10 · Minimal
- Chance of severe wind over 30 yrs
- —
Air-quality risk 7/10 · Major
- Unhealthy air days now
- 11 days/yr
- Unhealthy air days in 30 yrs
- 12 days/yr
Risk factors via First Street. Map © Google.
Why this score? — see what drove the B- grade
The composite is a weighted blend of 9 inputs, each scored 0–100. Each bar is that input's sub-score; the figure is the points it added to the 100-point composite (weight × sub-score).
- Cash flow +30.0/30.0
- 1% rule +10.0/10.0
- DSCR +10.0/10.0
- Schools +5.3/10.0
- ARV discount +4.8/15.0
- Livability +4.0/5.0
- Rent growth +2.9/5.0
- Condition / age +2.5/5.0
- Appreciation +0.0/10.0
$95,000
🖨 Deal sheet (PDF) 📄 Offer letter ✓ Due diligence
Listing remarks MLS
Well taken care of home with large rooms . Nicely landscaped and back yard is fully fenced. Large storage shed comes ith home. Inside home has vaulted ceilings lots of cabinet space. All appliances come with home. Master bedroom has large walkin closet and master bathroom hsa double sinksd g anarden tub. New carpet throughout. home iin greats ocation nealr soppingg.
Key facts
- Well-maintained pool
- Fenced yard
- New appliances
Tags
Neighborhood map
What this means for you Summary
Snapshot
- This is a 2-bed/2.0-bath manufactured listed at $95k.
Deal economics
- At list price, monthly cash flow is $816 ($10k/yr) — positive.
- The deal already cash-flows at list — no discount required.
- Meets the 1% rule at list price ($2k rent vs $95k).
- Recommended offer: $84k (12.0% below list) — sets the bar for market timing.
- Cap rate 16.6% vs local median 2.8% in Richland — top-decile yield for the area; either an underpriced asset or a hidden risk that comps aren't pricing in. Stress-test before assuming the spread holds.
Location & tenants
- Location reads 79/100 on livability (#112 in WA, #2,258 nationally) — a middle-class / working-renter tenant base. Strengths: commute A+, housing A+, health & safety A+; Watch: cost of living C-, amenities F.
- Richland School District (urban): math 52% / reading 64% proficiency, ranked #61 of 291 in WA (top 21%) — acceptable for families but not a draw, mixed tenant base, ~2y average lease.
- Market conditions: Rents rising (+1.6%/yr); 544 active listings in the ZIP; 7 comparable units currently listed for rent nearby; rentals at typical pace (median 15d on market — plan ~3-4 weeks tenant-placement turnaround); solid renter incomes; 1,532 units permitted in Benton County in 2024 (389 in 5+ unit buildings).
Forward outlook
- Local home prices are declining (-3.0%/yr); year-one equity from $657 of loan paydown is wiped out by about $3k of value loss. Plan a longer hold.
- Benton County population projected at +32% by 2050 — long-run rental-demand tailwind backs the buy-and-hold thesis.
- At projected returns (-3.0% appreciation + 1.6% rent growth), your $27k cash investment doubles in ~4 years — after that, you're playing with house money.
Negotiation context
- It's been on market 177 days — a 12% lower offer ($84k) is reasonable based on typical stale-listing flexibility.
- 3 sale attempts since 16y ago; this cycle's ask has dropped $20k (17%) from the opening price — seller is motivated, your offer sets the floor, not the list.
- Current owner paid $23k; list at $95k implies a 315% gain — meaningful room to come down on a strong offer.
Risks & watch-outs
- Climate carrying-cost: moderate wildfire risk; extreme-heat days projected 7→15/yr by 2055 (HVAC capex compounding) — expect insurance premiums to compound above CPI over the hold.
Questions for the listing agent
- It's been on market 177 days. Have you received any prior offers? Is the seller open to a 12% concession, seller financing, or rate buy-down credit?
- Why hasn't it sold? Are there any deal-killer items the seller is aware of (foundation, flood, title, zoning, code violations)?
- Is there a deadline driving the sale (1031 exchange, divorce, estate, relocation)? That informs how much negotiation room exists.
- Schools are A-rated — typically a magnet for longer-tenancy family renters. What's the average tenant stay here, and is there a school-zone premium baked into asking?
- What's the average days-on-market for RENTAL listings here right now (not sales)? A rising rental-DOM trend means longer vacancies and softer asking-rent achievability than the comps imply.
- What's the recent tenant-quality profile in this submarket — average credit score on applications, eviction rate, late-payment / NSF rate, and stable-employment percentage? A property-management company in the area should have these aggregated.
- How much new for-sale + rental construction is in the pipeline within 1–3 miles? Heavy new supply typically softens prices + rents 12–24 months out; constrained supply supports both.
Investment metrics
- 1% rule
- 1.83% ✓
- Cap rate
- 16.60%
- Cash-on-cash
- 36.81%
- DSCR
- 2.64
- GRM
- 4.6
CMA / ARV
- ARV (on-the-fly)
- $89,600
- Comps found
- 4
Show comp detail 4 sales within ~0.75 mi
| Address | Dist | Beds/Ba | Sqft | Sold | Price | $/sf | Match |
|---|---|---|---|---|---|---|---|
| 681 Lonetree Ln | 0.00mi | 2/2.0 | 896 (0%) | 1mo | $90,000 | $100 | 99 |
| 677 Lonetree Ln | 0.01mi | 2/2.0 | 938 (+5%) | 4mo | $99,000 | $106 | 89 |
| 229 Crestwood Dr | 0.15mi | 2/1.0 | 924 (+3%) | 21mo | $85,000 | $92 | 66 |
| 99 Skyline Dr | 0.25mi | 2/1.0 | 938 (+5%) | 14mo | $36,000 | $38 | 65 |
Match score weights: distance 35% · size 25% · config 20% · recency 20%. Top-matched comps best support the ARV.
Projected returns pro-forma
-3.0% appreciation · 1.6% rent growth · sell at horizon
- IRR
- 31.1%
- Equity multiple
- 2.28×
- Total profit
- $34,130
- Equity at exit
- $14,165
- IRR
- 37.6%
- Equity multiple
- 4.27×
- Total profit
- $86,867
- Equity at exit
- $8,214
Cash invested: $26,600 (down + closing). Projections, not guarantees.
Landlord ↔ Tenant lean methodology
- Overall (STATE)
- 28 Tenant-Leaning
- State Washington
- 28 Tenant-Leaning · D+8
- County
- — inherits STATE
- City
- — inherits STATE
ZIP-level market 99352
- Rents YoY
- 1.6%
- Active inventory
- 544
- Price-to-rent
- 4.6×
Monthly cashflow live
- Estimated rent
- $1,739 high interval (Pro) →
- Mortgage (P&I)
- −$498
- Tax from tax record
- −$20 /mo · $239/yr
- Insurance
- −$40
- HOA
- −$0
- Vacancy / Maint / Mgmt
- −$365
- Net cashflow
- $816
Break-even live
Sensitivity live
| Price | -10% $870 | -5% $843 | +0% $816 | +5% $789 | +10% $762 |
|---|---|---|---|---|---|
| Rent | -10% $679 | -5% $747 | +0% $816 | +5% $885 | +10% $953 |
| Rate | -1.0pp $864 | -0.5pp $840 | base $816 | +0.5pp $791 | +1.0pp $766 |
UW: 25.0% down · 7.5% · 30yr · 1.5% tax · 5.0% vac · 8.0% maint · 8.0% mgmt
Financing live
Cash to close
- Down payment
- $23,750
- Closing costs
- $2,850
- Reserves months
- —
- Total cash needed
- —
Loan-product check · same deal, 3 products live
Conventional
25% down · 7.5% · 30yr
- Down + closing
- —
- Monthly P&I
- —
- Monthly cashflow
- —
- DSCR
- —
- Eligible?
- —
Personal DTI + credit; lowest rate.
DSCR
20% down · 8.5% · 30yr
- Down + closing
- —
- Monthly P&I
- —
- Monthly cashflow
- —
- DSCR
- —
- Eligible?
- —
No personal income docs; deal must DSCR.
Hard money
10% down · 12.0% · 12mo
- Down + closing
- —
- Monthly P&I
- —
- Monthly cashflow
- —
- DSCR
- —
- Eligible?
- —
Short-term bridge; refi at stabilization.
Rent comps 7 comps
| Address | Beds | Baths | Sqft | Rent | $/sqft | DOM | Units | Dist |
|---|---|---|---|---|---|---|---|---|
| 3003 Queensgate Dr Richland, WA | 3.0 | 1.0–2.5 | 931 | $1,810 | $1.94 | 14d | 21 | 0.38mi |
| 2550 Duportail St Richland, WA | 1.0–3.0 | 1.0–2.0 | 980 | $1,718 | $1.75 | 14d | 15 | 0.44mi |
| 501 Wright Ave Apt 1 Richland, WA | 2.0 | 2.5 | 1114 | $1,450 | $1.30 | 22d | 1 | 0.92mi |
| 1043 Tartarian Ave Richland, WA | 2.0–3.0 | 2.0 | 1147 | $2,024 | $1.76 | 14d | 20 | 1.09mi |
| 810 Wright Ave Richland, WA | 2.0 | 1.0 | 900 | $1,800 | $2.00 | 44d | 1 | 1.27mi |
| 900 Aaron Dr Richland, WA | 1.0–2.0 | 1.0–2.0 | 824 | $1,599 | $1.94 | 14d | 6 | 1.36mi |
| 850 Aaron Dr Richland, WA | 1.0–2.0 | 1.0 | 825 | $1,399 | $1.70 | 14d | 5 | 1.45mi |
Listing history 8 events
-
2026-03-28status Pending
-
2026-03-27price $95,000
-
2025-10-10price $99,900
-
2025-10-01$114,900 Active
-
2011-10-04soldstatus $22,900 369-char remark
Show marketing remark (369 chars)
Well taken care of home with large rooms . Nicely landscaped and back yard is fully fenced. Large storage shed comes ith home. Inside home has vaulted ceilings lots of cabinet space. All appliances come with home. Master bedroom has large walkin closet and master bathroom hsa double sinksd g anarden tub. New carpet throughout. home iin greats ocation nealr soppingg.
-
2011-06-05$24,000 369-char remark
Show marketing remark (369 chars)
Well taken care of home with large rooms . Nicely landscaped and back yard is fully fenced. Large storage shed comes ith home. Inside home has vaulted ceilings lots of cabinet space. All appliances come with home. Master bedroom has large walkin closet and master bathroom hsa double sinksd g anarden tub. New carpet throughout. home iin greats ocation nealr soppingg.
-
2010-06-29soldstatus $24,000 431-char remark
Show marketing remark (431 chars)
Nice well kept home in good location. Home comes with all appliances and washer and dryer. Home also comes with lawn mower and lawn tools. Roof is only 5 years old. Many rooms have been recently painted. New linolium in kitchen. Ceiling fans, wood blinds, cabinets in laundry room. Yard is well taken care of with garden area. Master bathroom has walkin shower and garden tub. Home also has new toilets, and upgraded sink fixtures.
-
2010-03-16$26,900 431-char remark
Show marketing remark (431 chars)
Nice well kept home in good location. Home comes with all appliances and washer and dryer. Home also comes with lawn mower and lawn tools. Roof is only 5 years old. Many rooms have been recently painted. New linolium in kitchen. Ceiling fans, wood blinds, cabinets in laundry room. Yard is well taken care of with garden area. Master bathroom has walkin shower and garden tub. Home also has new toilets, and upgraded sink fixtures.
ⓘ Source: listings_history table (triggers on properties + properties_extension) + one-shot
backfill from property_details.listing_events for pre-trigger history.
Tax reassessment forecast WA · Resets to sale price
- Current annual tax
- $239 · $20/mo
- Projected year-2 tax
- $931 · $78/mo
- Expected delta
- +$692/yr (+$58/mo · 289.9%)
ⓘ Screening estimate from a state-policy table — verify with the county assessor before closing.
Climate risk First Street
- Flood 1/10 Low FEMA zone X · 0% chance over 30 yrs
- Wildfire 5/10 Major
- Heat 5/10 Major 7 d/yr ≥99°F today · 15 d/yr by 30 yrs out
- Wind 1/10 Low
- Air quality 7/10 Severe 11 unhealthy d/yr today · 12 by 30 yrs out
Nearby sold comps map
Loading sold comps map…
Walkable amenities ~0.75 mi
Loading nearby amenities…
Taxation est. · year 1
- Rental income
- $20,867
- − Mortgage interest
- −$5,321
- − Property taxes
- −$239
- − Insurance
- −$475
- − Repairs & maintenance
- −$1,669
- − Management
- −$1,669
- − Depreciation
- −$2,764
- Taxable income
- $8,729
- Est. tax owed @ 24.0%
- −$2,095
- After-tax cash flow
- $7,698/yr
For passive investors: Depreciation is non-cash, so a rental often shows a tax loss while cash-flowing — sheltering income. Rental losses are passive: they offset passive income freely, and up to $25,000/yr can offset ordinary (W-2) income if you actively participate and your MAGI is under $100k (phasing out to $0 by $150k); unused losses carry forward. On sale, claimed depreciation is recaptured at up to 25%, and gains may owe capital-gains tax (a 1031 exchange can defer both). Figures are a year-1 estimate at your 24.0% rate — not tax advice; consult a CPA.
Schools (NCES district)
- District
- Richland School District
- NCES district ID
- 5307320
- Math proficiency
- 52% ▬ 0.00%
- Reading proficiency
- 64% ▼ -1.00%
- Median HH income
- $70,475
- Composite
- 53.04/100
- National rank
- #3244
- State rank
- #61 of 291 in WA
Livability — Richland
- Score
- 79/100
- State rank
- #112
- US rank
- #2258
Category grades
Schools grade is shown separately in the Schools card above.
Census & demographics
- Census place
- Richland, WA
- County
- Benton County · 186,895 people
- City population
- 62,989
- Metro
- Kennewick-Richland, WA
- Population (ZIP)
- 37,430
- Household income
- $100,108
- Rent vs Own
- Severe rent burden
- 983.0
Population outlook (Benton County) Hauer SSP2
- Today (2025)
- 219,421 people
- By 2030
- 233,813 · +6.6%
- By 2040
- 262,134 · +19.5%
- By 2050
- 290,100 · +32.2%
- By 2075
- 363,525 · +65.7%
- By 2100
- 418,667 · +90.8%
Race, ethnicity, and origin ACS 2023
- Neighborhood character
- Predominantly White (73%)
- Race & ethnicity
- White 73% Hispanic / Latino 14% Two or more races 10% Asian 7% Black 2%
- Hispanic origin (detail)
- Mexican 11%
- Common ancestry
- Italian 4% Portuguese 4% Slovak 3%
- Foreign-born
- 9% · Canada, South Korea, China
- Languages at home
- 88% English-only · Spanish 4% Other Indo-European 3% Korean 1%
Political lean MEDSL · Benton
- 2024 margin
- Strong R (+21.9) · D 37.7% · R 59.6% · Other 2.7%
- 2008→2024 swing
- +4.2pp toward D · 2008: -26.1pp · 2024: -21.9pp
- All cycles
- 2024: R+21.9 2020: R+21.0 2016: R+26.6 2012: R+27.0 2008: R+26.1
Not yet ingested
- Civics
- —
Market trends
- HPI YoY
- ▼ -323.81%
- Current HPI
- 217.3435
- Rent YoY
- ▲ 1.60%
- Metro
- Kennewick-Richland, WA
- State GDP YoY
- ▲ 4.65%
- F500 in state
- 22
Industry mix (Fortune 500 HQ in WA)
| Industry | F500 HQs | Revenue |
|---|---|---|
| Retail | 2 | $269B |
|
||
| Technology / Retail | 1 | $638B |
|
||
| Technology | 1 | $245B |
|
||
| Telecommunications | 1 | $38B |
|
||
| Food / Beverage | 1 | $36B |
|
||
| Automotive / Trucks | 1 | $34B |
|
||
Price history
+253.2% since first listed8 events — show timeline
- 2026-03-28 Pending — NWMLS as Distributed by MLS Grid
- 2026-03-27 Price Changed $95,000 NWMLS as Distributed by MLS Grid
- 2025-10-10 Price Changed $99,900 NWMLS as Distributed by MLS Grid
- 2025-10-01 Listed $114,900 NWMLS as Distributed by MLS Grid
- 2011-10-04 Sold (MLS) $22,900 PACMLS
- 2011-06-05 Listed $24,000 PACMLS
- 2010-06-29 Sold (MLS) $24,000 PACMLS
- 2010-03-16 Listed $26,900 PACMLS
Property tax history
+1.2%/yrLatest (2026): $239 · +99.7% YoY. Source: county tax records.
Cash-flow waterfall
monthlySold comps — $/sqft
last 12 mo · ≤1 miLoading sold comps…