1601 N College Ave #5 · Fort Collins, CO
Flood risk 1/10 · Minimal
- FEMA flood zone
- X (unshaded)
- Chance of flooding over 30 yrs
- 0.0%
- Est. flood insurance / yr
- $507 – $1,088
Fire risk 3/10 · Minor
- Est. fire insurance / yr
- $939 – $1,743
Heat risk 3/10 · Minor
- Hot days now (above 91°F)
- 7 days/yr
- Hot days in 30 yrs
- 18 days/yr
Wind risk 1/10 · Minimal
- Chance of severe wind over 30 yrs
- —
Air-quality risk 6/10 · Moderate
- Unhealthy air days now
- 13 days/yr
- Unhealthy air days in 30 yrs
- 13 days/yr
Risk factors via First Street. Map © Google.
Why this score? — see what drove the C+ grade
The composite is a weighted blend of 9 inputs, each scored 0–100. Each bar is that input's sub-score; the figure is the points it added to the 100-point composite (weight × sub-score).
- Cash flow +30.0/30.0
- 1% rule +10.0/10.0
- DSCR +10.0/10.0
- Schools +4.5/10.0
- Livability +4.0/5.0
- Rent growth +3.5/5.0
- Condition / age +2.5/5.0
- ARV discount +0.0/15.0
- Appreciation +0.0/10.0
$75,000
🖨 Deal sheet 📄 Offer letter ✓ Due diligence
Listing remarks
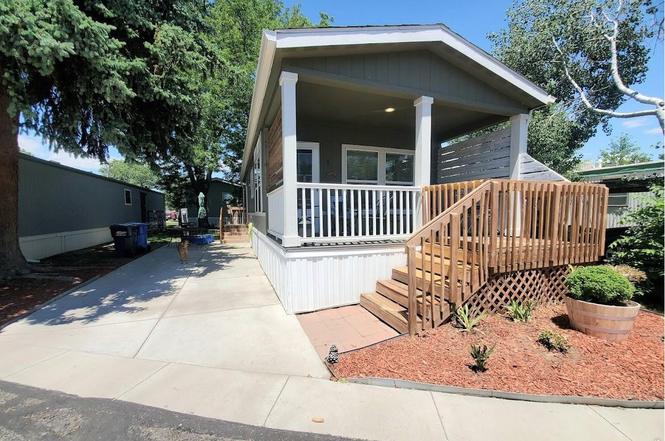
Are you ready to experience all the peace of mind that a nearly new home can offer? Everything is so new, so there should be nothing to do! Fantastic, gated 55 and over community with lot rent of just $1150 per month, with water and sewer included! First park in your nice and shady spots out front on your private driveway. Then you enter through the front covered porch, complete with easy to maintain composite decking. Once you open the front door you discover a GREAT open layout in the living area that can accommodate most any furniture arrangement. Kitchen boasts a peninsula with overhang for seating, loads of cabinets and counter top space, and nice black and stainless kitchen appliances
Key facts
- Gated community
- Covered porch
- Private driveway
Tags
Property features AI
Finance
- Other: Minimal flood risk (C rating)
- HOA & community: No association fees
Exterior
- Parking: No garage; No designated parking features
- Utilities: City water with meter installed; Public sewer; Natural gas available (Xcel); Electricity available; Cable and satellite available; High-speed internet available; Underground utilities; Private trash service
- Home design: Manufactured in park; Manufactured home; Level lot entry; Southern exposure
- Construction: Frame construction; Composition siding; Composition roof
- Exterior features: Patio; Deck; Land lease; Evergreen and deciduous trees; Level lot; House faces south; Within city limits; Paved surfaces with gutters, sidewalks, and street lights; Privately maintained road to county standards
Interior
- Kitchen: Gas range; Dishwasher; Refrigerator; Microwave
- Bedrooms: 1 bedroom
- Bathrooms: One three-quarter bathroom
- Heating & cooling: Forced air heating; Central air conditioning
- Interior features: Eat-in kitchen; Open floor plan; Window coverings
- Laundry & utility: Washer; Dryer
Neighborhood map
What this means for you Summary
Snapshot
- This is a 2-bed/1.0-bath manufactured listed at $75k.
Deal economics
- At list price, monthly cash flow is $978 ($12k/yr) — positive.
- The deal already cash-flows at list — no discount required.
- Meets the 1% rule at list price ($2k rent vs $75k).
- Cap rate 21.9% vs local median 2.6% in Fort Collins — top-decile yield for the area; either an underpriced asset or a hidden risk that comps aren't pricing in. Stress-test before assuming the spread holds.
Location & tenants
- Location reads 80/100 on livability (#11 in CO, #1,750 nationally) — a professional / high-income tenant draw. Strengths: amenities A+, commute A+, health & safety A+; Watch: cost of living F.
- Poudre School District R-1 (urban): math 45% / reading 60% proficiency, ranked #10 of 86 in CO (top 12%) — acceptable for families but not a draw, mixed tenant base, ~2y average lease.
- Market conditions: Rents rising fast (+4.1%/yr); 422 active listings in the ZIP; 8 comparable units currently listed for rent nearby; rentals at typical pace (median 21d on market — plan ~3-4 weeks tenant-placement turnaround); solid renter incomes; 1,786 units permitted in Larimer County in 2024 (402 in 5+ unit buildings).
Forward outlook
- Local home prices are declining (-3.0%/yr); year-one equity from $519 of loan paydown is wiped out by about $2k of value loss. Plan a longer hold.
- Larimer County population projected at +51% by 2050 — long-run rental-demand tailwind backs the buy-and-hold thesis.
- At projected returns (-3.0% appreciation + 4.1% rent growth), your $21k cash investment doubles in ~3 years — after that, you're playing with house money.
Negotiation context
- Only 1 days on market — expect competitive offers; lowballing is unlikely to land.
- 4 sale attempts since 4y ago with the ask held roughly flat each time — persistent listings suggest the price (not the market) is what's stuck; bring a comps-based counter.
Questions for the listing agent
- Is there a deadline driving the sale (1031 exchange, divorce, estate, relocation)? That informs how much negotiation room exists.
- Schools are B-rated — typically a magnet for longer-tenancy family renters. What's the average tenant stay here, and is there a school-zone premium baked into asking?
- What's the average days-on-market for RENTAL listings here right now (not sales)? A rising rental-DOM trend means longer vacancies and softer asking-rent achievability than the comps imply.
- What's the recent tenant-quality profile in this submarket — average credit score on applications, eviction rate, late-payment / NSF rate, and stable-employment percentage? A property-management company in the area should have these aggregated.
- How much new for-sale + rental construction is in the pipeline within 1–3 miles? Heavy new supply typically softens prices + rents 12–24 months out; constrained supply supports both.
Investment metrics
- 1% rule
- 2.42% ✓
- Cap rate
- 21.95%
- Cash-on-cash
- 55.91%
- DSCR
- 3.49
- GRM
- 3.4
CMA / ARV
- ARV (on-the-fly)
- $63,360
- Comps found
- 2
Show comp detail 2 sales within ~0.75 mi
| Address | Dist | Beds/Ba | Sqft | Sold | Price | $/sf | Match |
|---|---|---|---|---|---|---|---|
| 1601 N College Ave #2 | 0.00mi | 2/1.0 | 644 (+1%) | 12mo | $64,000 | $99 | 89 |
| 1601 N College Ave #134 | 0.00mi | 2/1.0 | 728 (+14%) | 9mo | $26,500 | $36 | 70 |
Match score weights: distance 35% · size 25% · config 20% · recency 20%. Top-matched comps best support the ARV.
Projected returns pro-forma
-3.0% appreciation · 4.13% rent growth · sell at horizon
- IRR
- 55.5%
- Equity multiple
- 3.49×
- Total profit
- $52,237
- Equity at exit
- $11,183
- IRR
- 60.9%
- Equity multiple
- 7.40×
- Total profit
- $134,442
- Equity at exit
- $6,485
Cash invested: $21,000 (down + closing). Projections, not guarantees.
Landlord ↔ Tenant lean methodology
- Overall (STATE)
- 38 Tenant-Leaning
- State Colorado
- 38 Tenant-Leaning · D+4
- County
- — inherits STATE
- City
- — inherits STATE
ZIP-level market 80524
- Rents YoY
- 4.1%
- Active inventory
- 422
- Price-to-rent
- 3.4×
Monthly cashflow live
- Estimated rent
- $1,815 high interval (Pro) →
- Mortgage (P&I)
- −$393
- Tax from tax record
- −$31 /mo · $366/yr
- Insurance
- −$31
- HOA
- −$0
- Vacancy / Maint / Mgmt
- −$381
- Net cashflow
- $978
Break-even live
UW: 25.0% down · 7.5% · 30yr · 1.5% tax · 5.0% vac · 8.0% maint · 8.0% mgmt
Financing live
Cash to close
- Down payment
- $18,750
- Closing costs
- $2,250
- Reserves months
- —
- Total cash needed
- —
Loan-product check · same deal, 3 products live
Conventional
25% down · 7.5% · 30yr
- Down + closing
- —
- Monthly P&I
- —
- Monthly cashflow
- —
- DSCR
- —
- Eligible?
- —
Personal DTI + credit; lowest rate.
DSCR
20% down · 8.5% · 30yr
- Down + closing
- —
- Monthly P&I
- —
- Monthly cashflow
- —
- DSCR
- —
- Eligible?
- —
No personal income docs; deal must DSCR.
Hard money
10% down · 12.0% · 12mo
- Down + closing
- —
- Monthly P&I
- —
- Monthly cashflow
- —
- DSCR
- —
- Eligible?
- —
Short-term bridge; refi at stabilization.
Rent comps 8 comps
| Address | Beds | Baths | Sqft | Rent | $/sqft | DOM | Units | Dist |
|---|---|---|---|---|---|---|---|---|
| 1713 Aspen St Fort Collins, CO | 1.0 | 1.0 | 660 | $1,500 | $2.27 | 21d | 1 | 0.26mi |
| 311 N Mason St Fort Collins, CO | 2.0 | 1.0–2.0 | 645 | $2,115 | $3.28 | 13d | 7 | 1.15mi |
| 310 N Mason St Fort Collins, CO | 2.0 | 1.0–2.0 | 690 | $2,339 | $3.39 | 13d | 8 | 1.17mi |
| 281 Willow St Fort Collins, CO | 2.0 | 1.0–2.0 | 694 | $2,766 | $3.99 | 13d | 20 | 1.23mi |
| 225 N Sherwood St Fort Collins, CO | 1.0 | 1.0 | 450 | $1,250 | $2.78 | 23d | 1 | 1.28mi |
| 500 Laporte Ave Unit 106 Fort Collins, CO | 1.0 | 1.0 | 450 | $1,250 | $2.78 | 13d | 1 | 1.33mi |
| 172 N College Ave Fort Collins, CO | 1.0–2.0 | 1.0 | 462 | $1,723 | $3.73 | 23d | 4 | 1.35mi |
| 308 West St Fort Collins, CO | 2.0 | 1.0 | 719 | $1,500 | $2.09 | 23d | 1 | 1.41mi |
Listing history 2 events
-
2026-06-17remarks 699-char remark
-
2026-06-17$75,000 Active 1 DOM
ⓘ Source: listings_history table (triggers on properties + properties_extension) + one-shot
backfill from property_details.listing_events for pre-trigger history.
Tax reassessment forecast CO · Resets to sale price
- Current annual tax
- $366 · $31/mo
- Projected year-2 tax
- $412 · $34/mo
- Expected delta
- +$46/yr (+$4/mo · 12.6%)
ⓘ Screening estimate from a state-policy table — verify with the county assessor before closing.
Climate risk First Street
- Flood 1/10 Low FEMA zone X (unshaded) · 0% chance over 30 yrs
- Wildfire 3/10 Moderate
- Heat 3/10 Moderate 7 d/yr ≥91°F today · 18 d/yr by 30 yrs out
- Wind 1/10 Low
- Air quality 6/10 Major 13 unhealthy d/yr today · 13 by 30 yrs out
Nearby sold comps map
Loading sold comps map…
Walkable amenities ~0.75 mi
Loading nearby amenities…
Taxation est. · year 1
- Rental income
- $21,774
- − Mortgage interest
- −$4,201
- − Property taxes
- −$366
- − Insurance
- −$375
- − Repairs & maintenance
- −$1,742
- − Management
- −$1,742
- − Depreciation
- −$2,182
- Taxable income
- $11,166
- Est. tax owed @ 24.0%
- −$2,680
- After-tax cash flow
- $9,061/yr
For passive investors: Depreciation is non-cash, so a rental often shows a tax loss while cash-flowing — sheltering income. Rental losses are passive: they offset passive income freely, and up to $25,000/yr can offset ordinary (W-2) income if you actively participate and your MAGI is under $100k (phasing out to $0 by $150k); unused losses carry forward. On sale, claimed depreciation is recaptured at up to 25%, and gains may owe capital-gains tax (a 1031 exchange can defer both). Figures are a year-1 estimate at your 24.0% rate — not tax advice; consult a CPA.
Schools (NCES district)
- District
- Poudre School District R-1
- NCES district ID
- 0803990
- Math proficiency
- 45% ▼ -7.00%
- Reading proficiency
- 60% ▼ -2.00%
- Median HH income
- $57,281
- Composite
- 45.5/100
- National rank
- #2610
- State rank
- #10 of 86 in CO
Livability — Fort Collins
- Score
- 80/100
- State rank
- #11
- US rank
- #1750
Category grades
Schools grade is shown separately in the Schools card above.
Census & demographics
- Census place
- Fort Collins, CO
- County
- Larimer County · 338,255 people
- City population
- 202,303
- Metro
- Fort Collins, CO
- Population (ZIP)
- 40,030
- Household income
- $85,035
- Rent vs Own
- Severe rent burden
- 1860.0
Population outlook (Larimer County) Hauer SSP2
- Today (2025)
- 415,361 people
- By 2030
- 457,762 · +10.2%
- By 2040
- 542,310 · +30.6%
- By 2050
- 627,048 · +51.0%
- By 2075
- 833,722 · +100.7%
- By 2100
- 952,590 · +129.3%
Race, ethnicity, and origin ACS 2023
- Neighborhood character
- Predominantly White (77%)
- Race & ethnicity
- White 77% Hispanic / Latino 17% Two or more races 11% Asian 1% Native American 1%
- Hispanic origin (detail)
- Mexican 13%
- Common ancestry
- Slovak 3% Portuguese 3% Italian 3%
- Foreign-born
- 8% · Canada
- Languages at home
- 88% English-only · Spanish 10% German/W. Germanic 1%
Political lean MEDSL · Larimer
- 2024 margin
- D (+17.6) · D 57.4% · R 39.8% · Other 2.9%
- 2008→2024 swing
- +7.9pp toward D · 2008: 9.7pp · 2024: 17.6pp
- All cycles
- 2024: D+17.6 2020: D+15.4 2016: D+4.9 2012: D+5.2 2008: D+9.7
Not yet ingested
- Civics
- —
Market trends
- HPI YoY
- ▼ -581.67%
- Current HPI
- 274.4026
- Rent YoY
- ▲ 4.13%
- Metro
- Fort Collins, CO
- State GDP YoY
- ▲ 1.95%
- F500 in state
- 14
Industry mix (Fortune 500 HQ in CO)
| Industry | F500 HQs | Revenue |
|---|---|---|
| Technology Distribution | 1 | $31B |
|
||
| Food / Agriculture | 1 | $18B |
|
||
| Packaging | 1 | $14B |
|
||
| Healthcare | 1 | $13B |
|
||
| Energy | 1 | $10B |
|
||
| Technology | 1 | $4B |
|
||
Price history
-30.2% since first listed8 events — show timeline
- 2026-06-17 Listed $75,000 IRES
- 2023-08-21 Listing Removed — IRES
- 2023-03-02 Listed $100,000 IRES
- 2023-03-01 Listing Removed — IRES
- 2023-02-28 Price Changed $100,000 IRES
- 2023-02-28 Relisted — IRES
- 2023-01-21 Listing Removed — IRES
- 2022-06-23 Listed $107,500 IRES
Property tax history
+281.6%/yrLatest (2025): $366 · +281.6% YoY. Source: county tax records.
Cash-flow waterfall
monthlySold comps — $/sqft
last 12 mo · ≤1 miLoading sold comps…