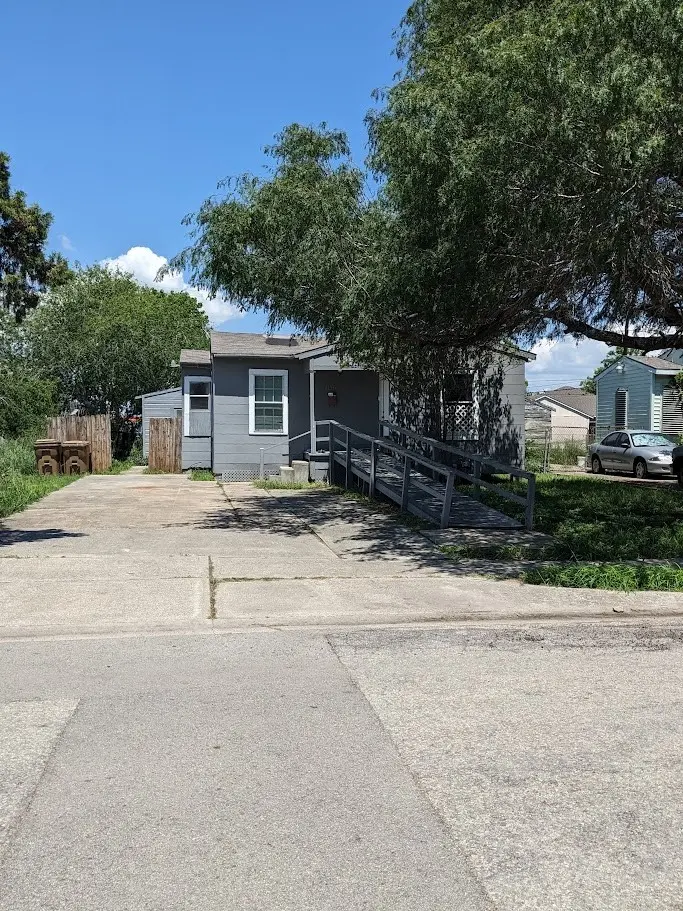
2637 Lynch St · Corpus Christi, TX
Flood risk 1/10 · Minimal
- FEMA flood zone
- X (unshaded)
- Chance of flooding over 30 yrs
- 0.0%
- Est. flood insurance / yr
- $507 – $1,088
Fire risk 1/10 · Minimal
- Est. fire insurance / yr
- $1,222 – $2,270
Heat risk 10/10 · Severe
- Hot days now (above 107°F)
- 7 days/yr
- Hot days in 30 yrs
- 26 days/yr
Wind risk 9/10 · Severe
- Chance of severe wind over 30 yrs
- 99.0%
Air-quality risk 1/10 · Minimal
- Unhealthy air days now
- 0 days/yr
- Unhealthy air days in 30 yrs
- 0 days/yr
Risk factors via First Street. Map © Google.
Why this score? — see what drove the B- grade
The composite is a weighted blend of 9 inputs, each scored 0–100. Each bar is that input's sub-score; the figure is the points it added to the 100-point composite (weight × sub-score).
- Cash flow +25.2/30.0
- ARV discount +15.0/15.0
- DSCR +8.3/10.0
- 1% rule +8.0/10.0
- Livability +3.9/5.0
- Rent growth +3.0/5.0
- Schools +2.8/10.0
- Condition / age +2.5/5.0
- Appreciation +0.0/10.0
$97,000
🖨 Deal sheet (PDF) 📄 Offer letter ✓ Due diligence
Listing remarks MLS
Good potential for investment property. Needs some repairs. Wheelchair accessible w/ front ramp and large walk-in shower. Back room can be used for office or 2nd living. Exterior storage room. Motivated Seller. All reasonable offers considered.
Key facts
- Laminate wood floors
- Ramp walkway
- Near del mar college
Tags
Property features AI
Exterior
- Parking: Attached parking; Concrete surface; Rear/side/off-street access; On-street parking; 2 parking spaces (total)
- Utilities: Natural gas available; Public water; Public sewer; Electric service with 220 volts and net meter
- Home design: Single-story; Entry level: 1; Shingle roof; Frame construction with wood siding; Pillar/post/pier foundation
- Construction: Built with frame and wood siding
- Exterior features: Handicap accessible exterior; Chain link fencing; Workshop
Interior
- Kitchen: Range hood
- Flooring: Hardwood; Laminate
- Bathrooms: 1 full bathroom
- Heating & cooling: Electric heating; Gas heating; Electric cooling; Gas cooling
- Interior features: Accessible approach with ramp; Handicap access
- Laundry & utility: Washer hookup; Dryer hookup
Neighborhood map
What this means for you Summary
Snapshot
- This is a 2-bed/1.0-bath single-family listed at $97k.
Deal economics
- At list price, monthly cash flow is $217 ($3k/yr) — positive.
- The deal already cash-flows at list — no discount required.
- Meets the 1% rule at list price ($1k rent vs $97k).
- Recommended offer: $94k (3.0% below list) — sets the bar for market timing.
- Cap rate 9.0% vs local median 3.6% in Corpus Christi — top-decile yield for the area; either an underpriced asset or a hidden risk that comps aren't pricing in. Stress-test before assuming the spread holds.
Location & tenants
- Location reads 78/100 on livability (#66 in TX, #2,404 nationally) — a middle-class / working-renter tenant base. Strengths: commute A+, cost of living A+, housing A+; Watch: crime F.
- Corpus Christi ISD (urban): math 31% / reading 35% proficiency, ranked #562 of 826 in TX (top 68%) — families likely to look elsewhere, expect single-tenant / working-renter base with shorter leases; 63% free/reduced lunch — lower-income household profile, screen leases tightly.
- Market conditions: Rents rising (+1.9%/yr); 141 active listings in the ZIP; 40 comparable units currently listed for rent nearby; rentals lingering (median 44d on market — plan ~5-8 weeks vacancy on turnover, expect pricing pressure); 52% of comp listings sitting > 30 days — soft ceiling on asking rent; 1,397 units permitted in Nueces County in 2024 (47 in 5+ unit buildings).
Forward outlook
- Local home prices are declining (-3.0%/yr); year-one equity from $671 of loan paydown is wiped out by about $3k of value loss. Plan a longer hold.
- Nueces County population projected at +36% by 2050 — long-run rental-demand tailwind backs the buy-and-hold thesis.
Negotiation context
- It's been on market 46 days — a 3% lower offer ($94k) is reasonable based on typical stale-listing flexibility.
- 2 sale attempts since 22y ago with the ask held roughly flat each time — persistent listings suggest the price (not the market) is what's stuck; bring a comps-based counter.
Risks & watch-outs
- Watch-outs: property tax is 2.9% of price; built in 1955 — expect roof / HVAC / electrical / plumbing capex.
- Climate carrying-cost: severe wind risk, 99% chance of damaging wind over 30y; extreme-heat days projected 7→26/yr by 2055 (HVAC capex compounding) — expect insurance premiums to compound above CPI over the hold.
Questions for the listing agent
- It's been on market 46 days. Have you received any prior offers? Is the seller open to a 3% concession, seller financing, or rate buy-down credit?
- Built in 1955 — when were the roof, HVAC, electrical panel, plumbing, and water heater last replaced?
- Property tax is high relative to price — has the assessment been appealed recently, and will the sale trigger a re-assessment?
- Is there a deadline driving the sale (1031 exchange, divorce, estate, relocation)? That informs how much negotiation room exists.
- Crime grade is F in this area — have there been break-ins, vandalism, or insurance claims at this property in the last 3 years? What carrier currently insures it and at what premium?
- What's the average days-on-market for RENTAL listings here right now (not sales)? A rising rental-DOM trend means longer vacancies and softer asking-rent achievability than the comps imply.
- What's the recent tenant-quality profile in this submarket — average credit score on applications, eviction rate, late-payment / NSF rate, and stable-employment percentage? A property-management company in the area should have these aggregated.
- How much new for-sale + rental construction is in the pipeline within 1–3 miles? Heavy new supply typically softens prices + rents 12–24 months out; constrained supply supports both.
Investment metrics
- 1% rule
- 1.30% ✓
- Cap rate
- 8.98%
- Cash-on-cash
- 9.60%
- DSCR
- 1.43
- GRM
- 6.4
CMA / ARV
- ARV (median comp)
- $118,757
- List price
- $97,000
- Delta
- -18.32%
- Verdict
- UNDERPRICED
- Comps
- 20 within 1.0 mi
Show comp detail 12 sales within ~0.75 mi
| Address | Dist | Beds/Ba | Sqft | Sold | Price | $/sf | Match |
|---|---|---|---|---|---|---|---|
| 2705 Elizabeth St | 0.16mi | 3/1.0 (+1) | 1,026 (+6%) | 3mo | $165,000 | $161 | 76 |
| 1359 18th Street St | 0.45mi | 2/1.0 | 936 (-4%) | 3mo | $55,000 | $59 | 70 |
| 2610 Elizabeth St | 0.12mi | 2/1.5 | 853 (-12%) | 4mo | $149,900 | $176 | 69 |
| 2630 Lynch St | 0.03mi | 2/1.0 | 1,096 (+13%) | 12mo | $135,000 | $123 | 67 |
| 2513 Terrace St | 0.14mi | 2/2.0 | 1,094 (+13%) | 3mo | $60,000 | $55 | 66 |
| 3037 Macarthur St | 0.70mi | 2/1.0 | 960 (-1%) | 1mo | $50,000 | $52 | 65 |
| 2407 David St | 0.37mi | 3/1.0 (+1) | 1,010 (+4%) | 11mo | $56,000 | $55 | 62 |
| 139 Edwards St | 0.57mi | 2/1.0 | 1,016 (+4%) | 8mo | $45,000 | $44 | 59 |
| 2506 Crews St | 0.56mi | 2/1.0 | 904 (-7%) | 10mo | $58,000 | $64 | 54 |
| 2530 Dunbar St | 0.69mi | 3/2.0 (+1) | 992 (+2%) | 2mo | $79,900 | $81 | 53 |
| 233 Tarlton St | 0.69mi | 1/1.0 (-1) | 1,056 (+9%) | 8mo | $80,000 | $76 | 42 |
| 2008 Craig St | 0.71mi | 2/1.0 | 854 (-12%) | 9mo | $100,000 | $117 | 40 |
Match score weights: distance 35% · size 25% · config 20% · recency 20%. Top-matched comps best support the ARV.
Projected returns pro-forma
-3.0% appreciation · 1.87% rent growth · sell at horizon
- IRR
- -3.2%
- Equity multiple
- 0.88×
- Total profit
- $-3,211
- Equity at exit
- $14,463
- IRR
- 5.1%
- Equity multiple
- 1.36×
- Total profit
- $9,678
- Equity at exit
- $8,387
Cash invested: $27,160 (down + closing). Projections, not guarantees.
Landlord ↔ Tenant lean methodology
- Overall (STATE)
- 87 Strongly Landlord-Friendly
- State Texas
- 87 Strongly Landlord-Friendly · R+5
- County
- — inherits STATE
- City
- — inherits STATE
ZIP-level market 78404
- Rents YoY
- 1.9%
- Active inventory
- 141
- Price-to-rent
- 6.4×
Monthly cashflow live
- Estimated rent
- $1,265 high interval (Pro) →
- Mortgage (P&I)
- −$509
- Tax from tax record
- −$233 /mo · $2,796/yr
- Insurance
- −$40
- HOA
- −$0
- Vacancy / Maint / Mgmt
- −$266
- Net cashflow
- $217
Break-even live
Sensitivity live
| Price | -10% $272 | -5% $245 | +0% $217 | +5% $190 | +10% $162 |
|---|---|---|---|---|---|
| Rent | -10% $117 | -5% $167 | +0% $217 | +5% $267 | +10% $317 |
| Rate | -1.0pp $266 | -0.5pp $242 | base $217 | +0.5pp $192 | +1.0pp $167 |
UW: 25.0% down · 7.5% · 30yr · 1.5% tax · 5.0% vac · 8.0% maint · 8.0% mgmt
Financing live
Cash to close
- Down payment
- $24,250
- Closing costs
- $2,910
- Reserves months
- —
- Total cash needed
- —
Loan-product check · same deal, 3 products live
Conventional
25% down · 7.5% · 30yr
- Down + closing
- —
- Monthly P&I
- —
- Monthly cashflow
- —
- DSCR
- —
- Eligible?
- —
Personal DTI + credit; lowest rate.
DSCR
20% down · 8.5% · 30yr
- Down + closing
- —
- Monthly P&I
- —
- Monthly cashflow
- —
- DSCR
- —
- Eligible?
- —
No personal income docs; deal must DSCR.
Hard money
10% down · 12.0% · 12mo
- Down + closing
- —
- Monthly P&I
- —
- Monthly cashflow
- —
- DSCR
- —
- Eligible?
- —
Short-term bridge; refi at stabilization.
Rent comps 40 comps
| Address | Beds | Baths | Sqft | Rent | $/sqft | DOM | Units | Dist |
|---|---|---|---|---|---|---|---|---|
| 1525 S 19th St Unit B Corpus Christi, TX | 3.0 | 2.0 | 1062 | $2,100 | $1.98 | 14d | 1 | 0.19mi |
| 1628 18th St Corpus Christi, TX | 2.0 | 1.0 | 1112 | $1,000 | $0.90 | 44d | 1 | 0.22mi |
| 2333 Riggan St Corpus Christi, TX | 2.0 | 1.0 | 856 | $1,250 | $1.46 | 44d | 1 | 0.28mi |
| 1634 14th St Corpus Christi, TX | 2.0 | 1.5 | 980 | $1,090 | $1.11 | 44d | 1 | 0.48mi |
| 2522 Cleo St Corpus Christi, TX | 3.0 | 1.0 | 992 | $1,350 | $1.36 | 14d | 1 | 0.50mi |
| 1800 S Staples St Corpus Christi, TX | 1.0 | 1.0 | 585 | $1,015 | $1.74 | 44d | 1 | 0.58mi |
| 2402 Segrest St Corpus Christi, TX | 2.0 | 1.0 | 1120 | $825 | $0.74 | 21d | 1 | 0.58mi |
| 1808 Morgan Ave Corpus Christi, TX | 1.0 | 1.0 | 667 | $975 | $1.46 | 44d | 1 | 0.59mi |
| 1802 Morgan Ave Unit 1802 Corpus Christi, TX | 2.0 | 1.0 | 850 | $1,250 | $1.47 | 21d | 1 | 0.59mi |
| 1802 Morgan Ave Unit 1804 Corpus Christi, TX | 1.0 | 1.0 | 667 | $695 | $1.04 | 44d | 1 | 0.60mi |
| 1433 12th St Corpus Christi, TX | 2.0 | 1.0 | 768 | $1,050 | $1.37 | 44d | 1 | 0.62mi |
| 1201 York Ave Corpus Christi, TX | 3.0 | 1.0 | 888 | $1,550 | $1.75 | 21d | 1 | 0.67mi |
| 815 Ohio Ave Unit 3 Corpus Christi, TX | 2.0 | 1.0 | 748 | $985 | $1.32 | 44d | 1 | 0.77mi |
| 1521 7th St Corpus Christi, TX | 2.0 | 2.0 | 850 | $1,250 | $1.47 | 14d | 1 | 0.77mi |
| 200 Clemmer St Unit A Corpus Christi, TX | 3.0 | 1.0 | 950 | $1,199 | $1.26 | 44d | 1 | 0.80mi |
| 1124 Morgan Ave Unit 1268437P Corpus Christi, TX | 2.0 | 1.0 | 721 | $2,081 | $2.89 | 44d | 1 | 0.80mi |
| 1112 Morgan Ave Unit 1268432P Corpus Christi, TX | 1.0 | 1.0 | 656 | $1,632 | $2.49 | 44d | 1 | 0.81mi |
| 1116 Morgan Ave Unit 1268439P Corpus Christi, TX | 1.0 | 1.0 | 656 | $1,743 | $2.66 | 44d | 1 | 0.81mi |
| 1116 Morgan Ave Unit 1268424P Corpus Christi, TX | 1.0 | 1.0 | 656 | $1,454 | $2.22 | 44d | 1 | 0.81mi |
| 1114 25th St Corpus Christi, TX | 1.0–2.0 | 1.0 | 712 | $1,050 | $1.47 | 14d | 6 | 0.85mi |
| 1318 6th St Corpus Christi, TX | 2.0 | 1.0 | 900 | $900 | $1.00 | 14d | 1 | 0.92mi |
| 801 18th St Corpus Christi, TX | 1.0 | 1.0 | 600 | $895 | $1.49 | 21d | 1 | 0.93mi |
| 616 16th St Unit A Corpus Christi, TX | 3.0 | 1.0 | 1040 | $1,050 | $1.01 | 44d | 1 | 1.01mi |
| 3150 Elgin St Corpus Christi, TX | 2.0 | 1.0 | 616 | $925 | $1.50 | 44d | 1 | 1.02mi |
| 443 Indiana Ave Corpus Christi, TX | 2.0 | 1.0 | 968 | $1,650 | $1.70 | 44d | 1 | 1.04mi |
| 826 Hancock Ave Unit 1 Corpus Christi, TX | 1.0 | 1.0 | 700 | $850 | $1.21 | 21d | 1 | 1.10mi |
| 826 Hancock Ave Unit 2 Corpus Christi, TX | 2.0 | 1.0 | 1000 | $950 | $0.95 | 21d | 1 | 1.10mi |
| 826 Hancock Ave Unit 3 Corpus Christi, TX | 1.0 | 1.0 | 700 | $800 | $1.14 | 21d | 1 | 1.10mi |
| 901 Furman Ave Unit B Corpus Christi, TX | 1.0 | 1.0 | 659 | $750 | $1.14 | 21d | 1 | 1.12mi |
| 901 Furman Ave Unit F Corpus Christi, TX | 1.0 | 1.0 | 560 | $700 | $1.25 | 44d | 1 | 1.12mi |
| 2937 Ruth St Corpus Christi, TX | 2.0 | 1.0 | 676 | $950 | $1.41 | 44d | 1 | 1.16mi |
| 330 Texas Ave Corpus Christi, TX | 2.0 | 1.0 | 806 | $1,300 | $1.61 | 44d | 1 | 1.16mi |
| 1124 2nd St Corpus Christi, TX | 1.0 | 1.0 | 800 | $800 | $1.00 | 44d | 1 | 1.19mi |
| 2833 Lawnview St Corpus Christi, TX | 2.0 | 1.0 | 850 | $1,000 | $1.18 | 14d | 1 | 1.20mi |
| 332 Rosebud Ave Corpus Christi, TX | 2.0 | 1.0 | 942 | $1,150 | $1.22 | 21d | 1 | 1.21mi |
| 522 Hancock Ave Unit 2-238 Corpus Christi, TX | 1.0 | 1.0 | 784 | $1,365 | $1.74 | 14d | 1 | 1.26mi |
| 309 Rosebud Ave Unit D Corpus Christi, TX | 2.0 | 1.0 | 882 | $1,100 | $1.25 | 21d | 1 | 1.26mi |
| 1402 Devon Dr Corpus Christi, TX | 1.0 | 1.0 | 540 | $795 | $1.47 | 14d | 1 | 1.26mi |
| 613 6th St Corpus Christi, TX | 1.0 | 1.0 | 650 | $850 | $1.31 | 44d | 1 | 1.26mi |
| 522 Hancock Ave Corpus Christi, TX | 1.0–2.0 | 1.0–2.0 | 915 | $2,000 | $2.18 | 14d | 10 | 1.27mi |
Listing history 19 events
-
2026-06-18days on market $97,000 Active 46 DOM
-
2026-06-17days on market $97,000 Active 45 DOM
-
2026-06-16days on market $97,000 Active 44 DOM
-
2026-06-15days on market $97,000 Active 43 DOM
-
2026-06-14days on market $97,000 Active 41 DOM
-
2026-06-10days on market $97,000 Active 38 DOM
-
2026-06-09days on market $97,000 Active 37 DOM
-
2026-06-08days on market $97,000 Active 36 DOM
-
2026-06-07days on market $97,000 Active 35 DOM
-
2026-06-05days on market $97,000 Active 32 DOM
-
2026-06-03days on market $97,000 Active 31 DOM
-
2026-06-02days on market $97,000 Active 30 DOM
-
2026-06-01days on market $97,000 Active 29 DOM
-
2026-05-31days on market $97,000 Active 28 DOM
-
2026-05-30days on market $97,000 Active 27 DOM
-
2026-05-01$97,000 Active 341-char remark
-
2004-06-29soldstatus
-
2004-06-28soldstatus 244-char remark
Show marketing remark (244 chars)
Good potential for investment property. Needs some repairs. Wheelchair accessible w/ front ramp and large walk-in shower. Back room can be used for office or 2nd living. Exterior storage room. Motivated Seller. All reasonable offers considered.
-
2004-03-22$43,500 244-char remark
Show marketing remark (244 chars)
Good potential for investment property. Needs some repairs. Wheelchair accessible w/ front ramp and large walk-in shower. Back room can be used for office or 2nd living. Exterior storage room. Motivated Seller. All reasonable offers considered.
ⓘ Source: listings_history table (triggers on properties + properties_extension) + one-shot
backfill from property_details.listing_events for pre-trigger history.
Tax reassessment forecast TX · Resets to sale price
- Current annual tax
- $2,796 · $233/mo
- Projected year-2 tax
- $2,796 · $233/mo
- Expected delta
- $0/yr ($0/mo · 0.0%)
ⓘ Screening estimate from a state-policy table — verify with the county assessor before closing.
Climate risk First Street
- Flood 1/10 Low FEMA zone X (unshaded) · 0% chance over 30 yrs
- Wildfire 1/10 Low
- Heat 10/10 Extreme 7 d/yr ≥107°F today · 26 d/yr by 30 yrs out
- Wind 9/10 Extreme 99% chance of damaging wind over 30 yrs
- Air quality 1/10 Low 0 unhealthy d/yr today · 0 by 30 yrs out
Nearby sold comps map
Loading sold comps map…
Walkable amenities ~0.75 mi
Loading nearby amenities…
Taxation est. · year 1
- Rental income
- $15,180
- − Mortgage interest
- −$5,434
- − Property taxes
- −$2,796
- − Insurance
- −$485
- − Repairs & maintenance
- −$1,214
- − Management
- −$1,214
- − Depreciation
- −$2,822
- Taxable income
- $1,216
- Est. tax owed @ 24.0%
- −$292
- After-tax cash flow
- $2,316/yr
For passive investors: Depreciation is non-cash, so a rental often shows a tax loss while cash-flowing — sheltering income. Rental losses are passive: they offset passive income freely, and up to $25,000/yr can offset ordinary (W-2) income if you actively participate and your MAGI is under $100k (phasing out to $0 by $150k); unused losses carry forward. On sale, claimed depreciation is recaptured at up to 25%, and gains may owe capital-gains tax (a 1031 exchange can defer both). Figures are a year-1 estimate at your 24.0% rate — not tax advice; consult a CPA.
Schools (NCES district)
- District
- Corpus Christi ISD
- NCES district ID
- 4815270
- Math proficiency
- 31% ▼ -18.00%
- Reading proficiency
- 35% ▼ -7.00%
- Median HH income
- $45,672
- Composite
- 28.27/100
- National rank
- #6793
- State rank
- #562 of 826 in TX
Livability — Corpus Christi
- Score
- 78/100
- State rank
- #66
- US rank
- #2404
Category grades
Schools grade is shown separately in the Schools card above.
Census & demographics
- Census place
- Corpus Christi, TX
- County
- Nueces County · 296,836 people
- City population
- 296,836
- Metro
- Corpus Christi, TX
- Population (ZIP)
- 12,635
- Household income
- $61,280
- Rent vs Own
- Severe rent burden
- 596.0
Population outlook (Nueces County) Hauer SSP2
- Today (2025)
- 418,037 people
- By 2030
- 447,123 · +7.0%
- By 2040
- 505,911 · +21.0%
- By 2050
- 567,522 · +35.8%
- By 2075
- 729,686 · +74.6%
- By 2100
- 847,087 · +102.6%
Race, ethnicity, and origin ACS 2023
- Neighborhood character
- Majority Hispanic (62%)
- Race & ethnicity
- Hispanic / Latino 62% White 32% Two or more races 29% Black 4%
- Hispanic origin (detail)
- Mexican 56%
- Common ancestry
- Slovak 3% Italian 2% Lithuanian 1%
- Foreign-born
- 9% · Canada
- Languages at home
- 61% English-only · Spanish 39%
Political lean MEDSL · Nueces
- 2024 margin
- R (+11.5) · D 43.8% · R 55.3%
- 2008→2024 swing
- -7.1pp toward R · 2008: -4.4pp · 2024: -11.5pp
- All cycles
- 2024: R+11.5 2020: R+2.9 2016: R+1.5 2012: R+3.2 2008: R+4.4
Not yet ingested
- Civics
- —
Market trends
- HPI YoY
- ▼ -211.10%
- Current HPI
- 177.4759
- Rent YoY
- ▲ 1.87%
- Metro
- Corpus Christi, TX
- State GDP YoY
- ▲ 3.95%
- F500 in state
- 110
Industry mix (Fortune 500 HQ in TX)
| Industry | F500 HQs | Revenue |
|---|---|---|
| Energy | 16 | $1,198B |
|
||
| Technology | 5 | $198B |
|
||
| Engineering / Construction | 4 | $72B |
|
||
| Energy Services | 3 | $60B |
|
||
| Utilities | 3 | $41B |
|
||
| Healthcare | 2 | $330B |
|
||
Price history
+123.0% since first listed4 events — show timeline
- 2026-05-01 Listed $97,000 CBMLS
- 2004-06-29 Sold (Public Records) — Public Records
- 2004-06-28 Sold (MLS) — CBMLS
- 2004-03-22 Listed $43,500 CBMLS
Property tax history
+7.9%/yrLatest (2025): $2,796 · +9.9% YoY. Source: county tax records.
Cash-flow waterfall
monthlySold comps — $/sqft
last 12 mo · ≤1 miLoading sold comps…