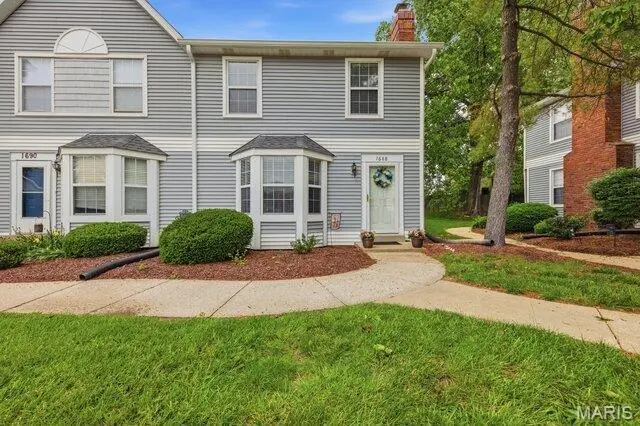
1688 Kircher Dr Unit G · St. Charles, MO
Flood risk 1/10 · Minimal
- FEMA flood zone
- X (unshaded)
- Chance of flooding over 30 yrs
- 0.0%
- Est. flood insurance / yr
- $507 – $1,088
Fire risk 1/10 · Minimal
- Est. fire insurance / yr
- $1,054 – $1,958
Heat risk 5/10 · Moderate
- Hot days now (above 107°F)
- 7 days/yr
- Hot days in 30 yrs
- 20 days/yr
Wind risk 2/10 · Minimal
- Chance of severe wind over 30 yrs
- 1.0%
Air-quality risk 3/10 · Minor
- Unhealthy air days now
- 2 days/yr
- Unhealthy air days in 30 yrs
- 3 days/yr
Risk factors via First Street. Map © Google.
Why this score? — see what drove the D+ grade
The composite is a weighted blend of 9 inputs, each scored 0–100. Each bar is that input's sub-score; the figure is the points it added to the 100-point composite (weight × sub-score).
- ARV discount +13.2/15.0
- Cash flow +10.2/30.0
- 1% rule +6.9/10.0
- Schools +5.2/10.0
- Rent growth +3.3/5.0
- DSCR +2.9/10.0
- Livability +2.5/5.0
- Condition / age +2.5/5.0
- Appreciation +0.0/10.0
$165,000
🖨 Deal sheet 📄 Offer letter ✓ Due diligence
Listing remarks
Welcome to this charming all-electric 3 bedroom, 1.5 bath end-unit townhouse (one of largest in complex) in the desirable Heatherton Condominiums community in St. Charles! Conveniently located just minutes from highways, shopping, restaurants, the library, and the Centennial Greenway, this home offers easy, low-maintenance living in a location that keeps you close to everything while still feeling tucked away. The detached 1-car garage w/ opener (plus additional shared parking) makes everyday living simple for both owners and guests. Inside, the oversized living room feels warm and welcoming with a classic brick wood-burning fireplace, cozy character, and a beautiful bay window that fills t
Key facts
- $513 HOA
- Garage
- Community pool
Property features AI
Finance
- Other: Private ownership
- HOA & community: Heatherton Condominium Association; Monthly association fee covers insurance, common area and exterior maintenance, sewer, snow removal, trash and water; Association amenities include common ground, parking and a pool
Exterior
- Parking: Detached garage with garage door opener (approx. 21x12); Additional paved on-site/off-street parking and parking lot
- Utilities: Public water; Public sewer; Ameren electric; Cable available; Natural gas connected; Phone available; Underground utilities; Water, sewer and electricity connected
- Home design: Attached townhouse; Two levels; Private ownership
- Construction: Unknown construction materials; Concrete perimeter foundation; Full unfinished basement with 8+ ft pour and sump pump
- Exterior features: Patio; Adjoins common ground; Panel, pocket, sliding and storm doors; Community outdoor pool
Interior
- Kitchen: Dishwasher; Disposal; Electric range
- Bedrooms: 3 bedrooms (all on upper level)
- Flooring: Carpet; Vinyl
- Bathrooms: 1 full bathroom (upper level); 1 half bathroom (main level)
- Heating & cooling: Natural gas heating; Central air; Ceiling fans
- Interior features: Ceiling fans; Eat-in kitchen; Laminate counters; Pantry; Wood-burning fireplace in the living room; Bay window in the living room
- Laundry & utility: Laundry in basement; Electric water heater
Neighborhood map
What this means for you Summary
Snapshot
- This is a 3-bed/1.5-bath townhouse listed at $165k.
Deal economics
- At list price, monthly cash flow is $-93 ($-1k/yr) — negative.
- To cash-flow at today's rent, offer at most $149k (9.9% below list).
- Meets the 1% rule at list price ($2k rent vs $165k).
- Recommended offer: $149k (9.9% below list) — sets the bar for cash-flow.
- Cap rate 5.6% vs local median 3.3% in St. Charles — top-decile yield for the area; either an underpriced asset or a hidden risk that comps aren't pricing in. Stress-test before assuming the spread holds.
Location & tenants
- Location reads: area grade D — affects rentability + tenant quality, not the cash-flow math above.
- Francis Howell R-III (suburban): math 53% / reading 63% proficiency, ranked #11 of 324 in MO (top 3%) — acceptable for families but not a draw, mixed tenant base, ~2y average lease; only 15% free/reduced lunch — higher-income household profile.
- Zoned schools: Henderson Elem. (math 48% / reading 52%, grade D+, #280 of 1,115 statewide, top 25%, 676 students, 24% FRL); Francis Howell North High (math 40% / reading 55%, grade D, #154 of 521 statewide, top 29%, 1,679 students, 19% FRL).
- Market conditions: Rents rising (+3.3%/yr); 192 active listings in the ZIP; 10 comparable units currently listed for rent nearby; rentals leasing fast (median 5d on market — plan ~1-2 weeks tenant-placement turnaround); solid renter incomes; 2,021 units permitted in St. Charles County in 2024 (568 in 5+ unit buildings).
Forward outlook
- Local home prices are declining (-3.0%/yr); year-one equity from $1k of loan paydown is wiped out by about $5k of value loss. Plan a longer hold.
- St. Charles County population projected at +22% by 2050 — long-run rental-demand tailwind backs the buy-and-hold thesis.
Negotiation context
- Only 4 days on market — expect competitive offers; lowballing is unlikely to land.
- Current owner paid $72k; list at $165k implies a 129% gain — meaningful room to come down on a strong offer.
Risks & watch-outs
- Watch-outs: HOA is 26% of rent.
- Climate carrying-cost: extreme-heat days projected 7→20/yr by 2055 (HVAC capex compounding) — expect insurance premiums to compound above CPI over the hold.
Questions for the listing agent
- What do current leases actually rent for vs. the listed asking? Can we see a recent rent roll and the last 12 months of T-12 income?
- What does the HOA fee cover, when was the last increase, and are there any pending special assessments or reserve-fund shortfalls?
- Is there a deadline driving the sale (1031 exchange, divorce, estate, relocation)? That informs how much negotiation room exists.
- The area grade is low — what's the realistic commute time and amenity access for the typical tenant pool here? Any planned neighborhood developments (good or bad) we should know about?
- What's the average days-on-market for RENTAL listings here right now (not sales)? A rising rental-DOM trend means longer vacancies and softer asking-rent achievability than the comps imply.
- What's the recent tenant-quality profile in this submarket — average credit score on applications, eviction rate, late-payment / NSF rate, and stable-employment percentage? A property-management company in the area should have these aggregated.
- How much new for-sale + rental construction is in the pipeline within 1–3 miles? Heavy new supply typically softens prices + rents 12–24 months out; constrained supply supports both.
Investment metrics
- 1% rule
- 1.19% ✓
- Cap rate
- 5.62%
- Cash-on-cash
- -2.41%
- DSCR
- 0.89
- GRM
- 7.0
CMA / ARV
- ARV (on-the-fly)
- $188,860
- Comps found
- 12
Show comp detail 12 sales within ~0.75 mi
| Address | Dist | Beds/Ba | Sqft | Sold | Price | $/sf | Match |
|---|---|---|---|---|---|---|---|
| 1688 Kircher Dr Unit G | 0.00mi | 3/1.5 | 1,420 (0%) | 0mo | $165,000 | $116 | 100 |
| 1771 Florine Blvd | 0.07mi | 2/1.5 (-1) | 1,392 (-2%) | 6mo | $184,900 | $133 | 84 |
| 1787 Florine Blvd Unit F | 0.08mi | 2/1.5 (-1) | 1,500 (+6%) | 5mo | $200,000 | $133 | 78 |
| 1755 Florine Blvd Unit A | 0.09mi | 3/1.5 | 1,280 (-10%) | 3mo | $185,000 | $145 | 77 |
| 1619 Florine Blvd Unit E | 0.13mi | 3/2.0 | 1,344 (-5%) | 10mo | $187,500 | $140 | 75 |
| 1430 Heritage Lndg #102 | 0.70mi | 3/2.0 | 1,374 (-3%) | 8mo | $184,900 | $135 | 53 |
| 1420 Heritage Lndg #102 | 0.67mi | 3/2.0 | 1,374 (-3%) | 11mo | $139,900 | $102 | 52 |
| 1430 Heritage #101 | 0.70mi | 3/2.0 | 1,374 (-3%) | 12mo | $164,900 | $120 | 50 |
| 16 Hunting Manor Dr | 0.57mi | 2/2.0 (-1) | 1,320 (-7%) | 7mo | $274,900 | $208 | 49 |
| 1400 Heritage Lndg #202 | 0.68mi | 3/2.0 | 1,327 (-6%) | 10mo | $150,000 | $113 | 47 |
| 1420 Heritage Landing #303 | 0.67mi | 2/2.0 (-1) | 1,374 (-3%) | 12mo | $165,000 | $120 | 46 |
| 2806 Mcclay Road Rd | 0.65mi | 3/2.5 | 1,510 (+6%) | 12mo | $364,000 | $241 | 45 |
Match score weights: distance 35% · size 25% · config 20% · recency 20%. Top-matched comps best support the ARV.
Projected returns pro-forma
-3.0% appreciation · 3.27% rent growth · sell at horizon
- IRR
- -19.6%
- Equity multiple
- 0.31×
- Total profit
- $-31,764
- Equity at exit
- $24,602
- IRR
- -11.1%
- Equity multiple
- 0.31×
- Total profit
- $-31,678
- Equity at exit
- $14,266
Cash invested: $46,200 (down + closing). Projections, not guarantees.
Landlord ↔ Tenant lean methodology
- Overall (STATE)
- 81 Strongly Landlord-Friendly
- State Missouri
- 81 Strongly Landlord-Friendly · R+10
- County
- — inherits STATE
- City
- — inherits STATE
ZIP-level market 63303
- Rents YoY
- 3.3%
- Active inventory
- 192
- Price-to-rent
- 7.0×
Monthly cashflow live
- Estimated rent
- $1,962 high interval (Pro) →
- Mortgage (P&I)
- −$865
- Tax from tax record
- −$195 /mo · $2,344/yr
- Insurance
- −$69
- HOA
- −$513
- Vacancy / Maint / Mgmt
- −$412
- Net cashflow
- $-93
Break-even live
UW: 25.0% down · 7.5% · 30yr · 1.5% tax · 5.0% vac · 8.0% maint · 8.0% mgmt
Financing live
Cash to close
- Down payment
- $41,250
- Closing costs
- $4,950
- Reserves months
- —
- Total cash needed
- —
Loan-product check · same deal, 3 products live
Conventional
25% down · 7.5% · 30yr
- Down + closing
- —
- Monthly P&I
- —
- Monthly cashflow
- —
- DSCR
- —
- Eligible?
- —
Personal DTI + credit; lowest rate.
DSCR
20% down · 8.5% · 30yr
- Down + closing
- —
- Monthly P&I
- —
- Monthly cashflow
- —
- DSCR
- —
- Eligible?
- —
No personal income docs; deal must DSCR.
Hard money
10% down · 12.0% · 12mo
- Down + closing
- —
- Monthly P&I
- —
- Monthly cashflow
- —
- DSCR
- —
- Eligible?
- —
Short-term bridge; refi at stabilization.
Rent comps 10 comps
| Address | Beds | Baths | Sqft | Rent | $/sqft | DOM | Units | Dist |
|---|---|---|---|---|---|---|---|---|
| 1431 Heritage Lndg Saint Charles, MO | 2.0 | 2.0 | 1132 | $1,800 | $1.59 | 43d | 1 | 0.72mi |
| 1517 Shadow Wood Dr Saint Charles, MO | 3.0 | 2.0 | 1064 | $2,250 | $2.11 | 11d | 1 | 0.94mi |
| 99 Sugar Maple Ln St Charles, MO | 1.0–2.0 | 1.0 | 782 | $1,450 | $1.85 | 1d | 12 | 0.95mi |
| 2717 Greenleaf Dr Saint Charles, MO | 3.0 | 2.0 | 1189 | $2,379 | $2.00 | 4d | 1 | 1.18mi |
| 100 Broadridge Dr St Peters, MO | 1.0–2.0 | 1.0–2.0 | 845 | $1,648 | $1.95 | 1d | 10 | 1.26mi |
| 1000 Jasper Ln St Peters, MO | 1.0–3.0 | 1.0–2.0 | 1047 | $2,332 | $2.23 | 1d | 12 | 1.32mi |
| 206 Waterside Crossing Ct Saint Peters, MO | 2.0 | 2.0 | 1256 | $2,100 | $1.67 | 10d | 1 | 1.32mi |
| 1400 Aberdeen Ct Saint Charles, MO | 1.0–2.0 | 1.0–2.0 | 950 | $1,994 | $2.10 | 1d | 25 | 1.41mi |
| 2200 Lake Ct St Charles, MO | 2.0 | 1.0–2.0 | 784 | $1,749 | $2.23 | 1d | 15 | 1.43mi |
| 1321 Forest Creek Dr St Peters, MO | 2.0 | 1.0 | 1359 | $2,000 | $1.47 | 43d | 1 | 1.45mi |
HOA detail
- Monthly dues
- $513 · $6,156/yr
- Likely covers
- electric
Listing history 3 events
-
2026-05-21$165,000 Active
-
2026-05-21historical $165,000
-
1985-05-01soldstatus $72,000
ⓘ Source: listings_history table (triggers on properties + properties_extension) + one-shot
backfill from property_details.listing_events for pre-trigger history.
Tax reassessment forecast MO · Resets to sale price
- Current annual tax
- $2,344 · $195/mo
- Projected year-2 tax
- $2,344 · $195/mo
- Expected delta
- $0/yr ($0/mo · 0.0%)
ⓘ Screening estimate from a state-policy table — verify with the county assessor before closing.
Climate risk First Street
- Flood 1/10 Low FEMA zone X (unshaded) · 0% chance over 30 yrs
- Wildfire 1/10 Low
- Heat 5/10 Major 7 d/yr ≥107°F today · 20 d/yr by 30 yrs out
- Wind 2/10 Low 100% chance of damaging wind over 30 yrs
- Air quality 3/10 Moderate 2 unhealthy d/yr today · 3 by 30 yrs out
Nearby sold comps map
Loading sold comps map…
Walkable amenities ~0.75 mi
Loading nearby amenities…
Taxation est. · year 1
- Rental income
- $23,540
- − Mortgage interest
- −$9,243
- − Property taxes
- −$2,344
- − Insurance
- −$825
- − Repairs & maintenance
- −$1,883
- − Management
- −$1,883
- − HOA
- −$6,156
- − Depreciation
- −$4,800
- Taxable loss
- −$3,594
- Est. tax savings @ 24.0%
- +$862
- After-tax cash flow
- $-249/yr
For passive investors: Depreciation is non-cash, so a rental often shows a tax loss while cash-flowing — sheltering income. Rental losses are passive: they offset passive income freely, and up to $25,000/yr can offset ordinary (W-2) income if you actively participate and your MAGI is under $100k (phasing out to $0 by $150k); unused losses carry forward. On sale, claimed depreciation is recaptured at up to 25%, and gains may owe capital-gains tax (a 1031 exchange can defer both). Figures are a year-1 estimate at your 24.0% rate — not tax advice; consult a CPA.
Schools (NCES district)
- District
- Francis Howell R-III
- NCES district ID
- 2928950
- Math proficiency
- 53% ▼ -12.00%
- Reading proficiency
- 63% ▼ -5.00%
- Median HH income
- $79,768
- Composite
- 52.23/100
- National rank
- #1602
- State rank
- #11 of 324 in MO
Livability — St. Charles
No livability data for this city. (Only ~50 U.S. cities are tracked.)
Census & demographics
- Census place
- St. Charles, MO
- County
- Saint Charles County · 399,703 people
- Metro
- St. Louis, MO-IL
- Population (ZIP)
- 46,089
- Household income
- $99,138
- Rent vs Own
- Severe rent burden
- 1026.0
Population outlook (St. Charles County) Hauer SSP2
- Today (2025)
- 437,857 people
- By 2030
- 461,707 · +5.4%
- By 2040
- 503,222 · +14.9%
- By 2050
- 534,684 · +22.1%
- By 2075
- 597,047 · +36.4%
- By 2100
- 609,682 · +39.2%
Race, ethnicity, and origin ACS 2023
- Neighborhood character
- Predominantly White (79%)
- Race & ethnicity
- White 79% Black 6% Asian 6% Two or more races 6% Hispanic / Latino 5%
- Common ancestry
- Lithuanian 3% Romanian 3% Slovak 2%
- Foreign-born
- 7% · Canada, China, South Korea
- Languages at home
- 91% English-only · Spanish 3% Other Indo-European 1% Other Asian/Pacific 1%
Political lean MEDSL · St. Charles
- 2024 margin
- R (+17.0) · D 40.8% · R 57.8% · Other 1.4%
- 2008→2024 swing
- -7.2pp toward R · 2008: -9.7pp · 2024: -17.0pp
- All cycles
- 2024: R+17.0 2020: R+17.5 2016: R+26.4 2012: R+21.0 2008: R+9.7
Not yet ingested
- Civics
- —
Market trends
- HPI YoY
- ▼ -260.84%
- Current HPI
- 224.7406
- Rent YoY
- ▲ 3.27%
- Metro
- St. Louis, MO-IL
- State GDP YoY
- ▲ 1.84%
- F500 in state
- 20
Industry mix (Fortune 500 HQ in MO)
| Industry | F500 HQs | Revenue |
|---|---|---|
| Healthcare | 1 | $163B |
|
||
| Insurance | 1 | $21B |
|
||
| Industrial Technology | 1 | $17B |
|
||
| Retail | 1 | $16B |
|
||
| Industrial Distribution | 1 | $10B |
|
||
| Utilities | 1 | $9B |
|
||
Price history
+129.2% since first listed3 events — show timeline
- 2026-05-21 Listed $165,000 MARIS as Distributed by MLS Grid
- 2026-05-21 Coming Soon $165,000 MARIS as Distributed by MLS Grid
- 1985-05-01 Sold (Public Records) $72,000 Public Records
Property tax history
+4.4%/yrLatest (2025): $2,344 · +9.5% YoY. Source: county tax records.
Cash-flow waterfall
monthlySold comps — $/sqft
last 12 mo · ≤1 miLoading sold comps…