 Multi-family
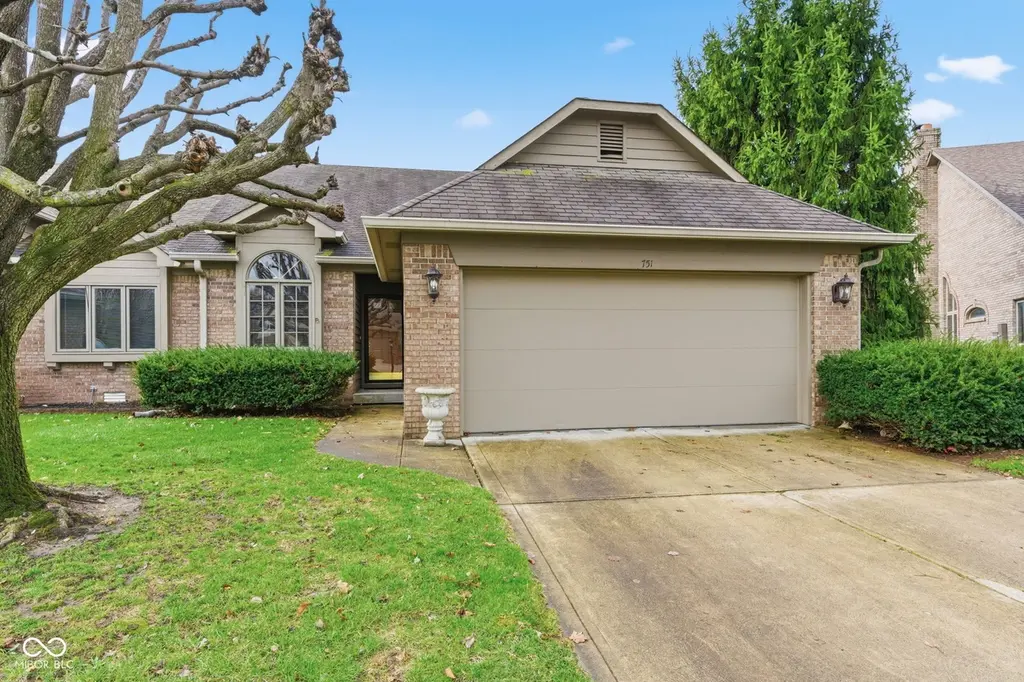
751 Cottage Ln · Greenwood, IN
Flood risk 1/10 · Minimal
- FEMA flood zone
- X (unshaded)
- Chance of flooding over 30 yrs
- 0.0%
- Est. flood insurance / yr
- $507 – $1,088
Fire risk 1/10 · Minimal
- Est. fire insurance / yr
- $717 – $1,331
Heat risk 4/10 · Minor
- Hot days now (above 101°F)
- 7 days/yr
- Hot days in 30 yrs
- 19 days/yr
Wind risk 2/10 · Minimal
- Chance of severe wind over 30 yrs
- 1.0%
Air-quality risk 2/10 · Minimal
- Unhealthy air days now
- 2 days/yr
- Unhealthy air days in 30 yrs
- 2 days/yr
Risk factors via First Street. Map © Google.
Why this score? — see what drove the D grade
The composite is a weighted blend of 9 inputs, each scored 0–100. Each bar is that input's sub-score; the figure is the points it added to the 100-point composite (weight × sub-score).
- Cash flow +11.3/30.0
- ARV discount +11.2/15.0
- Schools +4.0/10.0
- Livability +3.7/5.0
- DSCR +3.3/10.0
- Rent growth +3.0/5.0
- Condition / age +2.5/5.0
- 1% rule +2.4/10.0
- Appreciation +0.0/10.0
$225,000
🖨 Deal sheet (PDF) 📄 Offer letter ✓ Due diligence
Multi-family units
County records classify this as Multi-Family (2-4 Unit). Listing-text estimate: 1 unit. estimate disagrees with records
Listing remarks MLS
Ideally situated in Greenwood near shopping, dining and everyday conveniences, this centrally located home combines comfort, convenience, and easy living. Featuring 2 bedrooms and 2 full baths, this home offers a comfortable and practical layout suited for a variety of lifestyles. The primary suite includes a walk-in closet and a private bath with the second bedroom and full bath to offer great flexibility for guests or a home office. All kitchen appliances are updated and included! Unwind in the screened-in porch perfect for enjoying fresh air in a peaceful, covered setting. This home is move in ready. NEW ROOF IN APRIL 2026, NEW SHOWER INSTALLED IN PRIMARY BATH IN APRIL 2026, SCREENED-IN PORCH FRESHLY PAINTED, WOOD TRIM AROUND SOME WINDOW'S REPLACED.
Key facts
- 6,578 sq ft lot
- 2 garage spots
- Built 1996
Neighborhood map
What this means for you Summary
Snapshot
- This is a 2-bed/2.0-bath multifamily listed at $225k.
Deal economics
- At list price, monthly cash flow is $-82 ($-987/yr) — negative.
- To cash-flow at today's rent, offer at most $210k (6.5% below list).
- To meet the 1% rule (rent ≥ 1% of price), the offer needs to be $167k (25.6% below list).
- Recommended offer: $167k (25.6% below list) — sets the bar for 1% rule.
- Cap rate 5.9% vs local median 4.5% in Greenwood — meaningfully above typical; check what's discounted (condition, days-on-market, listing class) to confirm the premium yield is real.
Location & tenants
- Location reads 73/100 on livability (#91 in IN) — a middle-class / working-renter tenant base. Strengths: cost of living A+, housing A+, crime A; Watch: amenities F, commute F, health & safety F.
- Greenwood Community School Corporation (suburban): math 41% / reading 52% proficiency, ranked #88 of 301 in IN (top 29%) — families likely to look elsewhere, expect single-tenant / working-renter base with shorter leases.
- Zoned schools: Southwest Elementary School (math 46% / reading 41%, grade F, #411 of 994 statewide, top 42%, 543 students, 54% FRL); Greenwood Middle School (math 36% / reading 52%, grade D, #87 of 330 statewide, top 27%, 948 students, 53% FRL); Greenwood Community High Sch (math 37% / reading 79%, grade C, #62 of 369 statewide, top 17%, 1,175 students, 43% FRL).
- Market conditions: Rents rising (+1.9%/yr); 80 active listings in the ZIP; 12 comparable units currently listed for rent nearby; rentals at typical pace (median 17d on market — plan ~3-4 weeks tenant-placement turnaround); solid renter incomes; 1,133 units permitted in Johnson County in 2024 (0 in 5+ unit buildings).
Forward outlook
- Local home prices are declining (-3.0%/yr); year-one equity from $2k of loan paydown is wiped out by about $7k of value loss. Plan a longer hold.
- Johnson County population projected at +26% by 2050 — long-run rental-demand tailwind backs the buy-and-hold thesis.
Negotiation context
- It's been on market 66 days — a 6% lower offer ($212k) is reasonable based on typical stale-listing flexibility.
- 3 sale attempts since 19y ago with the ask held roughly flat each time — persistent listings suggest the price (not the market) is what's stuck; bring a comps-based counter.
- Current owner paid $100k; list at $225k implies a 125% gain — meaningful room to come down on a strong offer.
Questions for the listing agent
- What do current leases actually rent for vs. the listed asking? Can we see a recent rent roll and the last 12 months of T-12 income?
- It's been on market 66 days. Have you received any prior offers? Is the seller open to a 26% concession, seller financing, or rate buy-down credit?
- Why hasn't it sold? Are there any deal-killer items the seller is aware of (foundation, flood, title, zoning, code violations)?
- Is there a deadline driving the sale (1031 exchange, divorce, estate, relocation)? That informs how much negotiation room exists.
- Schools are B-rated — typically a magnet for longer-tenancy family renters. What's the average tenant stay here, and is there a school-zone premium baked into asking?
- The area grade is low — what's the realistic commute time and amenity access for the typical tenant pool here? Any planned neighborhood developments (good or bad) we should know about?
- What's the average days-on-market for RENTAL listings here right now (not sales)? A rising rental-DOM trend means longer vacancies and softer asking-rent achievability than the comps imply.
- What's the recent tenant-quality profile in this submarket — average credit score on applications, eviction rate, late-payment / NSF rate, and stable-employment percentage? A property-management company in the area should have these aggregated.
- How much new apartment / multifamily construction is in the pipeline within 1–3 miles? Heavy new supply (>2% of stock underway) typically softens rents 12–24 months out; light construction supports rent growth.
Investment metrics
- 1% rule
- 0.74% ✗
- Cap rate
- 5.85%
- Cash-on-cash
- -1.57%
- DSCR
- 0.93
- GRM
- 11.2
CMA / ARV
- ARV (median comp)
- $245,000
- List price
- $225,000
- Delta
- -8.16%
- Verdict
- FAIR
- Comps
- 3 within 2.0 mi
Projected returns pro-forma
-3.0% appreciation · 1.95% rent growth · sell at horizon
- IRR
- -20.0%
- Equity multiple
- 0.31×
- Total profit
- $-43,514
- Equity at exit
- $33,548
- IRR
- -15.2%
- Equity multiple
- 0.18×
- Total profit
- $-51,940
- Equity at exit
- $19,454
Cash invested: $63,000 (down + closing). Projections, not guarantees.
Landlord ↔ Tenant lean methodology
- Overall (STATE)
- 90 Strongly Landlord-Friendly
- State Indiana
- 90 Strongly Landlord-Friendly · R+11
- County
- — inherits STATE
- City
- — inherits STATE
ZIP-level market 46143
- Rents YoY
- 1.9%
- Active inventory
- 80
- Price-to-rent
- 11.2×
Monthly cashflow live
- Estimated rent
- $1,675 high interval (Pro) →
- Mortgage (P&I)
- −$1,180
- Tax from tax record
- −$132 /mo · $1,579/yr
- Insurance
- −$94
- HOA
- −$0
- Vacancy / Maint / Mgmt
- −$352
- Net cashflow
- $-82
Break-even live
Sensitivity live
| Price | -10% $45 | -5% $-19 | +0% $-82 | +5% $-146 | +10% $-210 |
|---|---|---|---|---|---|
| Rent | -10% $-215 | -5% $-148 | +0% $-82 | +5% $-16 | +10% $50 |
| Rate | -1.0pp $31 | -0.5pp $-25 | base $-82 | +0.5pp $-141 | +1.0pp $-200 |
UW: 25.0% down · 7.5% · 30yr · 1.5% tax · 5.0% vac · 8.0% maint · 8.0% mgmt
Financing live
Cash to close
- Down payment
- $56,250
- Closing costs
- $6,750
- Reserves months
- —
- Total cash needed
- —
Loan-product check · same deal, 3 products live
Conventional
25% down · 7.5% · 30yr
- Down + closing
- —
- Monthly P&I
- —
- Monthly cashflow
- —
- DSCR
- —
- Eligible?
- —
Personal DTI + credit; lowest rate.
DSCR
20% down · 8.5% · 30yr
- Down + closing
- —
- Monthly P&I
- —
- Monthly cashflow
- —
- DSCR
- —
- Eligible?
- —
No personal income docs; deal must DSCR.
Hard money
10% down · 12.0% · 12mo
- Down + closing
- —
- Monthly P&I
- —
- Monthly cashflow
- —
- DSCR
- —
- Eligible?
- —
Short-term bridge; refi at stabilization.
Rent comps 12 comps
| Address | Beds | Baths | Sqft | Rent | $/sqft | DOM | Units | Dist |
|---|---|---|---|---|---|---|---|---|
| 1284 Edgewater Dr Greenwood, IN | 3.0 | 2.5 | 1304 | $1,781 | $1.37 | 25d | 1 | 0.22mi |
| 757 Cypress S Greenwood, IN | 3.0 | 2.0 | 1474 | $1,900 | $1.29 | 45d | 1 | 0.30mi |
| 1335 Millridge Dr Greenwood, IN | 3.0 | 2.0 | 1119 | $1,715 | $1.53 | 6d | 1 | 0.42mi |
| 1225 Freemont Ln Greenwood, IN | 3.0 | 2.5 | 1304 | $1,750 | $1.34 | 12d | 1 | 0.44mi |
| 1285 Kenwood Dr Greenwood, IN | 3.0 | 2.5 | 1470 | $1,755 | $1.19 | 25d | 1 | 0.55mi |
| 1748 Long Lake Dr Greenwood, IN | 3.0 | 2.0 | 1431 | $1,809 | $1.26 | 16d | 1 | 0.55mi |
| 902 Wallington Cir Greenwood, IN | 1.0–3.0 | 1.0–1.5 | 899 | $1,422 | $1.58 | 0d | 23 | 0.59mi |
| 1570 Countryside Dr Greenwood, IN | 1.0–3.0 | 1.0–2.5 | 946 | $1,358 | $1.43 | 22d | 1 | 0.62mi |
| 651 Day Break Dr Greenwood, IN | 3.0 | 2.0 | 1100 | $1,799 | $1.64 | 9d | 1 | 0.62mi |
| 171 1/2 W Broadway St Greenwood, IN | 1.0 | 1.0 | 900 | $1,375 | $1.53 | 25d | 1 | 1.29mi |
| 171 1/2 W Broadway St Greenwood, IN | 1.0 | 1.0 | 900 | $1,375 | $1.53 | 0d | 1 | 1.29mi |
| 20 Village Crossing Dr S Greenwood, IN | 2.0–4.0 | 2.0 | 1103 | $1,435 | $1.30 | 4d | 10 | 1.35mi |
Listing history 6 events
-
2026-05-18status Pending 772-char remark
Show marketing remark (772 chars)
Ideally situated in Greenwood near shopping, dining and everyday conveniences, this centrally located home combines comfort, convenience, and easy living. Featuring 2 bedrooms and 2 full baths, this home offers a comfortable and practical layout suited for a variety of lifestyles. The primary suite includes a walk-in closet and a private bath with the second bedroom and full bath to offer great flexibility for guests or a home office. All kitchen appliances are updated and included! Unwind in the screened-in porch perfect for enjoying fresh air in a peaceful, covered setting. This home is move in ready. NEW ROOF IN APRIL 2026, NEW SHOWER INSTALLED IN PRIMARY BATH IN APRIL 2026, SCREENED-IN PORCH FRESHLY PAINTED, WOOD TRIM AROUND SOME WINDOW'S REPLACED.
-
2026-03-13$225,000 Active 772-char remark
Show marketing remark (772 chars)
Ideally situated in Greenwood near shopping, dining and everyday conveniences, this centrally located home combines comfort, convenience, and easy living. Featuring 2 bedrooms and 2 full baths, this home offers a comfortable and practical layout suited for a variety of lifestyles. The primary suite includes a walk-in closet and a private bath with the second bedroom and full bath to offer great flexibility for guests or a home office. All kitchen appliances are updated and included! Unwind in the screened-in porch perfect for enjoying fresh air in a peaceful, covered setting. This home is move in ready. NEW ROOF IN APRIL 2026, NEW SHOWER INSTALLED IN PRIMARY BATH IN APRIL 2026, SCREENED-IN PORCH FRESHLY PAINTED, WOOD TRIM AROUND SOME WINDOW'S REPLACED.
-
2008-07-29soldstatus $100,000 164-char remark
Show marketing remark (164 chars)
Super 2 bedroom 2 bath home in Clearbrook Village. Best neighbors you could ever ask for in this garden community home. All appliances stay. Home warranty included.
-
2008-06-09$115,000 164-char remark
Show marketing remark (164 chars)
Super 2 bedroom 2 bath home in Clearbrook Village. Best neighbors you could ever ask for in this garden community home. All appliances stay. Home warranty included.
-
2008-05-30historical
-
2007-10-04$119,850
ⓘ Source: listings_history table (triggers on properties + properties_extension) + one-shot
backfill from property_details.listing_events for pre-trigger history.
Tax reassessment forecast IN · Partial reset (capped growth)
- Current annual tax
- $1,579 · $132/mo
- Projected year-2 tax
- $1,746 · $145/mo
- Expected delta
- +$167/yr (+$14/mo · 10.6%)
ⓘ Screening estimate from a state-policy table — verify with the county assessor before closing.
Climate risk First Street
- Flood 1/10 Low FEMA zone X (unshaded) · 0% chance over 30 yrs
- Wildfire 1/10 Low
- Heat 4/10 Moderate 7 d/yr ≥101°F today · 19 d/yr by 30 yrs out
- Wind 2/10 Low 100% chance of damaging wind over 30 yrs
- Air quality 2/10 Low 2 unhealthy d/yr today · 2 by 30 yrs out
Nearby sold comps map
Loading sold comps map…
Walkable amenities ~0.75 mi
Loading nearby amenities…
Taxation est. · year 1
- Rental income
- $20,097
- − Mortgage interest
- −$12,603
- − Property taxes
- −$1,579
- − Insurance
- −$1,125
- − Repairs & maintenance
- −$1,608
- − Management
- −$1,608
- − Depreciation
- −$6,545
- Taxable loss
- −$4,972
- Est. tax savings @ 24.0%
- +$1,193
- After-tax cash flow
- $207/yr
For passive investors: Depreciation is non-cash, so a rental often shows a tax loss while cash-flowing — sheltering income. Rental losses are passive: they offset passive income freely, and up to $25,000/yr can offset ordinary (W-2) income if you actively participate and your MAGI is under $100k (phasing out to $0 by $150k); unused losses carry forward. On sale, claimed depreciation is recaptured at up to 25%, and gains may owe capital-gains tax (a 1031 exchange can defer both). Figures are a year-1 estimate at your 24.0% rate — not tax advice; consult a CPA.
Schools (NCES district)
- District
- Greenwood Community School Corporation
- NCES district ID
- 1804110
- Math proficiency
- 41% ▼ -12.00%
- Reading proficiency
- 52% ▼ -7.00%
- Median HH income
- $48,589
- Composite
- 39.71/100
- National rank
- #3902
- State rank
- #88 of 301 in IN
Livability — Greenwood
- Score
- 73/100
- State rank
- #91
- US rank
- #5255
Category grades
Schools grade is shown separately in the Schools card above.
Census & demographics
- Census place
- Greenwood, IN
- County
- Johnson County · 154,261 people
- City population
- 96,151
- Metro
- Indianapolis-Carmel-Anderson, IN
- Population (ZIP)
- 61,803
- Household income
- $91,496
- Rent vs Own
- Severe rent burden
- 1513.0
Population outlook (Johnson County) Hauer SSP2
- Today (2025)
- 170,080 people
- By 2030
- 179,983 · +5.8%
- By 2040
- 198,580 · +16.8%
- By 2050
- 214,661 · +26.2%
- By 2075
- 247,990 · +45.8%
- By 2100
- 257,821 · +51.6%
Race, ethnicity, and origin ACS 2023
- Neighborhood character
- Predominantly White (79%)
- Race & ethnicity
- White 79% Asian 8% Black 5% Two or more races 5% Hispanic / Latino 5%
- Common ancestry
- Slovak 3% Romanian 2% Lithuanian 1%
- Foreign-born
- 8% · Canada, Jamaica
- Languages at home
- 88% English-only · Other Indo-European 6% Spanish 3% Other Asian/Pacific 1%
Political lean MEDSL · Johnson
- 2024 margin
- Solid R (+34.3) · D 32.0% · R 66.3% · Other 1.7%
- 2008→2024 swing
- -8.9pp toward R · 2008: -25.5pp · 2024: -34.3pp
- All cycles
- 2024: R+34.3 2020: R+34.1 2016: R+42.5 2012: R+38.5 2008: R+25.5
Not yet ingested
- Civics
- —
Market trends
- HPI YoY
- ▼ -206.72%
- Current HPI
- 204.3161
- Rent YoY
- ▲ 1.95%
- Metro
- Indianapolis-Carmel-Anderson, IN
- State GDP YoY
- ▲ 2.90%
- F500 in state
- 18
Industry mix (Fortune 500 HQ in IN)
| Industry | F500 HQs | Revenue |
|---|---|---|
| Industrial Machinery | 2 | $37B |
|
||
| Healthcare | 1 | $177B |
|
||
| Pharmaceuticals | 1 | $45B |
|
||
| Metals / Steel | 1 | $18B |
|
||
| Agriculture | 1 | $17B |
|
||
| Packaging | 1 | $12B |
|
||
Price history
+87.7% since first listed6 events — show timeline
- 2026-05-18 Pending — MIBOR as Distributed by MLS Grid
- 2026-03-13 Listed $225,000 MIBOR as Distributed by MLS Grid
- 2008-07-29 Sold (MLS) $100,000 MIBOR as Distributed by MLS Grid
- 2008-06-09 Listed $115,000 MIBOR as Distributed by MLS Grid
- 2008-05-30 Listing Removed — MIBOR as Distributed by MLS Grid
- 2007-10-04 Listed $119,850 MIBOR as Distributed by MLS Grid
Property tax history
+7.1%/yrLatest (2024): $1,579 · +14.1% YoY. Source: county tax records.
Cash-flow waterfall
monthlySold comps — $/sqft
last 12 mo · ≤1 miLoading sold comps…