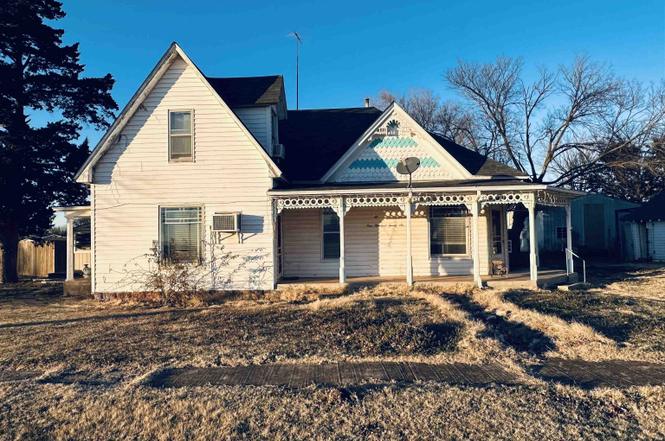
126 W Dogwood Ave · Pond Creek, OK
Flood risk 1/10 · Minimal
- FEMA flood zone
- X
- Chance of flooding over 30 yrs
- 0.0%
- Est. flood insurance / yr
- $507 – $1,088
Fire risk 3/10 · Minor
- Est. fire insurance / yr
- $2,463 – $4,575
Heat risk 6/10 · Moderate
- Hot days now (above 109°F)
- 7 days/yr
- Hot days in 30 yrs
- 18 days/yr
Wind risk 2/10 · Minimal
- Chance of severe wind over 30 yrs
- 2.0%
Air-quality risk 2/10 · Minimal
- Unhealthy air days now
- 1 days/yr
- Unhealthy air days in 30 yrs
- 1 days/yr
Risk factors via First Street. Map © Google.
Why this score? — see what drove the B grade
The composite is a weighted blend of 9 inputs, each scored 0–100. Each bar is that input's sub-score; the figure is the points it added to the 100-point composite (weight × sub-score).
- Cash flow +30.0/30.0
- 1% rule +10.0/10.0
- DSCR +10.0/10.0
- ARV discount +7.5/15.0
- Appreciation +5.0/10.0
- Livability +3.4/5.0
- Schools +3.3/10.0
- Rent growth +2.5/5.0
- Condition / age +2.5/5.0
$85,000
🖨 Deal sheet 📄 Offer letter ✓ Due diligence
Listing remarks
Come check out this charming home, full of character and potential! Sitting on a spacious corner lot, this 1,826 sq ft home offers 3 bedrooms and 2 bathrooms. Enjoy tons of living space on the inside, along with ample space outside! The backyard has a privacy fence, plus a shed and detached garage for ample storage. A standout feature is the additional outbuilding on the west side of the home, thoughtfully converted into a fun recreational room made for entertaining, hobbies, or a home office. With generous space inside and out, this home offers endless possibilities for those looking to add their personal touch while enjoying timeless appeal! Call and schedule your tour today!
Key facts
- Outbuilding
- Privacy fence
- Recreational room
Tags
Property features AI
Exterior
- Parking: Detached 1-car garage
- Security: Smoke detector(s)
- Utilities: Public water; Public sewer
- Home design: Single family residence; Single house; 2 stories; Faces south
- Construction: Vinyl siding; Wood siding; Composition roof
- Exterior features: Covered patio/porch; Storm door(s); Wood fencing; Shed(s); Corner lot
Interior
- Kitchen: Dishwasher; Disposal
- Flooring: Hardwood; Laminate
- Bathrooms: 2 full bathrooms
- Heating & cooling: Window unit(s); Ceiling fan(s)
- Interior features: Dishwasher; Disposal; Ceiling fan(s); Window unit(s); Hardwood floors; Laminate floors; Smoke detector(s)
Neighborhood map
What this means for you Summary
Snapshot
- This is a 3-bed/2.0-bath single-family listed at $85k.
Deal economics
- At list price, monthly cash flow is $491 ($6k/yr) — positive.
- The deal already cash-flows at list — no discount required.
- Meets the 1% rule at list price ($1k rent vs $85k).
- Recommended offer: $75k (12.0% below list) — sets the bar for market timing.
Location & tenants
- Location reads 67/100 on livability (#83 in OK) — a middle-class / working-renter tenant base. Strengths: cost of living A+, housing A+, crime A; Watch: schools D, amenities F, commute F.
- Pond Creek-Hunter (rural): math 30% / reading 40% proficiency, ranked #161 of 513 in OK (top 31%) — families likely to look elsewhere, expect single-tenant / working-renter base with shorter leases.
- Market conditions: 3 active listings in the ZIP.
Forward outlook
- In year one you build about $3k of equity ($588 loan paydown + $3k appreciation (3.0% local appreciation)).
- Grant County population projected at +4% by 2050 — modest demand growth; plan on rents tracking national, not racing it.
- At projected returns (3.0% appreciation + 3.0% rent growth), your $24k cash investment doubles in ~3 years — after that, you're playing with house money.
- By year 10, paydown + projected appreciation supports a ~$30k cash-out refi (75% LTV) — recoverable capital for the next deal without selling this one.
Negotiation context
- It's been on market 156 days — a 12% lower offer ($75k) is reasonable based on typical stale-listing flexibility.
- 2 sale attempts; this cycle's ask has dropped $21k (20%) from the opening price — seller is motivated, your offer sets the floor, not the list.
- Current owner paid $32k; list at $85k implies a 166% gain — meaningful room to come down on a strong offer.
Risks & watch-outs
- Watch-outs: built in 1930 — expect roof / HVAC / electrical / plumbing capex.
- Climate carrying-cost: extreme-heat days projected 7→18/yr by 2055 (HVAC capex compounding) — expect insurance premiums to compound above CPI over the hold.
Questions for the listing agent
- It's been on market 156 days. Have you received any prior offers? Is the seller open to a 12% concession, seller financing, or rate buy-down credit?
- Built in 1930 — when were the roof, HVAC, electrical panel, plumbing, and water heater last replaced?
- Why hasn't it sold? Are there any deal-killer items the seller is aware of (foundation, flood, title, zoning, code violations)?
- Is there a deadline driving the sale (1031 exchange, divorce, estate, relocation)? That informs how much negotiation room exists.
- Schools are D-rated, which usually means shorter tenancies and higher turnover. Who's the typical renter profile here, and what's been the actual vacancy rate?
- What's the average days-on-market for RENTAL listings here right now (not sales)? A rising rental-DOM trend means longer vacancies and softer asking-rent achievability than the comps imply.
- What's the recent tenant-quality profile in this submarket — average credit score on applications, eviction rate, late-payment / NSF rate, and stable-employment percentage? A property-management company in the area should have these aggregated.
- How much new for-sale + rental construction is in the pipeline within 1–3 miles? Heavy new supply typically softens prices + rents 12–24 months out; constrained supply supports both.
Investment metrics
- 1% rule
- 1.50% ✓
- Cap rate
- 13.23%
- Cash-on-cash
- 24.76%
- DSCR
- 2.10
- GRM
- 5.6
CMA / ARV
- ARV (on-the-fly)
- $239,206
- Comps found
- 2
Show comp detail 2 sales within ~0.75 mi
| Address | Dist | Beds/Ba | Sqft | Sold | Price | $/sf | Match |
|---|---|---|---|---|---|---|---|
| 519 S Apache St | 0.16mi | 3/2.0 | 1,560 (-15%) | 2mo | $205,000 | $131 | 67 |
| 420 E Aspen Ave | 0.46mi | 3/2.0 | 2,025 (+11%) | 6mo | $230,000 | $114 | 56 |
Match score weights: distance 35% · size 25% · config 20% · recency 20%. Top-matched comps best support the ARV.
Projected returns pro-forma
3.0% appreciation · 3.0% rent growth · sell at horizon
- IRR
- 30.8%
- Equity multiple
- 2.74×
- Total profit
- $41,497
- Equity at exit
- $38,220
- IRR
- 31.2%
- Equity multiple
- 5.36×
- Total profit
- $103,860
- Equity at exit
- $58,901
Cash invested: $23,800 (down + closing). Projections, not guarantees.
Landlord ↔ Tenant lean methodology
- Overall (STATE)
- 83 Strongly Landlord-Friendly
- State Oklahoma
- 83 Strongly Landlord-Friendly · R+20
- County
- — inherits STATE
- City
- — inherits STATE
ZIP-level market 73766
- Active inventory
- 3
- Price-to-rent
- 5.6×
Monthly cashflow live
- Estimated rent
- $1,273 medium interval (Pro) →
- Mortgage (P&I)
- −$446
- Tax from tax record
- −$33 /mo · $399/yr
- Insurance
- −$35
- HOA
- −$0
- Vacancy / Maint / Mgmt
- −$267
- Net cashflow
- $491
Break-even live
UW: 25.0% down · 7.5% · 30yr · 1.5% tax · 5.0% vac · 8.0% maint · 8.0% mgmt
Financing live
Cash to close
- Down payment
- $21,250
- Closing costs
- $2,550
- Reserves months
- —
- Total cash needed
- —
Loan-product check · same deal, 3 products live
Conventional
25% down · 7.5% · 30yr
- Down + closing
- —
- Monthly P&I
- —
- Monthly cashflow
- —
- DSCR
- —
- Eligible?
- —
Personal DTI + credit; lowest rate.
DSCR
20% down · 8.5% · 30yr
- Down + closing
- —
- Monthly P&I
- —
- Monthly cashflow
- —
- DSCR
- —
- Eligible?
- —
No personal income docs; deal must DSCR.
Hard money
10% down · 12.0% · 12mo
- Down + closing
- —
- Monthly P&I
- —
- Monthly cashflow
- —
- DSCR
- —
- Eligible?
- —
Short-term bridge; refi at stabilization.
Listing history 23 events
-
2026-06-19days on market $85,000 Active 156 DOM
-
2026-06-18days on market $85,000 Active 155 DOM
-
2026-06-17days on market $85,000 Active 154 DOM
-
2026-06-16days on market $85,000 Active 153 DOM
-
2026-06-15days on market $85,000 Active 152 DOM
-
2026-06-14days on market $85,000 Active 150 DOM
-
2026-06-12days on market $85,000 Active 149 DOM
-
2026-06-09days on market $85,000 Active 146 DOM
-
2026-06-08days on market $85,000 Active 145 DOM
-
2026-06-07days on market $85,000 Active 144 DOM
-
2026-06-05days on market $85,000 Active 141 DOM
-
2026-06-02days on market $85,000 Active 139 DOM
-
2026-06-01days on market $85,000 Active 138 DOM
-
2026-05-31days on market $85,000 Active 137 DOM
-
2026-05-30days on market $85,000 Active 136 DOM
-
2026-05-11price $85,000
-
2026-04-16price $89,000
-
2026-03-24status Active
-
2026-03-14historical Active Under Contract
-
2026-02-27price $90,000
-
2026-02-17price $100,900
-
2026-01-13$105,900 Active
-
2007-12-31soldstatus $32,000
ⓘ Source: listings_history table (triggers on properties + properties_extension) + one-shot
backfill from property_details.listing_events for pre-trigger history.
Tax reassessment forecast OK · Resets to sale price
- Current annual tax
- $399 · $33/mo
- Projected year-2 tax
- $765 · $64/mo
- Expected delta
- +$366/yr (+$30/mo · 91.7%)
ⓘ Screening estimate from a state-policy table — verify with the county assessor before closing.
Climate risk First Street
- Flood 1/10 Low FEMA zone X · 0% chance over 30 yrs
- Wildfire 3/10 Moderate
- Heat 6/10 Major 7 d/yr ≥109°F today · 18 d/yr by 30 yrs out
- Wind 2/10 Low 2% chance of damaging wind over 30 yrs
- Air quality 2/10 Low 1 unhealthy d/yr today · 1 by 30 yrs out
Nearby sold comps map
Loading sold comps map…
Walkable amenities ~0.75 mi
Loading nearby amenities…
Taxation est. · year 1
- Rental income
- $15,275
- − Mortgage interest
- −$4,761
- − Property taxes
- −$399
- − Insurance
- −$425
- − Repairs & maintenance
- −$1,222
- − Management
- −$1,222
- − Depreciation
- −$2,473
- Taxable income
- $4,773
- Est. tax owed @ 24.0%
- −$1,145
- After-tax cash flow
- $4,749/yr
For passive investors: Depreciation is non-cash, so a rental often shows a tax loss while cash-flowing — sheltering income. Rental losses are passive: they offset passive income freely, and up to $25,000/yr can offset ordinary (W-2) income if you actively participate and your MAGI is under $100k (phasing out to $0 by $150k); unused losses carry forward. On sale, claimed depreciation is recaptured at up to 25%, and gains may owe capital-gains tax (a 1031 exchange can defer both). Figures are a year-1 estimate at your 24.0% rate — not tax advice; consult a CPA.
Schools (NCES district)
- District
- Pond Creek-Hunter
- NCES district ID
- 4024720
- Math proficiency
- 30% ▬ 0.00%
- Reading proficiency
- 40% ▬ 0.00%
- Median HH income
- $48,980
- Composite
- 32.86/100
- National rank
- #10727
- State rank
- #161 of 513 in OK
Livability — Pond Creek
- Score
- 67/100
- State rank
- #83
- US rank
- #10261
Category grades
Schools grade is shown separately in the Schools card above.
Census & demographics
- Census place
- Pond Creek, OK
- Population (ZIP)
- 1,097
Population outlook (Grant County) Hauer SSP2
- Today (2025)
- 4,375 people
- By 2030
- 4,328 · -1.1%
- By 2040
- 4,348 · -0.6%
- By 2050
- 4,536 · +3.7%
- By 2075
- 5,336 · +22.0%
- By 2100
- 5,501 · +25.7%
Race, ethnicity, and origin ACS 2023
- Neighborhood character
- Predominantly White (87%)
- Race & ethnicity
- White 87% Two or more races 7% Hispanic / Latino 4% Black 2% Native American 1%
- Common ancestry
- Slovak 3% Iranian 3% Romanian 3%
- Languages at home
- 98% English-only · Spanish 2% German/W. Germanic 1%
Political lean MEDSL · Grant
- 2024 margin
- Solid R (+70.5) · D 13.9% · R 84.4% · Other 1.7%
- 2008→2024 swing
- -14.3pp toward R · 2008: -56.3pp · 2024: -70.5pp
- All cycles
- 2024: R+70.5 2020: R+73.5 2016: R+70.0 2012: R+62.0 2008: R+56.3
Not yet ingested
- Civics
- —
Market trends
- HPI YoY
- —
- Current HPI
- —
- Rent YoY
- —
- Metro
- —
- State GDP YoY
- ▲ 1.55%
- F500 in state
- 6
Industry mix (Fortune 500 HQ in OK)
| Industry | F500 HQs | Revenue |
|---|---|---|
| Energy | 3 | $48B |
|
||
Price history
+165.6% since first listed8 events — show timeline
- 2026-05-11 Price Changed $85,000 NWOAR
- 2026-04-16 Price Changed $89,000 NWOAR
- 2026-03-24 Relisted — NWOAR
- 2026-03-14 Contingent — NWOAR
- 2026-02-27 Price Changed $90,000 NWOAR
- 2026-02-17 Price Changed $100,900 NWOAR
- 2026-01-13 Listed $105,900 NWOAR
- 2007-12-31 Sold (Public Records) $32,000 Public Records
Property tax history
+4.0%/yrLatest (2025): $399 · +11.1% YoY. Source: county tax records.
Cash-flow waterfall
monthlySold comps — $/sqft
last 12 mo · ≤1 miLoading sold comps…