38055 Leverette · Clinton, MI
Flood risk No data
- FEMA flood zone
- —
- Chance of flooding over 30 yrs
- —
- Est. flood insurance / yr
- —
Fire risk No data
- Est. fire insurance / yr
- —
Heat risk No data
- Hot days now (above threshold)
- —
- Hot days in 30 yrs
- —
Wind risk No data
- Chance of severe wind over 30 yrs
- —
Air-quality risk No data
- Unhealthy air days now
- —
- Unhealthy air days in 30 yrs
- —
Risk factors via First Street. Map © Google.
Why this score? — see what drove the B- grade
The composite is a weighted blend of 9 inputs, each scored 0–100. Each bar is that input's sub-score; the figure is the points it added to the 100-point composite (weight × sub-score).
- Cash flow +30.0/30.0
- 1% rule +10.0/10.0
- DSCR +10.0/10.0
- ARV discount +7.5/15.0
- Schools +4.0/10.0
- Livability +3.5/5.0
- Condition / age +2.5/5.0
- Rent growth +2.3/5.0
- Appreciation +0.0/10.0
$52,900
🖨 Deal sheet 📄 Offer letter ✓ Due diligence
Listing remarks
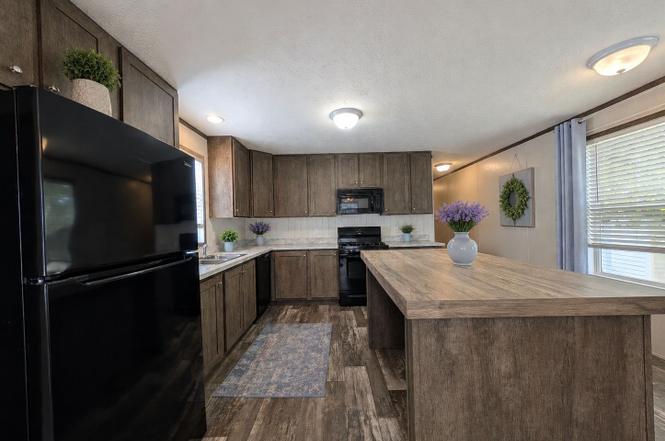
Step inside and discover a thoughtfully designed 2 bedroom, 2 bathroom home that blends style, comfort, and functionality. The spacious kitchen serves as the heart of the home, featuring a large island with seating space, generous countertops, and plenty of room for meal preparation, entertaining, or everyday living. An open concept layout creates a seamless flow between the kitchen and living areas, offering flexibility for a variety of furniture arrangements and lifestyles. Both full bathrooms provide convenience and comfort, while the well planned floor plan maximizes usable space throughout the home. Modern finishes, abundant storage, and inviting living spaces make this home as practic
Key facts
- Built 2025
- Listed 111 days
Property features AI
Finance
- Other: Address: 38055 Leverette, Clinton Township MI 48038; Status: Active; Last modified: 2026-06-12
- Financial info: List price $52,900
Exterior
- Home design: Single-section 2-bedroom, 2-bath plan; Spec inventory
- Exterior features: Living area 960
Interior
- Bedrooms: 2 bedrooms
- Bathrooms: 2 full bathrooms
- Interior features: Dishwasher; Disposal; Refrigerator
Neighborhood map
What this means for you Summary
Snapshot
- This is a 2-bed/2.0-bath single-family listed at $53k.
Deal economics
- At list price, monthly cash flow is $735 ($9k/yr) — positive.
- The deal already cash-flows at list — no discount required.
- Meets the 1% rule at list price ($1k rent vs $53k).
- Recommended offer: $48k (9.0% below list) — sets the bar for market timing.
- Cap rate 23.0% vs local median 3.3% in Clinton — top-decile yield for the area; either an underpriced asset or a hidden risk that comps aren't pricing in. Stress-test before assuming the spread holds.
Location & tenants
- Location reads 70/100 on livability (#315 in MI) — a middle-class / working-renter tenant base. Strengths: cost of living A+, housing A+, health & safety A+; Watch: amenities F, commute F.
- Chippewa Valley Schools (suburban): math 39% / reading 50% proficiency, ranked #133 of 540 in MI (top 25%) — families likely to look elsewhere, expect single-tenant / working-renter base with shorter leases.
- Market conditions: Rents soft (-0.9%/yr); 257 active listings in the ZIP; 35 comparable units currently listed for rent nearby; rentals at typical pace (median 24d on market — plan ~3-4 weeks tenant-placement turnaround); 49% of comp listings sitting > 30 days — soft ceiling on asking rent; solid renter incomes; 1,321 units permitted in Macomb County in 2024 (86 in 5+ unit buildings).
Forward outlook
- Local home prices are declining (-3.0%/yr); year-one equity from $366 of loan paydown is wiped out by about $2k of value loss. Plan a longer hold.
- Macomb County population projected at +9% by 2050 — modest demand growth; plan on rents tracking national, not racing it.
- At projected returns (-3.0% appreciation + 0.0% rent growth), your $15k cash investment doubles in ~2 years — after that, you're playing with house money.
Negotiation context
- It's been on market 111 days — a 9% lower offer ($48k) is reasonable based on typical stale-listing flexibility.
Questions for the listing agent
- It's been on market 111 days. Have you received any prior offers? Is the seller open to a 9% concession, seller financing, or rate buy-down credit?
- Why hasn't it sold? Are there any deal-killer items the seller is aware of (foundation, flood, title, zoning, code violations)?
- Is there a deadline driving the sale (1031 exchange, divorce, estate, relocation)? That informs how much negotiation room exists.
- Schools are B-rated — typically a magnet for longer-tenancy family renters. What's the average tenant stay here, and is there a school-zone premium baked into asking?
- What's the average days-on-market for RENTAL listings here right now (not sales)? A rising rental-DOM trend means longer vacancies and softer asking-rent achievability than the comps imply.
- What's the recent tenant-quality profile in this submarket — average credit score on applications, eviction rate, late-payment / NSF rate, and stable-employment percentage? A property-management company in the area should have these aggregated.
- How much new for-sale + rental construction is in the pipeline within 1–3 miles? Heavy new supply typically softens prices + rents 12–24 months out; constrained supply supports both.
Investment metrics
- 1% rule
- 2.63% ✓
- Cap rate
- 22.97%
- Cash-on-cash
- 59.57%
- DSCR
- 3.65
- GRM
- 3.2
CMA / ARV
- ARV (on-the-fly)
- $173,760
- Comps found
- 3
Show comp detail 3 sales within ~0.75 mi
| Address | Dist | Beds/Ba | Sqft | Sold | Price | $/sf | Match |
|---|---|---|---|---|---|---|---|
| 38021 Orleans St. St | 0.16mi | 3/2.0 (+1) | 1,056 (+10%) | 7mo | $41,000 | $39 | 65 |
| 37539 Palmer Woods Blvd | 0.62mi | 2/1.0 | 884 (-8%) | 10mo | $160,000 | $181 | 46 |
| 37474 Utica Rd | 0.63mi | 3/1.0 (+1) | 900 (-6%) | 8mo | $178,818 | $199 | 44 |
Match score weights: distance 35% · size 25% · config 20% · recency 20%. Top-matched comps best support the ARV.
Projected returns pro-forma
-3.0% appreciation · 0.0% rent growth · sell at horizon
- IRR
- 54.8%
- Equity multiple
- 3.31×
- Total profit
- $34,197
- Equity at exit
- $7,888
- IRR
- 58.8%
- Equity multiple
- 6.02×
- Total profit
- $74,384
- Equity at exit
- $4,574
Cash invested: $14,812 (down + closing). Projections, not guarantees.
Landlord ↔ Tenant lean methodology
- Overall (STATE)
- 62 Landlord-Friendly
- State Michigan
- 62 Landlord-Friendly · EVEN
- County
- — inherits STATE
- City
- — inherits STATE
ZIP-level market 48038
- Rents YoY
- -0.9%
- Active inventory
- 257
- Price-to-rent
- 3.2×
Monthly cashflow live
- Estimated rent
- $1,394 high interval (Pro) →
- Mortgage (P&I)
- −$277
- Tax est. 1.5%
- −$66 /mo · $794/yr
- Insurance
- −$22
- HOA
- −$0
- Vacancy / Maint / Mgmt
- −$293
- Net cashflow
- $735
Break-even live
UW: 25.0% down · 7.5% · 30yr · 1.5% tax · 5.0% vac · 8.0% maint · 8.0% mgmt
Financing live
Cash to close
- Down payment
- $13,225
- Closing costs
- $1,587
- Reserves months
- —
- Total cash needed
- —
Loan-product check · same deal, 3 products live
Conventional
25% down · 7.5% · 30yr
- Down + closing
- —
- Monthly P&I
- —
- Monthly cashflow
- —
- DSCR
- —
- Eligible?
- —
Personal DTI + credit; lowest rate.
DSCR
20% down · 8.5% · 30yr
- Down + closing
- —
- Monthly P&I
- —
- Monthly cashflow
- —
- DSCR
- —
- Eligible?
- —
No personal income docs; deal must DSCR.
Hard money
10% down · 12.0% · 12mo
- Down + closing
- —
- Monthly P&I
- —
- Monthly cashflow
- —
- DSCR
- —
- Eligible?
- —
Short-term bridge; refi at stabilization.
Rent comps 35 comps
| Address | Beds | Baths | Sqft | Rent | $/sqft | DOM | Units | Dist |
|---|---|---|---|---|---|---|---|---|
| 38055 Leverette Ave Unit 491 Clinton Township, MI | 2.0 | 2.0 | 960 | $1,399 | $1.46 | 4d | 1 | 0.01mi |
| 15836 Croatia Dr Unit 544 Clinton Township, MI | 2.0 | 1.0 | 840 | $1,349 | $1.61 | 43d | 1 | 0.03mi |
| 15974 Villaire Ave Unit 445 Clinton Township, MI | 2.0 | 1.0 | 768 | $1,319 | $1.72 | 2d | 1 | 0.05mi |
| 16016 Villaire Ave Unit 402 Clinton Township, MI | 2.0 | 2.0 | 960 | $1,399 | $1.46 | 4d | 1 | 0.07mi |
| 38019 Leverette Ave Unit 500 Clinton Township, MI | 2.0 | 2.0 | 960 | $1,389 | $1.45 | 1d | 1 | 0.07mi |
| 16011 Villaire Ave Unit 682 Clinton Township, MI | 2.0 | 2.0 | 960 | $1,399 | $1.46 | 1d | 1 | 0.08mi |
| 38100 Ducharme Dr Unit 476 Clinton Township, MI | 3.0 | 2.0 | 1056 | $1,549 | $1.47 | 2d | 1 | 0.08mi |
| 38013 Chilver Ave Unit 381 Clinton Township, MI | 2.0 | 2.0 | 960 | $1,399 | $1.46 | 43d | 1 | 0.10mi |
| 16035 Villaire Ave Unit 688 Clinton Township, MI | 2.0 | 2.0 | 960 | $1,399 | $1.46 | 43d | 1 | 0.11mi |
| 38044 Johannes Dr Unit 521 Clinton Township, MI | 2.0 | 2.0 | 960 | $1,399 | $1.46 | 43d | 1 | 0.13mi |
| 15868 Marentette Dr Unit 339 Clinton Township, MI | 2.0 | 2.0 | 960 | $1,399 | $1.46 | 12d | 1 | 0.14mi |
| 38033 Ducharme Dr Unit 604 Clinton Twp, MI | 2.0 | 2.0 | 960 | $1,499 | $1.56 | 43d | 1 | 0.14mi |
| 15835 Marentette Dr Unit 512 Clinton Township, MI | 2.0 | 2.0 | 960 | $1,399 | $1.46 | 43d | 1 | 0.15mi |
| 38051 Saint Tropez Dr Unit 990 Clinton Township, MI | 3.0 | 2.0 | 1120 | $1,549 | $1.38 | 2d | 1 | 0.15mi |
| 15811 Villaire Ave Unit 643 Clinton Township, MI | 2.0 | 2.0 | 960 | $1,399 | $1.46 | 43d | 1 | 0.18mi |
| 38053 Orleans St Unit 124 Clinton Township, MI | 2.0 | 2.0 | 960 | $1,499 | $1.56 | 14d | 1 | 0.19mi |
| 15386 Danseur Dr Unit 822 Clinton Township, MI | 2.0 | 2.0 | 960 | $1,399 | $1.46 | 43d | 1 | 0.20mi |
| 15377 Dominique Dr Unit 828 Clinton Township, MI | 3.0 | 2.0 | 1056 | $1,549 | $1.47 | 1d | 1 | 0.21mi |
| 16151 Notre Dame St Unit 245 Clinton Township, MI | 2.0 | 2.0 | 960 | $1,309 | $1.36 | 43d | 1 | 0.22mi |
| 15368 Dominique Dr Unit 868 Clinton Township, MI | 3.0 | 2.0 | 1056 | $1,549 | $1.47 | 43d | 1 | 0.22mi |
| 16142 Normandy St Unit 249 Clinton Township, MI | 2.0 | 2.0 | 960 | $1,399 | $1.46 | 43d | 1 | 0.25mi |
| 15353 Dominique Dr Unit 834 Clinton Township, MI | 3.0 | 2.0 | 1056 | $1,549 | $1.47 | 24d | 1 | 0.26mi |
| 15329 Danseur Dr Unit 795 Clinton Twp, MI | 3.0 | 2.0 | 1056 | $1,549 | $1.47 | 2d | 1 | 0.32mi |
| 38029 Versailles St Unit 49 Clinton Township, MI | 2.0 | 2.0 | 960 | $1,369 | $1.43 | 4d | 1 | 0.37mi |
| 38271 Fairway Ct Clinton Township, MI | 2.0 | 1.0 | 925 | $1,188 | $1.28 | 43d | 2 | 0.76mi |
| 38271 Fairway Ct Unit 100A Clinton Township, MI | 2.0 | 1.0 | 925 | $1,250 | $1.35 | 24d | 1 | 0.76mi |
| 38280 Fairway Ct Unit 140B Clinton Township, MI | 2.0 | 1.0 | 1000 | $1,150 | $1.15 | 43d | 1 | 0.79mi |
| 38290 Fairway Ct Clinton Township, MI | 1.0 | 1.0 | 625 | $912 | $1.46 | 10d | 2 | 0.80mi |
| 17010 Clinton River Rd Clinton Township, MI | 2.0 | 1.0 | 962 | $1,325 | $1.38 | 14d | 2 | 0.82mi |
| 17010 Clinton River Rd Clinton Township, MI | 2.0 | 1.0 | 962 | $1,250 | $1.30 | 43d | 2 | 0.82mi |
| 38255 Fairway Ct Clinton Twp, MI | 2.0 | 1.0 | 923 | $1,250 | $1.35 | 12d | 1 | 0.83mi |
| 36607 Holiday Cir E Clinton Twp, MI | 1.0–2.0 | 1.0 | 775 | $1,249 | $1.61 | 43d | 2 | 1.00mi |
| 17001 Eleanor Dr S Clinton Twp, MI | 1.0–2.0 | 1.0 | 790 | $1,200 | $1.52 | 43d | 1 | 1.30mi |
| 0 Woodland MDWS Update, MI | 1.0–2.0 | 1.0–2.0 | 1002 | $2,052 | $2.05 | 1d | 9 | 1.31mi |
| 16695 Washington Sq Clinton Twp, MI | 1.0–2.0 | 1.0 | 760 | $1,350 | $1.78 | 43d | 1 | 1.46mi |
Listing history 7 events
-
2026-06-18days on market $52,900 Active 111 DOM
-
2026-06-17days on market $52,900 Active 110 DOM
-
2026-06-16days on market $52,900 Active 109 DOM
-
2026-06-15days on market $52,900 Active 108 DOM
-
2026-06-13days on market $52,900 Active 106 DOM
-
2026-06-13remarks 699-char remark
-
2026-06-13$52,900 Active 105 DOM
ⓘ Source: listings_history table (triggers on properties + properties_extension) + one-shot
backfill from property_details.listing_events for pre-trigger history.
Nearby sold comps map
Loading sold comps map…
Walkable amenities ~0.75 mi
Loading nearby amenities…
Taxation est. · year 1
- Rental income
- $16,722
- − Mortgage interest
- −$2,963
- − Property taxes
- −$794
- − Insurance
- −$264
- − Repairs & maintenance
- −$1,338
- − Management
- −$1,338
- − Depreciation
- −$1,539
- Taxable income
- $8,487
- Est. tax owed @ 24.0%
- −$2,037
- After-tax cash flow
- $6,787/yr
For passive investors: Depreciation is non-cash, so a rental often shows a tax loss while cash-flowing — sheltering income. Rental losses are passive: they offset passive income freely, and up to $25,000/yr can offset ordinary (W-2) income if you actively participate and your MAGI is under $100k (phasing out to $0 by $150k); unused losses carry forward. On sale, claimed depreciation is recaptured at up to 25%, and gains may owe capital-gains tax (a 1031 exchange can defer both). Figures are a year-1 estimate at your 24.0% rate — not tax advice; consult a CPA.
Schools (NCES district)
- District
- Chippewa Valley Schools
- NCES district ID
- 2609570
- Math proficiency
- 39% ▼ -10.00%
- Reading proficiency
- 50% ▼ -4.00%
- Median HH income
- $64,964
- Composite
- 39.61/100
- National rank
- #3922
- State rank
- #133 of 540 in MI
Livability — Clinton
- Score
- 70/100
- State rank
- #315
- US rank
- #7703
Category grades
Schools grade is shown separately in the Schools card above.
Census & demographics
- County
- Macomb County · 638,552 people
- Metro
- Detroit-Warren-Dearborn, MI
- Population (ZIP)
- 44,422
- Household income
- $78,567
- Rent vs Own
- Severe rent burden
- 1788.0
Population outlook (Macomb County) Hauer SSP2
- Today (2025)
- 925,296 people
- By 2030
- 948,226 · +2.5%
- By 2040
- 983,961 · +6.3%
- By 2050
- 1,010,200 · +9.2%
- By 2075
- 1,076,222 · +16.3%
- By 2100
- 1,077,065 · +16.4%
Race, ethnicity, and origin ACS 2023
- Neighborhood character
- Predominantly White (77%)
- Race & ethnicity
- White 77% Black 11% Two or more races 7% Asian 3% Hispanic / Latino 2%
- Common ancestry
- Romanian 16% Lithuanian 3% Iranian 2%
- Foreign-born
- 11% · Canada, Vietnam
- Languages at home
- 86% English-only · Other Indo-European 5% Russian/Polish/Slavic 2% Arabic 2%
Political lean MEDSL · Macomb
- 2024 margin
- R (+13.7) · D 42.2% · R 55.9% · Other 1.9%
- 2008→2024 swing
- -22.3pp toward R · 2008: 8.6pp · 2024: -13.7pp
- All cycles
- 2024: R+13.7 2020: R+8.1 2016: R+11.6 2012: D+4.0 2008: D+8.6
Not yet ingested
- Civics
- —
Market trends
- HPI YoY
- ▼ -212.31%
- Current HPI
- 261.3877
- Rent YoY
- ▼ -0.92%
- Metro
- Detroit-Warren-Dearborn, MI
- State GDP YoY
- ▲ 1.37%
- F500 in state
- 28
Industry mix (Fortune 500 HQ in MI)
| Industry | F500 HQs | Revenue |
|---|---|---|
| Automotive Parts | 3 | $48B |
|
||
| Automotive | 2 | $372B |
|
||
| Chemicals | 1 | $45B |
|
||
| Automotive Retail | 1 | $29B |
|
||
| Healthcare / Medical Devices | 1 | $23B |
|
||
| Automotive Technology | 1 | $20B |
|
||
Cash-flow waterfall
monthlySold comps — $/sqft
last 12 mo · ≤1 miLoading sold comps…