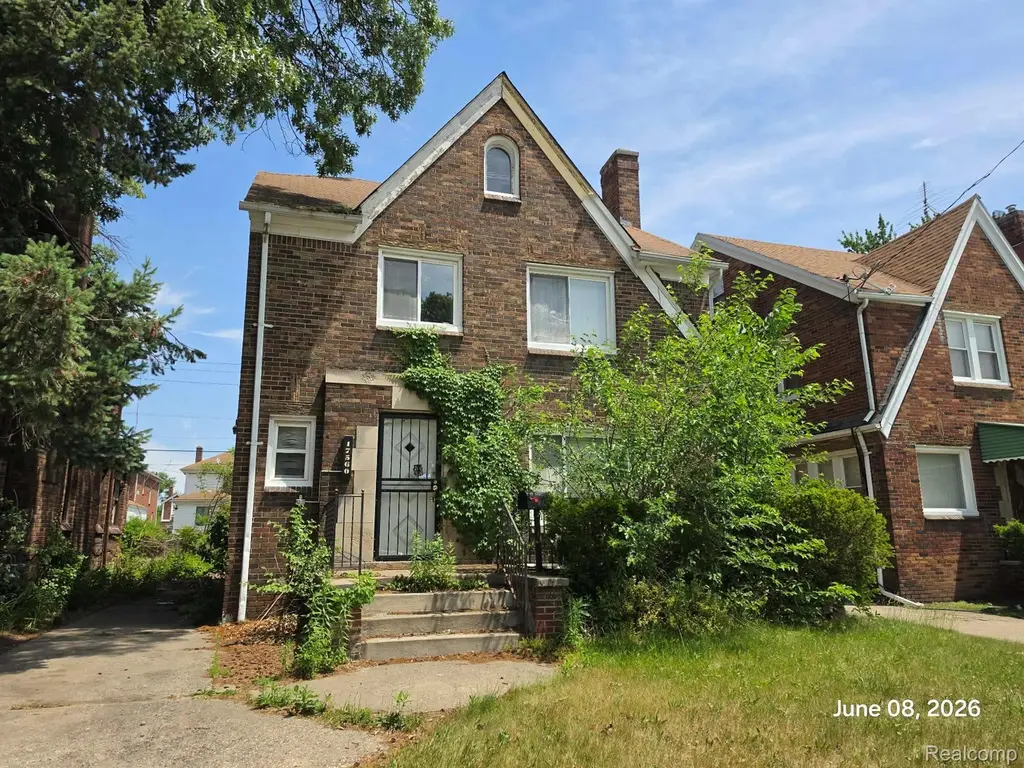
17560 Greenlawn St · Detroit, MI
Flood risk 1/10 · Minimal
- FEMA flood zone
- X (unshaded)
- Chance of flooding over 30 yrs
- 0.0%
- Est. flood insurance / yr
- $473 – $860
Fire risk 1/10 · Minimal
- Est. fire insurance / yr
- $784 – $1,456
Heat risk 3/10 · Minor
- Hot days now (above 97°F)
- 7 days/yr
- Hot days in 30 yrs
- 15 days/yr
Wind risk 2/10 · Minimal
- Chance of severe wind over 30 yrs
- —
Air-quality risk 3/10 · Minor
- Unhealthy air days now
- 2 days/yr
- Unhealthy air days in 30 yrs
- 5 days/yr
Risk factors via First Street. Map © Google.
Why this score? — see what drove the B+ grade
The composite is a weighted blend of 9 inputs, each scored 0–100. Each bar is that input's sub-score; the figure is the points it added to the 100-point composite (weight × sub-score).
- Cash flow +29.5/30.0
- ARV discount +15.0/15.0
- 1% rule +10.0/10.0
- DSCR +10.0/10.0
- Livability +3.7/5.0
- Rent growth +3.4/5.0
- Condition / age +2.5/5.0
- Schools +1.3/10.0
- Appreciation +0.0/10.0
$124,900
🖨 Deal sheet (PDF) 📄 Offer letter ✓ Due diligence
Listing remarks MLS
Investment Opportunity! Brick colonial in the Bagley District. Property is in need of complete rehab. Warranty deed at closing with one exception for a quiet title currently in process. Member of the selling entity is a licensed real estate broker.
Key facts
- Complete rehab
- Bagley district
- Brick colonial
Tags
Property features AI
Exterior
- Parking: Detached 2-car garage
- Utilities: Public water; Public sewer
- Home design: Single-family residence; Ground-level entry with steps; Above-grade finished area about 2,200; Below-grade finished area about 650
- Construction: Brick construction; Block and brick/mortar foundation
- Exterior features: Paved road access; Lot approximately 37 x 143 (0.12 acres)
Interior
- Bathrooms: 1 full bathroom; 1 half bathroom
- Heating & cooling: Natural gas heating; Steam heating; No central cooling
- Interior features: Partially finished basement; Basement present
Neighborhood map
What this means for you Summary
Snapshot
- This is a 5-bed/2.0-bath single-family listed at $125k.
Deal economics
- At list price, monthly cash flow is $446 ($5k/yr) — positive.
- The deal already cash-flows at list — no discount required.
- Meets the 1% rule at list price ($2k rent vs $125k).
Location & tenants
- Location reads 73/100 on livability (#218 in MI) — a middle-class / working-renter tenant base. Strengths: amenities A+, commute A+, cost of living A+; Watch: schools F, crime F, employment F.
- Detroit Public Schools Community District (urban): math 10% / reading 24% proficiency, ranked #499 of 540 in MI (top 92%) — low school quality limits family demand, transient renter base, plan for 1-2y turnover; 90% free/reduced lunch — lower-income household profile, screen leases tightly.
- Market conditions: Rents rising (+3.4%/yr); 349 active listings in the ZIP; 3 comparable units currently listed for rent nearby; rentals leasing fast (median 5d on market — plan ~1-2 weeks tenant-placement turnaround); 2,639 units permitted in Wayne County in 2024 (1,216 in 5+ unit buildings).
- This rent runs 40% of the median local income ($58k/yr) — at the standard rent-burdened threshold; future hikes will face affordability resistance.
Forward outlook
- Local home prices are declining (-3.0%/yr); year-one equity from $864 of loan paydown is wiped out by about $4k of value loss. Plan a longer hold.
- Wayne County population projected at -17% by 2050 — secular population decline; favor cash flow + early exit over multi-decade hold.
- At projected returns (-3.0% appreciation + 3.4% rent growth), your $35k cash investment doubles in ~8 years — after that, you're playing with house money.
Negotiation context
- Only 5 days on market — expect competitive offers; lowballing is unlikely to land.
- 5 sale attempts since 20y ago with the ask held roughly flat each time — persistent listings suggest the price (not the market) is what's stuck; bring a comps-based counter.
Risks & watch-outs
- Watch-outs: property tax is 3.7% of price; built in 1929 — expect roof / HVAC / electrical / plumbing capex.
Questions for the listing agent
- Built in 1929 — when were the roof, HVAC, electrical panel, plumbing, and water heater last replaced?
- Property tax is high relative to price — has the assessment been appealed recently, and will the sale trigger a re-assessment?
- Is there a deadline driving the sale (1031 exchange, divorce, estate, relocation)? That informs how much negotiation room exists.
- Schools are F-rated, which usually means shorter tenancies and higher turnover. Who's the typical renter profile here, and what's been the actual vacancy rate?
- Crime grade is F in this area — have there been break-ins, vandalism, or insurance claims at this property in the last 3 years? What carrier currently insures it and at what premium?
- What's the average days-on-market for RENTAL listings here right now (not sales)? A rising rental-DOM trend means longer vacancies and softer asking-rent achievability than the comps imply.
- What's the recent tenant-quality profile in this submarket — average credit score on applications, eviction rate, late-payment / NSF rate, and stable-employment percentage? A property-management company in the area should have these aggregated.
- How much new for-sale + rental construction is in the pipeline within 1–3 miles? Heavy new supply typically softens prices + rents 12–24 months out; constrained supply supports both.
Investment metrics
- 1% rule
- 1.56% ✓
- Cap rate
- 10.58%
- Cash-on-cash
- 15.29%
- DSCR
- 1.68
- GRM
- 5.4
CMA / ARV
- ARV (on-the-fly)
- $227,243
- Comps found
- 12
Show comp detail 12 sales within ~0.75 mi
| Address | Dist | Beds/Ba | Sqft | Sold | Price | $/sf | Match |
|---|---|---|---|---|---|---|---|
| 17524 Woodingham Dr | 0.07mi | 4/1.5 (-1) | 2,120 (+5%) | 5mo | $255,000 | $120 | 76 |
| 17540 Indiana St | 0.36mi | 4/2.0 (-1) | 2,020 (+0%) | 2mo | $155,000 | $77 | 76 |
| 17585 Wisconsin St | 0.33mi | 4/2.0 (-1) | 1,944 (-3%) | 3mo | $290,000 | $149 | 71 |
| 17214 Pennington Dr | 0.28mi | 4/2.5 (-1) | 2,100 (+4%) | 7mo | $275,000 | $131 | 67 |
| 16801 Washburn St | 0.72mi | 4/2.0 (-1) | 2,031 (+1%) | 2mo | $230,000 | $113 | 58 |
| 17592 Wisconsin St | 0.30mi | 4/2.0 (-1) | 1,791 (-11%) | 6mo | $249,000 | $139 | 58 |
| 18661 San Juan Dr | 0.54mi | 4/2.5 (-1) | 1,882 (-6%) | 4mo | $236,000 | $125 | 54 |
| 16796 Turner St | 0.37mi | 4/2.0 (-1) | 1,710 (-15%) | 3mo | $159,000 | $93 | 50 |
| 18468 Santa Barbara Dr | 0.39mi | 4/1.5 (-1) | 1,738 (-14%) | 5mo | $150,000 | $86 | 48 |
| 16503 Ohio St | 0.69mi | 4/1.5 (-1) | 2,154 (+7%) | 4mo | $70,000 | $32 | 45 |
| 16864 Santa Rosa Dr | 0.60mi | 4/1.5 (-1) | 1,764 (-12%) | 1mo | $170,000 | $96 | 44 |
| 18041 Griggs St | 0.67mi | 4/2.0 (-1) | 2,300 (+14%) | 3mo | $202,025 | $88 | 37 |
Match score weights: distance 35% · size 25% · config 20% · recency 20%. Top-matched comps best support the ARV.
Projected returns pro-forma
-3.0% appreciation · 3.44% rent growth · sell at horizon
- IRR
- 6.7%
- Equity multiple
- 1.26×
- Total profit
- $9,184
- Equity at exit
- $18,623
- IRR
- 16.6%
- Equity multiple
- 2.40×
- Total profit
- $48,819
- Equity at exit
- $10,799
Cash invested: $34,972 (down + closing). Projections, not guarantees.
Landlord ↔ Tenant lean methodology
- Overall (STATE)
- 62 Landlord-Friendly
- State Michigan
- 62 Landlord-Friendly · EVEN
- County
- — inherits STATE
- City
- — inherits STATE
ZIP-level market 48221
- Rents YoY
- 3.4%
- Active inventory
- 349
- Price-to-rent
- 5.4×
Monthly cashflow live
- Estimated rent
- $1,945 medium interval (Pro) →
- Mortgage (P&I)
- −$655
- Tax from tax record
- −$383 /mo · $4,601/yr
- Insurance
- −$52
- HOA
- −$0
- Vacancy / Maint / Mgmt
- −$408
- Net cashflow
- $446
Break-even live
Sensitivity live
| Price | -10% $516 | -5% $481 | +0% $446 | +5% $410 | +10% $375 |
|---|---|---|---|---|---|
| Rent | -10% $292 | -5% $369 | +0% $446 | +5% $523 | +10% $599 |
| Rate | -1.0pp $509 | -0.5pp $478 | base $446 | +0.5pp $413 | +1.0pp $380 |
UW: 25.0% down · 7.5% · 30yr · 1.5% tax · 5.0% vac · 8.0% maint · 8.0% mgmt
Financing live
Cash to close
- Down payment
- $31,225
- Closing costs
- $3,747
- Reserves months
- —
- Total cash needed
- —
Loan-product check · same deal, 3 products live
Conventional
25% down · 7.5% · 30yr
- Down + closing
- —
- Monthly P&I
- —
- Monthly cashflow
- —
- DSCR
- —
- Eligible?
- —
Personal DTI + credit; lowest rate.
DSCR
20% down · 8.5% · 30yr
- Down + closing
- —
- Monthly P&I
- —
- Monthly cashflow
- —
- DSCR
- —
- Eligible?
- —
No personal income docs; deal must DSCR.
Hard money
10% down · 12.0% · 12mo
- Down + closing
- —
- Monthly P&I
- —
- Monthly cashflow
- —
- DSCR
- —
- Eligible?
- —
Short-term bridge; refi at stabilization.
Rent comps 3 comps
| Address | Beds | Baths | Sqft | Rent | $/sqft | DOM | Units | Dist |
|---|---|---|---|---|---|---|---|---|
| 16211 Kentucky St Detroit, MI | 4.0 | 2.0 | 2168 | $1,945 | $0.90 | 0d | 1 | 0.85mi |
| 15756 Ohio St Detroit, MI | 5.0 | 2.0 | 1934 | $1,700 | $0.88 | 25d | 1 | 1.05mi |
| 16503 Linwood St Detroit, MI | 4.0 | 2.0 | 2415 | $1,800 | $0.75 | 5d | 1 | 1.33mi |
Listing history 5 events
-
2026-06-21days on market $124,900 Active 5 DOM
-
2026-06-19status $124,900 Active 2 DOM
-
2026-06-13statusdays on market $124,900 Pending 2 DOM
-
2026-06-09remarks 248-char remark
-
2026-06-09$124,900 Active 1 DOM
ⓘ Source: listings_history table (triggers on properties + properties_extension) + one-shot
backfill from property_details.listing_events for pre-trigger history.
Tax reassessment forecast MI · Partial reset (capped growth)
- Current annual tax
- $4,601 · $383/mo
- Projected year-2 tax
- $4,601 · $383/mo
- Expected delta
- $0/yr ($0/mo · 0.0%)
ⓘ Screening estimate from a state-policy table — verify with the county assessor before closing.
Climate risk First Street
- Flood 1/10 Low FEMA zone X (unshaded) · 0% chance over 30 yrs
- Wildfire 1/10 Low
- Heat 3/10 Moderate 7 d/yr ≥97°F today · 15 d/yr by 30 yrs out
- Wind 2/10 Low
- Air quality 3/10 Moderate 2 unhealthy d/yr today · 5 by 30 yrs out
Nearby sold comps map
Loading sold comps map…
Walkable amenities ~0.75 mi
Loading nearby amenities…
Taxation est. · year 1
- Rental income
- $23,335
- − Mortgage interest
- −$6,996
- − Property taxes
- −$4,601
- − Insurance
- −$624
- − Repairs & maintenance
- −$1,867
- − Management
- −$1,867
- − Depreciation
- −$3,633
- Taxable income
- $3,746
- Est. tax owed @ 24.0%
- −$899
- After-tax cash flow
- $4,450/yr
For passive investors: Depreciation is non-cash, so a rental often shows a tax loss while cash-flowing — sheltering income. Rental losses are passive: they offset passive income freely, and up to $25,000/yr can offset ordinary (W-2) income if you actively participate and your MAGI is under $100k (phasing out to $0 by $150k); unused losses carry forward. On sale, claimed depreciation is recaptured at up to 25%, and gains may owe capital-gains tax (a 1031 exchange can defer both). Figures are a year-1 estimate at your 24.0% rate — not tax advice; consult a CPA.
Schools (NCES district)
- District
- Detroit Public Schools Community District
- NCES district ID
- 2601103
- Math proficiency
- 10% ▼ -2.00%
- Reading proficiency
- 24% ▲ 6.00%
- Median HH income
- $25,815
- Composite
- 13.06/100
- National rank
- #9564
- State rank
- #499 of 540 in MI
Livability — Detroit
- Score
- 73/100
- State rank
- #218
- US rank
- #5427
Category grades
Schools grade is shown separately in the Schools card above.
Census & demographics
- Census place
- Detroit, MI
- County
- Wayne County · 1,562,939 people
- City population
- 572,865
- Metro
- Detroit-Warren-Dearborn, MI
- Population (ZIP)
- 41,392
- Household income
- $57,878
- Rent vs Own
- Severe rent burden
- 1646.0
Population outlook (Wayne County) Hauer SSP2
- Today (2025)
- 1,675,273 people
- By 2030
- 1,620,300 · -3.3%
- By 2040
- 1,502,341 · -10.3%
- By 2050
- 1,384,039 · -17.4%
- By 2075
- 1,124,592 · -32.9%
- By 2100
- 881,193 · -47.4%
Race, ethnicity, and origin ACS 2023
- Neighborhood character
- Predominantly Black (85%)
- Race & ethnicity
- Black 85% White 8% Two or more races 4% Asian 1%
- Common ancestry
- Romanian 1% Lithuanian 1%
- Foreign-born
- 2% · Canada
- Languages at home
- 97% English-only · Spanish 1% Other Indo-European 1%
Political lean MEDSL · Wayne
- 2024 margin
- Strong D (+29.0) · D 62.7% · R 33.7% · Other 3.6%
- 2008→2024 swing
- -20.5pp toward R · 2008: 49.5pp · 2024: 29.0pp
- All cycles
- 2024: D+29.0 2020: D+38.1 2016: D+37.3 2012: D+46.9 2008: D+49.5
Not yet ingested
- Civics
- —
Market trends
- HPI YoY
- ▼ -433.14%
- Current HPI
- 280.5434
- Rent YoY
- ▲ 3.44%
- Metro
- Detroit-Warren-Dearborn, MI
- State GDP YoY
- ▲ 1.37%
- F500 in state
- 28
Industry mix (Fortune 500 HQ in MI)
| Industry | F500 HQs | Revenue |
|---|---|---|
| Automotive Parts | 3 | $48B |
|
||
| Automotive | 2 | $372B |
|
||
| Chemicals | 1 | $45B |
|
||
| Automotive Retail | 1 | $29B |
|
||
| Healthcare / Medical Devices | 1 | $23B |
|
||
| Automotive Technology | 1 | $20B |
|
||
Price history
-23.4% since first listed9 events — show timeline
- 2026-06-08 Listed $124,900 REALCOMP
- 2026-06-08 Listed $124,900 MiRealSource-MiMLS
- 2009-03-24 Listing Removed — REALCOMP
- 2009-03-24 Listing Removed — MiRealSource-MiMLS
- 2009-03-19 Listed $25,000 REALCOMP
- 2009-03-19 Listed $25,000 MiRealSource-MiMLS
- 2007-03-23 Sold (Public Records) $153,000 Public Records
- 2007-02-21 Listing Removed — REALCOMP
- 2006-12-26 Listed $163,000 REALCOMP
Property tax history
+7.4%/yrLatest (2025): $4,601 · +0.5% YoY. Source: county tax records.
Cash-flow waterfall
monthlySold comps — $/sqft
last 12 mo · ≤1 miLoading sold comps…