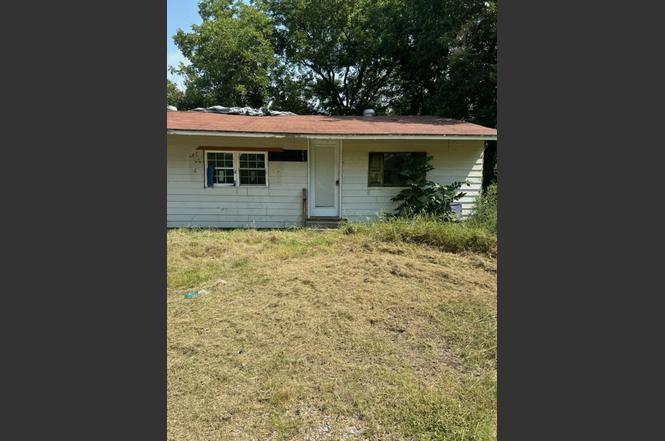
110 Owens St N · Wynne, AR
Flood risk 3/10 · Minor
- FEMA flood zone
- A
- Chance of flooding over 30 yrs
- 0.2%
- Est. flood insurance / yr
- $1,009 – $1,996
Fire risk 1/10 · Minimal
- Est. fire insurance / yr
- $1,499 – $2,785
Heat risk 6/10 · Moderate
- Hot days now (above 109°F)
- 7 days/yr
- Hot days in 30 yrs
- 20 days/yr
Wind risk 4/10 · Minor
- Chance of severe wind over 30 yrs
- 14.0%
Air-quality risk 1/10 · Minimal
- Unhealthy air days now
- 0 days/yr
- Unhealthy air days in 30 yrs
- 0 days/yr
Risk factors via First Street. Map © Google.
Why this score? — see what drove the B+ grade
The composite is a weighted blend of 9 inputs, each scored 0–100. Each bar is that input's sub-score; the figure is the points it added to the 100-point composite (weight × sub-score).
- Cash flow +30.0/30.0
- ARV discount +15.0/15.0
- 1% rule +10.0/10.0
- DSCR +10.0/10.0
- Schools +3.2/10.0
- Livability +2.7/5.0
- Rent growth +2.5/5.0
- Condition / age +2.5/5.0
- Appreciation +0.0/10.0
$25,000
🖨 Deal sheet (PDF) 📄 Offer letter ✓ Due diligence
Listing remarks
For Sale: Charming Fixer-Upper in Wynne ! Your next project awaits! This property has great potential and is perfect for anyone looking to create their dream home or make a profitable investment! Address: 110 Owens St Bedrooms: 2 Bathrooms: 2 Square Footage: 1619 sqft This home needs some TLC and is priced to sell FAST! Ideal for fix and flip enthusiasts or those looking for a project home. Contact Us Today for More Details: Joan Olson: [email protected] | 727-263-3034 Cash Buyers only 7 $500 EMD 7 day inspection 30 day close
Key facts
- 0.52 acre lot
- Built 1967
- Listed 224 days
Property features AI
Finance
- Other: Other details: not specified
- Financial info: Financial details: not specified
- HOA & community: HOA/community details: not specified
Exterior
- Parking: Parking details: not specified
- Security: Security features: not specified
- Utilities: Utilities details: not specified
- Home design: House
- Construction: Construction details: not specified
- Exterior features: Lot of approximately 22,695 sq ft
Interior
- Kitchen: Kitchen details: not specified
- Bedrooms: Bedrooms: not specified
- Flooring: Flooring details: not specified
- Bathrooms: Bathrooms: not specified
- Heating & cooling: Heating and cooling details: not specified
- Interior features: One-level living
- Laundry & utility: Laundry/utility details: not specified
Neighborhood map
What this means for you Summary
Snapshot
- This is a 2-bed/1.0-bath single-family listed at $25k.
Deal economics
- At list price, monthly cash flow is $530 ($6k/yr) — positive.
- The deal already cash-flows at list — no discount required.
- Meets the 1% rule at list price ($1k rent vs $25k).
- Recommended offer: $22k (12.0% below list) — sets the bar for market timing.
- Cap rate 37.8% vs local median 4.5% in Wynne — top-decile yield for the area; either an underpriced asset or a hidden risk that comps aren't pricing in. Stress-test before assuming the spread holds.
Location & tenants
- Location reads 54/100 on livability (#427 in AR) — a working-class tenant base; expect higher turnover. Strengths: cost of living A+, housing A, health & safety A; Watch: crime F, amenities F, commute F.
- Wynne School District (town): math 36% / reading 39% proficiency, ranked #96 of 238 in AR (top 40%) — families likely to look elsewhere, expect single-tenant / working-renter base with shorter leases.
- Zoned schools: Wynne Intermediate School (math 43% / reading 35%, grade F, #221 of 454 statewide, top 49%, 571 students, 67% FRL); Wynne Junior High School (math 39% / reading 40%, grade F, #92 of 201 statewide, top 50%, 563 students, 60% FRL); Wynne High School (math 22% / reading 41%, grade F, #128 of 292 statewide, top 44%, 784 students, 53% FRL).
- Market conditions: 99 active listings in the ZIP; 17 units permitted in Cross County in 2024 (0 in 5+ unit buildings).
Forward outlook
- Local home prices are declining (-3.0%/yr); year-one equity from $173 of loan paydown is wiped out by about $750 of value loss. Plan a longer hold.
- Cross County population projected at -20% by 2050 — secular population decline; favor cash flow + early exit over multi-decade hold.
- At projected returns (-3.0% appreciation + 3.0% rent growth), your $7k cash investment doubles in ~2 years — after that, you're playing with house money.
Negotiation context
- It's been on market 224 days — a 12% lower offer ($22k) is reasonable based on typical stale-listing flexibility.
- 2 sale attempts with the ask held roughly flat each time — persistent listings suggest the price (not the market) is what's stuck; bring a comps-based counter.
Risks & watch-outs
- Watch-outs: flood insurance adds $125/mo.
- Climate carrying-cost: in FEMA flood zone A (mandatory federal flood insurance); extreme-heat days projected 7→20/yr by 2055 (HVAC capex compounding) — expect insurance premiums to compound above CPI over the hold.
Questions for the listing agent
- It's been on market 224 days. Have you received any prior offers? Is the seller open to a 12% concession, seller financing, or rate buy-down credit?
- Built in 1967 — when were the roof, HVAC, electrical panel, plumbing, and water heater last replaced?
- What's the actual annual flood-insurance premium (NFIP or private), and is the property in a SFHA with mandatory coverage?
- Why hasn't it sold? Are there any deal-killer items the seller is aware of (foundation, flood, title, zoning, code violations)?
- Is there a deadline driving the sale (1031 exchange, divorce, estate, relocation)? That informs how much negotiation room exists.
- Schools are D-rated, which usually means shorter tenancies and higher turnover. Who's the typical renter profile here, and what's been the actual vacancy rate?
- Crime grade is F in this area — have there been break-ins, vandalism, or insurance claims at this property in the last 3 years? What carrier currently insures it and at what premium?
- What's the average days-on-market for RENTAL listings here right now (not sales)? A rising rental-DOM trend means longer vacancies and softer asking-rent achievability than the comps imply.
- What's the recent tenant-quality profile in this submarket — average credit score on applications, eviction rate, late-payment / NSF rate, and stable-employment percentage? A property-management company in the area should have these aggregated.
- How much new for-sale + rental construction is in the pipeline within 1–3 miles? Heavy new supply typically softens prices + rents 12–24 months out; constrained supply supports both.
Investment metrics
- 1% rule
- 4.12% ✓
- Cap rate
- 37.76%
- Cash-on-cash
- 112.39%
- DSCR
- 6.00
- GRM
- 2.0
CMA / ARV
- ARV (on-the-fly)
- $39,400
- Comps found
- 1
Show comp detail 1 sale within ~0.75 mi
| Address | Dist | Beds/Ba | Sqft | Sold | Price | $/sf | Match |
|---|---|---|---|---|---|---|---|
| 702 Union Ave | 0.60mi | 2/1.5 | 1,395 (-12%) | 12mo | $35,000 | $25 | 40 |
Match score weights: distance 35% · size 25% · config 20% · recency 20%. Top-matched comps best support the ARV.
Projected returns pro-forma
-3.0% appreciation · 3.0% rent growth · sell at horizon
- IRR
- 91.7%
- Equity multiple
- 5.26×
- Total profit
- $29,815
- Equity at exit
- $3,728
- IRR
- 94.6%
- Equity multiple
- 10.97×
- Total profit
- $69,801
- Equity at exit
- $2,162
Cash invested: $7,000 (down + closing). Projections, not guarantees.
Landlord ↔ Tenant lean methodology
- Overall (STATE)
- 92 Strongly Landlord-Friendly
- State Arkansas
- 92 Strongly Landlord-Friendly · R+14
- County
- — inherits STATE
- City
- — inherits STATE
ZIP-level market 72396
- Home prices YoY
- -17.6%
- Active inventory
- 99
- Price-to-rent
- 2.0×
Monthly cashflow live
- Estimated rent
- $1,029 medium interval (Pro) →
- Mortgage (P&I)
- −$131
- Tax from tax record
- −$16 /mo · $189/yr
- Insurance
- −$10
- Flood insurance flood zone
- −$125 /mo · $1,502/yr
- HOA
- −$0
- Vacancy / Maint / Mgmt
- −$216
- Net cashflow
- $530
Break-even live
Sensitivity live
| Price | -10% $545 | -5% $538 | +0% $530 | +5% $523 | +10% $516 |
|---|---|---|---|---|---|
| Rent | -10% $449 | -5% $490 | +0% $530 | +5% $571 | +10% $612 |
| Rate | -1.0pp $543 | -0.5pp $537 | base $530 | +0.5pp $524 | +1.0pp $517 |
UW: 25.0% down · 7.5% · 30yr · 1.5% tax · 5.0% vac · 8.0% maint · 8.0% mgmt
Financing live
Cash to close
- Down payment
- $6,250
- Closing costs
- $750
- Reserves months
- —
- Total cash needed
- —
Loan-product check · same deal, 3 products live
Conventional
25% down · 7.5% · 30yr
- Down + closing
- —
- Monthly P&I
- —
- Monthly cashflow
- —
- DSCR
- —
- Eligible?
- —
Personal DTI + credit; lowest rate.
DSCR
20% down · 8.5% · 30yr
- Down + closing
- —
- Monthly P&I
- —
- Monthly cashflow
- —
- DSCR
- —
- Eligible?
- —
No personal income docs; deal must DSCR.
Hard money
10% down · 12.0% · 12mo
- Down + closing
- —
- Monthly P&I
- —
- Monthly cashflow
- —
- DSCR
- —
- Eligible?
- —
Short-term bridge; refi at stabilization.
Listing history 22 events
-
2026-06-19days on market $25,000 Active 224 DOM
-
2026-06-18days on market $25,000 Active 223 DOM
-
2026-06-17days on market $25,000 Active 222 DOM
-
2026-06-16days on market $25,000 Active 221 DOM
-
2026-06-15days on market $25,000 Active 220 DOM
-
2026-06-14days on market $25,000 Active 218 DOM
-
2026-06-12days on market $25,000 Active 217 DOM
-
2026-06-09days on market $25,000 Active 214 DOM
-
2026-06-08days on market $25,000 Active 213 DOM
-
2026-06-07days on market $25,000 Active 212 DOM
-
2026-06-07days on market $25,000 Active 211 DOM
-
2026-06-04days on market $25,000 Active 208 DOM
-
2026-06-02days on market $25,000 Active 207 DOM
-
2026-06-01days on market $25,000 Active 206 DOM
-
2026-05-31days on market $25,000 Active 205 DOM
-
2026-05-31days on market $25,000 Active 204 DOM
-
2025-11-07$25,000 Active
-
2025-05-18historical $346
-
2025-05-01$346
-
2007-06-08soldstatus $56,000
-
2000-12-06soldstatus $22,000
-
1990-04-06soldstatus $21,500
ⓘ Source: listings_history table (triggers on properties + properties_extension) + one-shot
backfill from property_details.listing_events for pre-trigger history.
Tax reassessment forecast AR · Resets to sale price
- Current annual tax
- $189 · $16/mo
- Projected year-2 tax
- $189 · $16/mo
- Expected delta
- $0/yr ($0/mo · 0.0%)
ⓘ Screening estimate from a state-policy table — verify with the county assessor before closing.
Climate risk First Street
- Flood 3/10 Moderate FEMA zone A · 20% chance over 30 yrs
- Wildfire 1/10 Low
- Heat 6/10 Major 7 d/yr ≥109°F today · 20 d/yr by 30 yrs out
- Wind 4/10 Moderate 14% chance of damaging wind over 30 yrs
- Air quality 1/10 Low 0 unhealthy d/yr today · 0 by 30 yrs out
Nearby sold comps map
Loading sold comps map…
Walkable amenities ~0.75 mi
Loading nearby amenities…
Taxation est. · year 1
- Rental income
- $12,348
- − Mortgage interest
- −$1,400
- − Property taxes
- −$189
- − Insurance
- −$1,628
- − Repairs & maintenance
- −$988
- − Management
- −$988
- − Depreciation
- −$727
- Taxable income
- $6,428
- Est. tax owed @ 24.0%
- −$1,543
- After-tax cash flow
- $4,822/yr
For passive investors: Depreciation is non-cash, so a rental often shows a tax loss while cash-flowing — sheltering income. Rental losses are passive: they offset passive income freely, and up to $25,000/yr can offset ordinary (W-2) income if you actively participate and your MAGI is under $100k (phasing out to $0 by $150k); unused losses carry forward. On sale, claimed depreciation is recaptured at up to 25%, and gains may owe capital-gains tax (a 1031 exchange can defer both). Figures are a year-1 estimate at your 24.0% rate — not tax advice; consult a CPA.
Schools (NCES district)
- District
- Wynne School District
- NCES district ID
- 0514430
- Math proficiency
- 36% ▼ -8.00%
- Reading proficiency
- 39% ▼ -7.00%
- Median HH income
- $40,508
- Composite
- 31.51/100
- National rank
- #5970
- State rank
- #96 of 238 in AR
Livability — Wynne
- Score
- 54/100
- State rank
- #427
- US rank
- #24166
Category grades
Schools grade is shown separately in the Schools card above.
Census & demographics
- Census place
- Wynne, AR
- Population (ZIP)
- 12,854
Population outlook (Cross County) Hauer SSP2
- Today (2025)
- 16,293 people
- By 2030
- 15,636 · -4.0%
- By 2040
- 14,312 · -12.2%
- By 2050
- 13,050 · -19.9%
- By 2075
- 10,362 · -36.4%
- By 2100
- 7,873 · -51.7%
Race, ethnicity, and origin ACS 2023
- Neighborhood character
- Predominantly White (71%)
- Race & ethnicity
- White 71% Black 20% Two or more races 9% Hispanic / Latino 3%
- Common ancestry
- Italian 3% Slovak 1% Lithuanian 1%
- Foreign-born
- 2%
- Languages at home
- 97% English-only · Arabic 2% Spanish 1%
Political lean MEDSL · Cross
- 2024 margin
- Solid R (+47.6) · D 25.1% · R 72.7% · Other 2.1%
- 2008→2024 swing
- -22.2pp toward R · 2008: -25.4pp · 2024: -47.6pp
- All cycles
- 2024: R+47.6 2020: R+45.7 2016: R+37.8 2012: R+29.8 2008: R+25.4
Not yet ingested
- Civics
- —
Market trends
- HPI YoY
- ▼ -39.26%
- Current HPI
- 184.1112
- Rent YoY
- —
- Metro
- —
- State GDP YoY
- ▲ 3.80%
- F500 in state
- 10
Industry mix (Fortune 500 HQ in AR)
| Industry | F500 HQs | Revenue |
|---|---|---|
| Retail | 1 | $681B |
|
||
| Food / Agriculture | 1 | $53B |
|
||
| Retail / Energy | 1 | $22B |
|
||
| Transportation / Logistics | 1 | $12B |
|
||
| Energy | 1 | $4B |
|
||
Price history
+16.3% since first listed6 events — show timeline
- 2025-11-07 Listed $25,000 ForSaleByOwner.com
- 2025-05-18 Rental Removed $346 Hemlane
- 2025-05-01 Listed for Rent $346 Hemlane
- 2007-06-08 Sold (Public Records) $56,000 Public Records
- 2000-12-06 Sold (Public Records) $22,000 Public Records
- 1990-04-06 Sold (Public Records) $21,500 Public Records
Property tax history
-6.4%/yrLatest (2025): $189 · +9.3% YoY. Source: county tax records.
Cash-flow waterfall
monthlySold comps — $/sqft
last 12 mo · ≤1 miLoading sold comps…