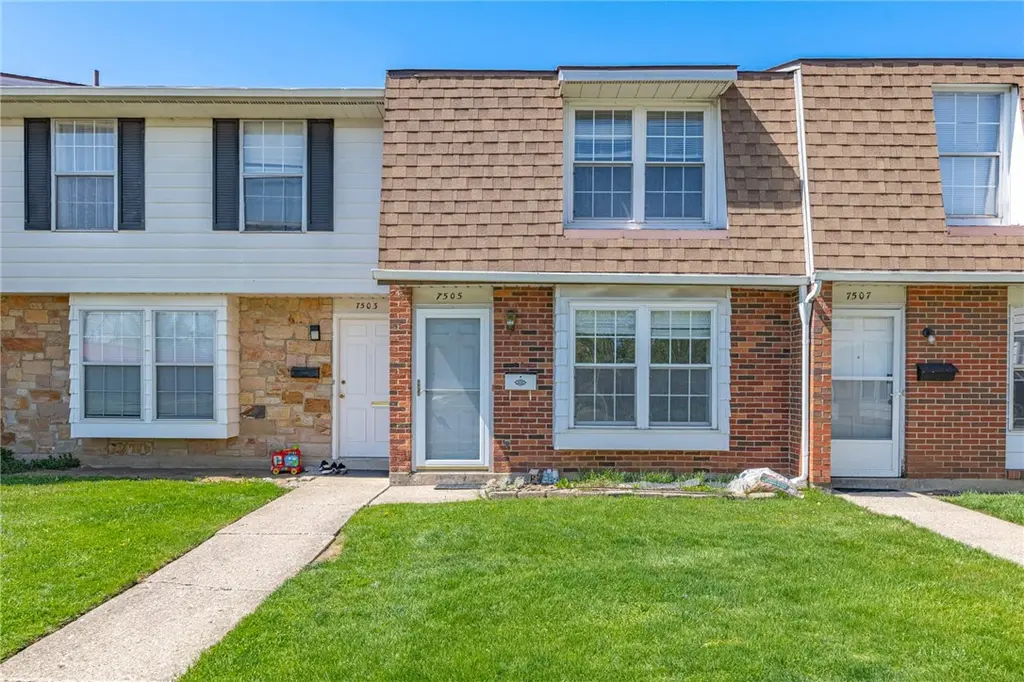
7505 Mount Ranier · Huber Heights, OH
Flood risk 1/10 · Minimal
- FEMA flood zone
- X (unshaded)
- Chance of flooding over 30 yrs
- 0.0%
- Est. flood insurance / yr
- $507 – $1,088
Fire risk 3/10 · Minor
- Est. fire insurance / yr
- $713 – $1,323
Heat risk 3/10 · Minor
- Hot days now (above 101°F)
- 7 days/yr
- Hot days in 30 yrs
- 18 days/yr
Wind risk 2/10 · Minimal
- Chance of severe wind over 30 yrs
- —
Air-quality risk 3/10 · Minor
- Unhealthy air days now
- 3 days/yr
- Unhealthy air days in 30 yrs
- 4 days/yr
Risk factors via First Street. Map © Google.
Why this score? — see what drove the C- grade
The composite is a weighted blend of 9 inputs, each scored 0–100. Each bar is that input's sub-score; the figure is the points it added to the 100-point composite (weight × sub-score).
- Cash flow +19.4/30.0
- ARV discount +8.5/15.0
- 1% rule +6.7/10.0
- DSCR +6.1/10.0
- Livability +3.6/5.0
- Schools +3.3/10.0
- Rent growth +2.6/5.0
- Condition / age +2.5/5.0
- Appreciation +0.0/10.0
$101,900
🖨 Deal sheet (PDF) 📄 Offer letter ✓ Due diligence
Listing remarks MLS
Well maintained 2 bedroom, 1.5 bathrooms. Half bath is in the laundry room with washer & dryer, spacious eat in kitchen, & all appliances included. Low condo fee and taxes, make owning this condo cheaper than paying rent. Has a carport for your car, owners are preparing to move in est. 2 weeks. This condo will be ready for you to move in. Great location, close to major shopping, restaurants, WPAFB, medical, I-70, RT 675, I-75, etc.
Key facts
- Close to restaurants
- Close to wpafb
- Great location
Tags
Neighborhood map
What this means for you Summary
Snapshot
- This is a 2-bed/1.5-bath condo listed at $102k.
Deal economics
- At list price, monthly cash flow is $114 ($1k/yr) — positive.
- The deal already cash-flows at list — no discount required.
- Meets the 1% rule at list price ($1k rent vs $102k).
- Recommended offer: $93k (9.0% below list) — sets the bar for market timing.
- Cap rate 7.6% vs local median 3.5% in Huber Heights — top-decile yield for the area; either an underpriced asset or a hidden risk that comps aren't pricing in. Stress-test before assuming the spread holds.
Location & tenants
- Location reads 71/100 on livability (#436 in OH) — a middle-class / working-renter tenant base. Strengths: cost of living A+, housing A+, crime B; Watch: amenities F, commute F, health & safety F.
- Huber Heights City (suburban): math 29% / reading 47% proficiency, ranked #544 of 656 in OH (top 83%) — families likely to look elsewhere, expect single-tenant / working-renter base with shorter leases.
- Zoned schools: Rushmore Elementary School (math 31% / reading 45%, grade F, #1,082 of 1,584 statewide, top 68%, 619 students, 55% FRL); Weisenborn Junior High (math 26% / reading 46%, grade F, #541 of 654 statewide, top 83%, 937 students, 55% FRL); Wayne High School (math 14% / reading 53%, grade F, #598 of 781 statewide, top 77%, 1,743 students, 51% FRL).
- Market conditions: Rents flat; 200 active listings in the ZIP; 36 comparable units currently listed for rent nearby; rentals at typical pace (median 25d on market — plan ~3-4 weeks tenant-placement turnaround); solid renter incomes; 907 units permitted in Montgomery County in 2024 (416 in 5+ unit buildings).
- This rent is only 18% of the median local income ($81k/yr) — well below the 30% rent-burden line; pricing power to push rent on renewal without tenant pushback.
Forward outlook
- Local home prices are declining (-3.0%/yr); year-one equity from $705 of loan paydown is wiped out by about $3k of value loss. Plan a longer hold.
- Montgomery County population projected at -10% by 2050 — secular population decline; favor cash flow + early exit over multi-decade hold.
Negotiation context
- It's been on market 95 days — a 9% lower offer ($93k) is reasonable based on typical stale-listing flexibility.
- Current owner paid $38k; list at $102k implies a 168% gain — meaningful room to come down on a strong offer.
Questions for the listing agent
- It's been on market 95 days. Have you received any prior offers? Is the seller open to a 9% concession, seller financing, or rate buy-down credit?
- Built in 1973 — when were the roof, HVAC, electrical panel, plumbing, and water heater last replaced?
- What does the HOA fee cover, when was the last increase, and are there any pending special assessments or reserve-fund shortfalls?
- Any open or pending special assessments — roof, HVAC, plumbing, elevator, façade? What's the per-unit balance and payoff schedule, and is the seller paying it off at close or rolling it to the buyer?
- Why hasn't it sold? Are there any deal-killer items the seller is aware of (foundation, flood, title, zoning, code violations)?
- Is there a deadline driving the sale (1031 exchange, divorce, estate, relocation)? That informs how much negotiation room exists.
- Schools are B-rated — typically a magnet for longer-tenancy family renters. What's the average tenant stay here, and is there a school-zone premium baked into asking?
- What's the average days-on-market for RENTAL listings here right now (not sales)? A rising rental-DOM trend means longer vacancies and softer asking-rent achievability than the comps imply.
- What's the recent tenant-quality profile in this submarket — average credit score on applications, eviction rate, late-payment / NSF rate, and stable-employment percentage? A property-management company in the area should have these aggregated.
- How much new apartment / multifamily construction is in the pipeline within 1–3 miles? Heavy new supply (>2% of stock underway) typically softens rents 12–24 months out; light construction supports rent growth.
Investment metrics
- 1% rule
- 1.17% ✓
- Cap rate
- 7.64%
- Cash-on-cash
- 4.81%
- DSCR
- 1.21
- GRM
- 7.1
CMA / ARV
- ARV (median comp)
- $104,256
- List price
- $101,900
- Delta
- -2.26%
- Verdict
- FAIR
- Comps
- 20 within 1.0 mi
Projected returns pro-forma
-3.0% appreciation · 0.23% rent growth · sell at horizon
- IRR
- -12.4%
- Equity multiple
- 0.57×
- Total profit
- $-12,374
- Equity at exit
- $15,194
- IRR
- -9.0%
- Equity multiple
- 0.52×
- Total profit
- $-13,598
- Equity at exit
- $8,810
Cash invested: $28,532 (down + closing). Projections, not guarantees.
Landlord ↔ Tenant lean methodology
- Overall (STATE)
- 73 Landlord-Friendly
- State Ohio
- 73 Landlord-Friendly · R+6
- County
- — inherits STATE
- City
- — inherits STATE
ZIP-level market 45424
- Rents YoY
- 0.2%
- Active inventory
- 200
- Price-to-rent
- 7.1×
Monthly cashflow live
- Estimated rent
- $1,196 high interval (Pro) →
- Mortgage (P&I)
- −$534
- Tax from tax record
- −$91 /mo · $1,091/yr
- Insurance
- −$42
- HOA
- −$163
- Vacancy / Maint / Mgmt
- −$251
- Net cashflow
- $114
Break-even live
Sensitivity live
| Price | -10% $172 | -5% $143 | +0% $114 | +5% $86 | +10% $57 |
|---|---|---|---|---|---|
| Rent | -10% $20 | -5% $67 | +0% $114 | +5% $162 | +10% $209 |
| Rate | -1.0pp $166 | -0.5pp $140 | base $114 | +0.5pp $88 | +1.0pp $61 |
UW: 25.0% down · 7.5% · 30yr · 1.5% tax · 5.0% vac · 8.0% maint · 8.0% mgmt
Financing live
Cash to close
- Down payment
- $25,475
- Closing costs
- $3,057
- Reserves months
- —
- Total cash needed
- —
Loan-product check · same deal, 3 products live
Conventional
25% down · 7.5% · 30yr
- Down + closing
- —
- Monthly P&I
- —
- Monthly cashflow
- —
- DSCR
- —
- Eligible?
- —
Personal DTI + credit; lowest rate.
DSCR
20% down · 8.5% · 30yr
- Down + closing
- —
- Monthly P&I
- —
- Monthly cashflow
- —
- DSCR
- —
- Eligible?
- —
No personal income docs; deal must DSCR.
Hard money
10% down · 12.0% · 12mo
- Down + closing
- —
- Monthly P&I
- —
- Monthly cashflow
- —
- DSCR
- —
- Eligible?
- —
Short-term bridge; refi at stabilization.
Rent comps 36 comps
| Address | Beds | Baths | Sqft | Rent | $/sqft | DOM | Units | Dist |
|---|---|---|---|---|---|---|---|---|
| 7560 Mount Hood Dayton, OH | 3.0 | 1.5 | 1234 | $925 | $0.75 | 45d | 1 | 0.04mi |
| 7618 Mount Hood Dayton, OH | 2.0 | 1.0 | 1094 | $995 | $0.91 | 45d | 1 | 0.08mi |
| 7665 Mount Hood Huber Heights, OH | 2.0 | 2.0 | 1094 | $995 | $0.91 | 25d | 1 | 0.17mi |
| 7701 Mount Hood Huber Heights, OH | 2.0 | 2.0 | 1094 | $995 | $0.91 | 25d | 1 | 0.19mi |
| 7811 Mount Hood Dayton, OH | 3.0 | 2.0 | 1234 | $1,145 | $0.93 | 25d | 1 | 0.24mi |
| 7672 Old Troy Pike Dayton, OH | 1.0–2.0 | 1.0–2.0 | 887 | $1,685 | $1.90 | 4d | 16 | 0.26mi |
| 5670 Taylorsville Rd Dayton, OH | 3.0 | 2.0 | 1247 | $1,145 | $0.92 | 25d | 1 | 0.27mi |
| 8100 Mount Snow Dr Dayton, OH | 3.0 | 1.0 | 915 | $1,275 | $1.39 | 16d | 1 | 0.27mi |
| 8040 Mount Everest St Huber Heights, OH | 2.0 | 1.5 | 1094 | $845 | $0.77 | 45d | 1 | 0.29mi |
| 7991 Mount Hood Dayton, OH | 3.0 | 2.0 | 1234 | $1,145 | $0.93 | 25d | 1 | 0.30mi |
| 8142 Mount Snow Dr Dayton, OH | 3.0 | 1.0 | 933 | $1,095 | $1.17 | 45d | 1 | 0.32mi |
| 8093 Mount Aetna St Dayton, OH | 2.0 | 2.0 | 1094 | $945 | $0.86 | 20d | 1 | 0.33mi |
| 8195 Mount Carmel St Huber Heights, OH | 3.0 | 1.5 | 1234 | $995 | $0.81 | 45d | 1 | 0.36mi |
| 8248 Mount McKinley Dr Dayton, OH | 2.0 | 1.0 | 933 | $1,045 | $1.12 | 12d | 1 | 0.39mi |
| 8197 Mount Washington Dr Dayton, OH | 2.0 | 1.0 | 933 | $995 | $1.07 | 5d | 1 | 0.40mi |
| 8225 Mount McKinley Dr Dayton, OH | 2.0 | 1.0 | 933 | $1,045 | $1.12 | 20d | 1 | 0.41mi |
| 6324 Larcomb Dr Dayton, OH | 3.0 | 2.0 | 1483 | $2,200 | $1.48 | 45d | 1 | 0.48mi |
| 7858 Harshmanville Rd Dayton, OH | 3.0 | 1.0 | 1026 | $1,295 | $1.26 | 20d | 1 | 0.53mi |
| 5051 Bluffview Dr Dayton, OH | 3.0 | 2.0 | 1244 | $1,595 | $1.28 | 45d | 1 | 0.59mi |
| 5648 Troy Villa Blvd Huber Heights, OH | 3.0 | 2.0 | 1409 | $1,195 | $0.85 | 45d | 1 | 0.79mi |
| 6752 Hubbard Dr Dayton, OH | 3.0 | 2.0 | 1376 | $1,395 | $1.01 | 45d | 1 | 0.83mi |
| 5698 Troy Villa Blvd Huber Heights, OH | 3.0 | 2.0 | 1119 | $1,195 | $1.07 | 45d | 1 | 0.83mi |
| 5011 Longford Rd Dayton, OH | 3.0 | 2.0 | 1212 | $1,500 | $1.24 | 5d | 1 | 0.84mi |
| 5664 Troy Villa Blvd Huber Heights, OH | 3.0 | 2.0 | 1119 | $1,195 | $1.07 | 25d | 1 | 0.89mi |
| 7883 Sebring Dr Dayton, OH | 3.0 | 1.5 | 1266 | $1,595 | $1.26 | 5d | 1 | 0.90mi |
| 4911 Larchview Dr Dayton, OH | 3.0 | 2.0 | 1339 | $1,595 | $1.19 | 5d | 1 | 0.94mi |
| 7611 Blossomview Ct Dayton, OH | 3.0 | 2.0 | 1339 | $1,695 | $1.27 | 4d | 1 | 0.99mi |
| 6301 Holbrook Dr Dayton, OH | 3.0 | 2.0 | 1080 | $1,345 | $1.25 | 25d | 1 | 0.99mi |
| 6384 Nightwind Ct Dayton, OH | 2.0 | 2.0 | 1232 | $1,195 | $0.97 | 23d | 1 | 1.04mi |
| 5417 Coleraine Dr Dayton, OH | 3.0 | 2.0 | 1248 | $1,395 | $1.12 | 23d | 1 | 1.11mi |
| 6416 Alp Ct Dayton, OH | 3.0 | 2.0 | 1376 | $1,495 | $1.09 | 25d | 1 | 1.16mi |
| 6851 Wayne Estates Blvd Dayton, OH | 3.0 | 1.0–2.5 | 994 | $1,433 | $1.44 | 4d | 6 | 1.23mi |
| 7155 Stonehurst Dr Dayton, OH | 3.0 | 1.0 | 1323 | $1,500 | $1.13 | 25d | 1 | 1.28mi |
| 6701 Executive Blvd Huber Heights, OH | 1.0 | 1.0 | 819 | $1,524 | $1.86 | 4d | 10 | 1.36mi |
| 6888 Brandt Pike Huber Heights, OH | 2.0 | 1.0 | 870 | $1,100 | $1.26 | 4d | 3 | 1.42mi |
| 7207 Belle Plain Dr Dayton, OH | 3.0 | 2.0 | 1139 | $1,595 | $1.40 | 45d | 1 | 1.46mi |
HOA detail condo
- Monthly dues
- $163 · $1,956/yr
- Assessments
- None detected in remarks — confirm with the listing agent.
Listing history 19 events
-
2026-06-21days on market $101,900 Active 95 DOM
-
2026-06-18days on market $101,900 Active 92 DOM
-
2026-06-17days on market $101,900 Active 91 DOM
-
2026-06-16days on market $101,900 Active 90 DOM
-
2026-06-15days on market $101,900 Active 89 DOM
-
2026-06-14days on market $101,900 Active 87 DOM
-
2026-06-13days on market $101,900 Active 86 DOM
-
2026-06-10days on market $101,900 Active 84 DOM
-
2026-06-09days on market $101,900 Active 83 DOM
-
2026-06-08days on market $101,900 Active 82 DOM
-
2026-06-07days on market $101,900 Active 81 DOM
-
2026-06-03days on market $101,900 Active 77 DOM
-
2026-06-02days on market $101,900 Active 76 DOM
-
2026-06-01days on market $101,900 Active 75 DOM
-
2026-05-31days on market $101,900 Active 74 DOM
-
2026-03-18$101,900 Active 446-char remark
Show marketing remark (446 chars)
Well maintained 2 bedroom, 1.5 bathrooms. Half bath is in the laundry room with washer & dryer, spacious eat in kitchen, & all appliances included. Low condo fee and taxes, make owning this condo cheaper than paying rent. Has a carport for your car, owners are preparing to move in est. 2 weeks. This condo will be ready for you to move in. Great location, close to major shopping, restaurants, WPAFB, medical, I-70, RT 675, I-75, etc.
-
2011-08-02soldstatus $38,000
-
2002-02-15soldstatus $38,900
-
1979-07-23soldstatus $27,500
ⓘ Source: listings_history table (triggers on properties + properties_extension) + one-shot
backfill from property_details.listing_events for pre-trigger history.
Tax reassessment forecast OH · Partial reset (capped growth)
- Current annual tax
- $1,091 · $91/mo
- Projected year-2 tax
- $1,340 · $112/mo
- Expected delta
- +$249/yr (+$21/mo · 22.8%)
ⓘ Screening estimate from a state-policy table — verify with the county assessor before closing.
Climate risk First Street
- Flood 1/10 Low FEMA zone X (unshaded) · 0% chance over 30 yrs
- Wildfire 3/10 Moderate
- Heat 3/10 Moderate 7 d/yr ≥101°F today · 18 d/yr by 30 yrs out
- Wind 2/10 Low
- Air quality 3/10 Moderate 3 unhealthy d/yr today · 4 by 30 yrs out
Nearby sold comps map
Loading sold comps map…
Walkable amenities ~0.75 mi
Loading nearby amenities…
Taxation est. · year 1
- Rental income
- $14,357
- − Mortgage interest
- −$5,708
- − Property taxes
- −$1,091
- − Insurance
- −$510
- − Repairs & maintenance
- −$1,149
- − Management
- −$1,149
- − HOA
- −$1,956
- − Depreciation
- −$2,964
- Taxable loss
- −$169
- Est. tax savings @ 24.0%
- +$41
- After-tax cash flow
- $1,414/yr
For passive investors: Depreciation is non-cash, so a rental often shows a tax loss while cash-flowing — sheltering income. Rental losses are passive: they offset passive income freely, and up to $25,000/yr can offset ordinary (W-2) income if you actively participate and your MAGI is under $100k (phasing out to $0 by $150k); unused losses carry forward. On sale, claimed depreciation is recaptured at up to 25%, and gains may owe capital-gains tax (a 1031 exchange can defer both). Figures are a year-1 estimate at your 24.0% rate — not tax advice; consult a CPA.
Schools (NCES district)
- District
- Huber Heights City
- NCES district ID
- 3904875
- Math proficiency
- 29% ▼ -22.00%
- Reading proficiency
- 47% ▼ -11.00%
- Median HH income
- $55,943
- Composite
- 33.33/100
- National rank
- #5499
- State rank
- #544 of 656 in OH
Livability — Huber Heights
- Score
- 71/100
- State rank
- #436
- US rank
- #7187
Category grades
Schools grade is shown separately in the Schools card above.
Census & demographics
- Census place
- Huber Heights, OH
- County
- Montgomery County · 459,541 people
- City population
- 50,725
- Metro
- Dayton-Kettering, OH
- Population (ZIP)
- 50,725
- Household income
- $80,605
- Rent vs Own
- Severe rent burden
- 911.0
Population outlook (Montgomery County) Hauer SSP2
- Today (2025)
- 523,241 people
- By 2030
- 514,948 · -1.6%
- By 2040
- 493,378 · -5.7%
- By 2050
- 469,639 · -10.2%
- By 2075
- 418,360 · -20.0%
- By 2100
- 353,315 · -32.5%
Race, ethnicity, and origin ACS 2023
- Neighborhood character
- Predominantly White (71%)
- Race & ethnicity
- White 71% Black 15% Two or more races 8% Hispanic / Latino 5% Asian 3%
- Common ancestry
- Slovak 2% Lithuanian 2% Italian 2%
- Foreign-born
- 7% · Canada, Vietnam, South Korea
- Languages at home
- 91% English-only · Spanish 3% Other Asian/Pacific 2% Tagalog/Filipino 1%
Political lean MEDSL · Montgomery
- 2024 margin
- Toss-up / Even · D 49.8% · R 49.3%
- 2008→2024 swing
- -5.8pp toward R · 2008: 6.2pp · 2024: 0.5pp
- All cycles
- 2024: D+0.5 2020: D+2.2 2016: R+1.2 2012: D+3.1 2008: D+6.2
Not yet ingested
- Civics
- —
Market trends
- HPI YoY
- ▼ -228.44%
- Current HPI
- 161.8116
- Rent YoY
- ▲ 0.23%
- Metro
- Dayton-Kettering, OH
- State GDP YoY
- ▲ 1.98%
- F500 in state
- 48
Industry mix (Fortune 500 HQ in OH)
| Industry | F500 HQs | Revenue |
|---|---|---|
| Insurance | 3 | $145B |
|
||
| Industrial Machinery | 3 | $49B |
|
||
| Financial Services | 3 | $24B |
|
||
| Consumer Goods | 2 | $93B |
|
||
| Aerospace / Defense | 2 | $47B |
|
||
| Utilities | 2 | $33B |
|
||
Price history
+270.5% since first listed4 events — show timeline
- 2026-03-18 Listed $101,900 Dayton MLS
- 2011-08-02 Sold (Public Records) $38,000 Public Records
- 2002-02-15 Sold (Public Records) $38,900 Public Records
- 1979-07-23 Sold (Public Records) $27,500 Public Records
Property tax history
+18.8%/yrLatest (2025): $1,091 · -0.0% YoY. Source: county tax records.
Cash-flow waterfall
monthlySold comps — $/sqft
last 12 mo · ≤1 miLoading sold comps…