19026 Encanto Aly · San Antonio, TX
Flood risk 1/10 · Minimal
- FEMA flood zone
- X (unshaded)
- Chance of flooding over 30 yrs
- 0.0%
- Est. flood insurance / yr
- $507 – $1,088
Fire risk 6/10 · Moderate
- Est. fire insurance / yr
- $1,222 – $2,270
Heat risk 8/10 · Major
- Hot days now (above 109°F)
- 7 days/yr
- Hot days in 30 yrs
- 22 days/yr
Wind risk 8/10 · Major
- Chance of severe wind over 30 yrs
- 80.0%
Air-quality risk 1/10 · Minimal
- Unhealthy air days now
- 0 days/yr
- Unhealthy air days in 30 yrs
- 0 days/yr
Risk factors via First Street. Map © Google.
Why this score? — see what drove the C grade
The composite is a weighted blend of 9 inputs, each scored 0–100. Each bar is that input's sub-score; the figure is the points it added to the 100-point composite (weight × sub-score).
- Cash flow +16.3/30.0
- ARV discount +13.7/15.0
- Appreciation +7.0/10.0
- DSCR +5.0/10.0
- 1% rule +4.7/10.0
- Livability +4.0/5.0
- Schools +3.4/10.0
- Rent growth +2.5/5.0
- Condition / age +2.5/5.0
$185,999
🖨 Deal sheet 📄 Offer letter ✓ Due diligence
Listing remarks
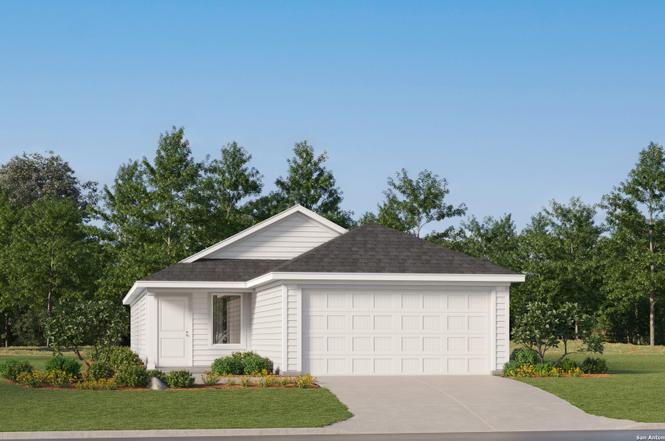
The Idlewood - This single-level home showcases a spacious open floorplan shared between the kitchen, dining area and family room for easy entertaining, along with access to an outdoor space. An owner's suite enjoys a private location in a rear corner of the home, complemented by an en-suite bathroom and walk-in closet. There are two secondary bedrooms at the front of the home, ideal for household members and overnight guests. Estimated Completion July 2026. The completion date, prices and features may vary and are subject to change. Please verify with Lennar directly. Photos are for illustrative purposes only.
Key facts
- Walk-in closet
- Open floorplan
- Outdoor space
Tags
Property features AI
Finance
- Financial info: Down payment assistance available (Down Payment Resource eligible)
- HOA & community: Mandatory HOA; HOA fee $425 annually; Association transfer fee $450
Exterior
- Parking: 2-car garage
- Utilities: Electricity supplied by CPS; Water supplied by SAWS; Sewer supplied by SAWS; Garbage service by Frontier; Water system and sewer system connections
- Home design: New construction; Cement fiber exterior; Slab foundation; Composition roof
- Construction: Built by Lennar
- Exterior features: Privacy fence
Interior
- Kitchen: Kitchen (10 x 8); Stove/Range; Dishwasher
- Bedrooms: Master bedroom on lower level with full bath (14 x 15); Bedroom 2 (11 x 12); Bedroom 3 (11 x 12)
- Flooring: Carpeting; Vinyl flooring
- Bathrooms: 2 full bathrooms; Master bathroom with tub/shower combination (8 x 6)
- Heating & cooling: Central heating; Electric and natural gas heat; Central air conditioning
- Interior features: Open floor plan; Breakfast bar; Utility room inside; Cable TV available; 1 living area
- Laundry & utility: Washer connection; Dryer connection; Laundry on main level
Neighborhood map
What this means for you Summary
Snapshot
- This is a 3-bed/2.0-bath single-family listed at $186k.
Deal economics
- At list price, monthly cash flow is $102 ($1k/yr) — positive.
- The deal already cash-flows at list — no discount required.
- To meet the 1% rule (rent ≥ 1% of price), the offer needs to be $180k (3.2% below list).
- Recommended offer: $180k (3.2% below list) — sets the bar for 1% rule.
- Cap rate 6.9% vs local median 3.8% in San Antonio — top-decile yield for the area; either an underpriced asset or a hidden risk that comps aren't pricing in. Stress-test before assuming the spread holds.
Location & tenants
- Location reads 80/100 on livability (#31 in TX, #1,616 nationally) — a professional / high-income tenant draw. Strengths: amenities A+, commute A+, cost of living A+; Watch: crime F.
- Somerset ISD (rural): math 41% / reading 39% proficiency, ranked #417 of 826 in TX (top 50%) — families likely to look elsewhere, expect single-tenant / working-renter base with shorter leases; 72% free/reduced lunch — lower-income household profile, screen leases tightly.
- Zoned schools: S/Sgt Michael P Barrera Veterans El (math 42% / reading 37%, grade F, #1,545 of 4,322 statewide, top 38%, 583 students, 89% FRL); Somerset H S (math 12% / reading 25%, grade F, #1,436 of 1,632 statewide, top 88%, 1,148 students, 86% FRL) — zoned schools average 87% FRL vs 72% district-wide (16 pts higher); higher-poverty schools than district average — tighter screening recommended.
- Market conditions: 329 active listings in the ZIP; 1 comparable units currently listed for rent nearby; 8,308 units permitted in Bexar County in 2024 (2,506 in 5+ unit buildings).
Forward outlook
- In year one you build about $9k of equity ($1k loan paydown + $7k appreciation (3.9% local appreciation)).
- Bexar County population projected at +50% by 2050 — long-run rental-demand tailwind backs the buy-and-hold thesis.
- At projected returns (3.9% appreciation + 3.0% rent growth), your $52k cash investment doubles in ~5 years — after that, you're playing with house money.
- By year 5, paydown + projected appreciation supports a ~$37k cash-out refi (75% LTV) — recoverable capital for the next deal without selling this one.
Negotiation context
- It's been on market 58 days — a 3% lower offer ($180k) is reasonable based on typical stale-listing flexibility.
Risks & watch-outs
- Climate carrying-cost: severe wind risk, 80% chance of damaging wind over 30y; major wildfire risk; extreme-heat days projected 7→22/yr by 2055 (HVAC capex compounding) — expect insurance premiums to compound above CPI over the hold.
Questions for the listing agent
- It's been on market 58 days. Have you received any prior offers? Is the seller open to a 3% concession, seller financing, or rate buy-down credit?
- What does the HOA fee cover, when was the last increase, and are there any pending special assessments or reserve-fund shortfalls?
- Is there a deadline driving the sale (1031 exchange, divorce, estate, relocation)? That informs how much negotiation room exists.
- Crime grade is F in this area — have there been break-ins, vandalism, or insurance claims at this property in the last 3 years? What carrier currently insures it and at what premium?
- What's the average days-on-market for RENTAL listings here right now (not sales)? A rising rental-DOM trend means longer vacancies and softer asking-rent achievability than the comps imply.
- What's the recent tenant-quality profile in this submarket — average credit score on applications, eviction rate, late-payment / NSF rate, and stable-employment percentage? A property-management company in the area should have these aggregated.
- How much new for-sale + rental construction is in the pipeline within 1–3 miles? Heavy new supply typically softens prices + rents 12–24 months out; constrained supply supports both.
Investment metrics
- 1% rule
- 0.97% ✗
- Cap rate
- 6.95%
- Cash-on-cash
- 2.34%
- DSCR
- 1.10
- GRM
- 8.6
CMA / ARV
- ARV (on-the-fly)
- $215,883
- Comps found
- 12
Show comp detail 12 sales within ~0.75 mi
| Address | Dist | Beds/Ba | Sqft | Sold | Price | $/sf | Match |
|---|---|---|---|---|---|---|---|
| 19012 Encanto Aly | 0.03mi | 3/2.0 | 1,402 (-1%) | 1mo | $171,999 | $123 | 97 |
| 3715 Garcia Grv | 0.08mi | 3/2.0 | 1,402 (-1%) | 2mo | $193,999 | $138 | 93 |
| 3723 Garcia Grv | 0.09mi | 3/2.0 | 1,411 (0%) | 3mo | $215,999 | $153 | 93 |
| 19008 Arco Aly | 0.18mi | 3/2.0 | 1,402 (-1%) | 13mo | $204,310 | $146 | 80 |
| 4015 Garcia Grv | 0.23mi | 3/2.0 | 1,402 (-1%) | 14mo | $219,900 | $157 | 76 |
| 19004 Arco Aly | 0.18mi | 3/2.0 | 1,459 (+3%) | 13mo | $237,610 | $163 | 75 |
| 19004 Encanto Aly | 0.04mi | 4/2.0 (+1) | 1,575 (+12%) | 1mo | $201,999 | $128 | 73 |
| 3727 Garcia Grv | 0.10mi | 3/2.0 | 1,600 (+13%) | 2mo | $208,999 | $131 | 72 |
| 4007 Garcia Grv | 0.22mi | 3/2.0 | 1,459 (+3%) | 16mo | $219,900 | $151 | 71 |
| 19007 Arco Aly | 0.21mi | 3/2.0 | 1,248 (-12%) | 11mo | $195,610 | $157 | 61 |
| 3923 Garcia Grv | 0.20mi | 3/2.0 | 1,248 (-12%) | 13mo | $206,845 | $166 | 61 |
| 4011 Garcia Grv | 0.23mi | 3/2.0 | 1,248 (-12%) | 15mo | $207,900 | $167 | 58 |
Match score weights: distance 35% · size 25% · config 20% · recency 20%. Top-matched comps best support the ARV.
Projected returns pro-forma
3.94% appreciation · 3.0% rent growth · sell at horizon
- IRR
- 12.2%
- Equity multiple
- 1.74×
- Total profit
- $38,396
- Equity at exit
- $93,708
- IRR
- 13.7%
- Equity multiple
- 3.24×
- Total profit
- $116,471
- Equity at exit
- $152,793
Cash invested: $52,080 (down + closing). Projections, not guarantees.
Landlord ↔ Tenant lean methodology
- Overall (STATE)
- 87 Strongly Landlord-Friendly
- State Texas
- 87 Strongly Landlord-Friendly · R+5
- County
- — inherits STATE
- City
- — inherits STATE
ZIP-level market 78264
- Home prices YoY
- 1.3%
- Active inventory
- 329
- Price-to-rent
- 8.6×
Monthly cashflow live
- Estimated rent
- $1,800 medium interval (Pro) →
- Mortgage (P&I)
- −$975
- Tax est. 1.5%
- −$232 /mo · $2,790/yr
- Insurance
- −$77
- HOA
- −$35
- Vacancy / Maint / Mgmt
- −$378
- Net cashflow
- $102
Break-even live
UW: 25.0% down · 7.5% · 30yr · 1.5% tax · 5.0% vac · 8.0% maint · 8.0% mgmt
Financing live
Cash to close
- Down payment
- $46,500
- Closing costs
- $5,580
- Reserves months
- —
- Total cash needed
- —
Loan-product check · same deal, 3 products live
Conventional
25% down · 7.5% · 30yr
- Down + closing
- —
- Monthly P&I
- —
- Monthly cashflow
- —
- DSCR
- —
- Eligible?
- —
Personal DTI + credit; lowest rate.
DSCR
20% down · 8.5% · 30yr
- Down + closing
- —
- Monthly P&I
- —
- Monthly cashflow
- —
- DSCR
- —
- Eligible?
- —
No personal income docs; deal must DSCR.
Hard money
10% down · 12.0% · 12mo
- Down + closing
- —
- Monthly P&I
- —
- Monthly cashflow
- —
- DSCR
- —
- Eligible?
- —
Short-term bridge; refi at stabilization.
Rent comps 1 comps
| Address | Beds | Baths | Sqft | Rent | $/sqft | DOM | Units | Dist |
|---|---|---|---|---|---|---|---|---|
| 4206 April Breeze Unit 103 Von Ormy, TX | 3.0 | 2.5 | 1832 | $1,800 | $0.98 | 20d | 1 | 0.73mi |
HOA detail
- Monthly dues
- $35 · $420/yr
Listing history 10 events
-
2026-05-09status Pending
-
2026-05-06price $185,999
-
2026-04-30price $192,999
-
2026-04-29price $199,999
-
2026-04-18price $201,999
-
2026-04-04price $205,999
-
2026-04-03price $207,999
-
2026-03-28price $211,999
-
2026-03-25price $212,999
-
2026-03-12$211,999 New
ⓘ Source: listings_history table (triggers on properties + properties_extension) + one-shot
backfill from property_details.listing_events for pre-trigger history.
Climate risk First Street
- Flood 1/10 Low FEMA zone X (unshaded) · 0% chance over 30 yrs
- Wildfire 6/10 Major
- Heat 8/10 Severe 7 d/yr ≥109°F today · 22 d/yr by 30 yrs out
- Wind 8/10 Severe 80% chance of damaging wind over 30 yrs
- Air quality 1/10 Low 0 unhealthy d/yr today · 0 by 30 yrs out
Nearby sold comps map
Loading sold comps map…
Walkable amenities ~0.75 mi
Loading nearby amenities…
Taxation est. · year 1
- Rental income
- $21,600
- − Mortgage interest
- −$10,419
- − Property taxes
- −$2,790
- − Insurance
- −$930
- − Repairs & maintenance
- −$1,728
- − Management
- −$1,728
- − HOA
- −$420
- − Depreciation
- −$5,411
- Taxable loss
- −$1,826
- Est. tax savings @ 24.0%
- +$438
- After-tax cash flow
- $1,657/yr
For passive investors: Depreciation is non-cash, so a rental often shows a tax loss while cash-flowing — sheltering income. Rental losses are passive: they offset passive income freely, and up to $25,000/yr can offset ordinary (W-2) income if you actively participate and your MAGI is under $100k (phasing out to $0 by $150k); unused losses carry forward. On sale, claimed depreciation is recaptured at up to 25%, and gains may owe capital-gains tax (a 1031 exchange can defer both). Figures are a year-1 estimate at your 24.0% rate — not tax advice; consult a CPA.
Schools (NCES district)
- District
- Somerset ISD
- NCES district ID
- 4840740
- Math proficiency
- 41% ▬ 0.00%
- Reading proficiency
- 39% ▲ 4.00%
- Median HH income
- $44,712
- Composite
- 34.01/100
- National rank
- #5315
- State rank
- #417 of 826 in TX
Livability — San Antonio
- Score
- 80/100
- State rank
- #31
- US rank
- #1616
Category grades
Schools grade is shown separately in the Schools card above.
Census & demographics
- City population
- 1,806,925
- Population (ZIP)
- 11,702
Population outlook (Bexar County) Hauer SSP2
- Today (2025)
- 2,336,851 people
- By 2030
- 2,560,728 · +9.6%
- By 2040
- 3,020,569 · +29.3%
- By 2050
- 3,493,522 · +49.5%
- By 2075
- 4,668,459 · +99.8%
- By 2100
- 5,533,242 · +136.8%
Race, ethnicity, and origin ACS 2023
- Neighborhood character
- Predominantly Hispanic (80%)
- Race & ethnicity
- Hispanic / Latino 80% Two or more races 35% White 17% Black 2% Native American 1%
- Hispanic origin (detail)
- Mexican 73%
- Common ancestry
- Lithuanian 1% Serbian 1% Greek 1%
- Foreign-born
- 14% · Canada
- Languages at home
- 48% English-only · Spanish 51% Tagalog/Filipino 0%
Political lean MEDSL · Bexar
- 2024 margin
- Lean D (+9.8) · D 54.3% · R 44.6% · Other 1.1%
- 2008→2024 swing
- +4.2pp toward D · 2008: 5.6pp · 2024: 9.8pp
- All cycles
- 2024: D+9.8 2020: D+18.2 2016: D+13.5 2012: D+4.6 2008: D+5.6
Not yet ingested
- Civics
- —
Market trends
- HPI YoY
- ▲ 3.94%
- Current HPI
- 298.8446
- Rent YoY
- —
- Metro
- —
- State GDP YoY
- ▲ 3.95%
- F500 in state
- 110
Industry mix (Fortune 500 HQ in TX)
| Industry | F500 HQs | Revenue |
|---|---|---|
| Energy | 16 | $1,198B |
|
||
| Technology | 5 | $198B |
|
||
| Engineering / Construction | 4 | $72B |
|
||
| Energy Services | 3 | $60B |
|
||
| Utilities | 3 | $41B |
|
||
| Healthcare | 2 | $330B |
|
||
Price history
-12.3% since first listed10 events — show timeline
- 2026-05-09 Pending — LERA
- 2026-05-06 Price Changed $185,999 LERA
- 2026-04-30 Price Changed $192,999 LERA
- 2026-04-29 Price Changed $199,999 LERA
- 2026-04-18 Price Changed $201,999 LERA
- 2026-04-04 Price Changed $205,999 LERA
- 2026-04-03 Price Changed $207,999 LERA
- 2026-03-28 Price Changed $211,999 LERA
- 2026-03-25 Price Changed $212,999 LERA
- 2026-03-12 Listed $211,999 LERA
Cash-flow waterfall
monthlySold comps — $/sqft
last 12 mo · ≤1 miLoading sold comps…