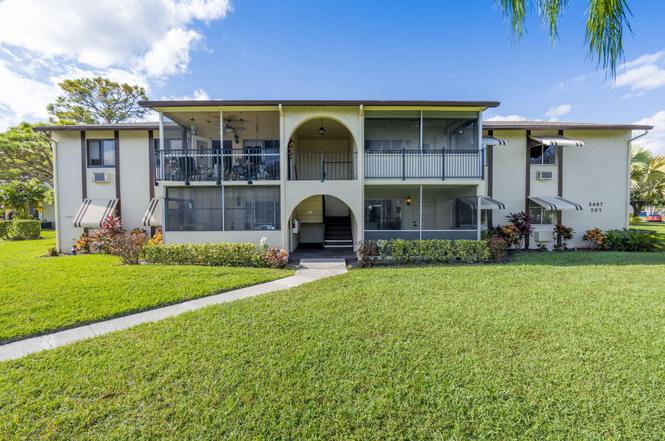
3487 La Palmas Ct Unit D-1 · Greenacres, FL
Flood risk 1/10 · Minimal
- FEMA flood zone
- X (unshaded)
- Chance of flooding over 30 yrs
- 0.0%
- Est. flood insurance / yr
- $507 – $1,088
Fire risk 1/10 · Minimal
- Est. fire insurance / yr
- $947 – $1,759
Heat risk 9/10 · Severe
- Hot days now (above 105°F)
- 3 days/yr
- Hot days in 30 yrs
- 8 days/yr
Wind risk 10/10 · Severe
- Chance of severe wind over 30 yrs
- 99.0%
Air-quality risk 2/10 · Minimal
- Unhealthy air days now
- 0 days/yr
- Unhealthy air days in 30 yrs
- 2 days/yr
Risk factors via First Street. Map © Google.
Why this score? — see what drove the C+ grade
The composite is a weighted blend of 9 inputs, each scored 0–100. Each bar is that input's sub-score; the figure is the points it added to the 100-point composite (weight × sub-score).
- Cash flow +25.8/30.0
- 1% rule +9.5/10.0
- DSCR +8.6/10.0
- ARV discount +7.5/15.0
- Schools +4.3/10.0
- Livability +3.5/5.0
- Rent growth +2.8/5.0
- Condition / age +2.5/5.0
- Appreciation +0.0/10.0
$135,000
🖨 Deal sheet (PDF) 📄 Offer letter ✓ Due diligence
Listing remarks
Step into this beautifully remodeled first-floor home offering modern comfort and style throughout. Enjoy a spacious open layout with a newer A/C unit, updated bathroom featuring luxurious finishes, and a screened-in patio perfect for relaxing year-round. The kitchen shines with stainless steel appliances and plenty of storage ideal for both everyday living and entertaining. One of the rare perks at this price point: your own washer and dryer conveniently located in the unit! This vibrant community offers fantastic amenities including a pool, bocce ball, and shuffleboard courts — everything you need for active Florida living. The HOA covers exterior maintenance, lawn care, pool and
Key facts
- Newer a/c unit
- Screened-in patio
- Spacious open layout
Tags
Neighborhood map
What this means for you Summary
Snapshot
- This is a 2-bed/1.0-bath condo listed at $135k.
Deal economics
- At list price, monthly cash flow is $326 ($4k/yr) — positive.
- The deal already cash-flows at list — no discount required.
- Meets the 1% rule at list price ($2k rent vs $135k).
- Recommended offer: $119k (12.0% below list) — sets the bar for market timing.
Location & tenants
- Location reads 69/100 on livability (#490 in FL) — a middle-class / working-renter tenant base. Strengths: cost of living A+, housing A+, health & safety A; Watch: employment D, amenities F, commute F.
- Palm Beach (suburban): math 46% / reading 53% proficiency, ranked #34 of 73 in FL (top 47%) — families likely to look elsewhere, expect single-tenant / working-renter base with shorter leases.
- Zoned schools: Liberty Park Elementary School (math 25% / reading 38%, grade F, #1,841 of 2,144 statewide, top 86%, 845 students, 76% FRL); L C Swain Middle School (math 26% / reading 33%, grade F, #469 of 571 statewide, top 84%, 1,451 students, 74% FRL); John I. Leonard High School (math 17% / reading 35%, grade F, #494 of 667 statewide, top 75%, 3,549 students, 67% FRL) — zoned schools average 72% FRL vs 52% district-wide (20 pts higher); higher-poverty schools than district average — tighter screening recommended.
- Zoned-school proficiency averages 29% at this address vs 50% district-wide (-20 pts) — the specific schools serving this property underperform the Palm Beach average; the district grade overstates school quality for this exact location.
- Market conditions: Rents rising (+1.3%/yr); 354 active listings in the ZIP; 40 comparable units currently listed for rent nearby; rentals at typical pace (median 22d on market — plan ~3-4 weeks tenant-placement turnaround); 3,974 units permitted in Palm Beach County in 2024 (1,012 in 5+ unit buildings).
- This rent runs 32% of the median local income ($74k/yr) — at the standard rent-burdened threshold; future hikes will face affordability resistance.
Forward outlook
- Local home prices are declining (-3.0%/yr); year-one equity from $933 of loan paydown is wiped out by about $4k of value loss. Plan a longer hold.
- Palm Beach County population projected at +30% by 2050 — long-run rental-demand tailwind backs the buy-and-hold thesis.
Negotiation context
- It's been on market 158 days — a 12% lower offer ($119k) is reasonable based on typical stale-listing flexibility.
- 9 sale attempts since 26y ago; this cycle's ask has dropped $24k (15%) from the opening price — seller is motivated, your offer sets the floor, not the list.
- Current owner paid $75k; list at $135k implies a 80% gain — meaningful room to come down on a strong offer.
Risks & watch-outs
- Watch-outs: HOA is 21% of rent.
- Climate carrying-cost: severe wind risk, 99% chance of damaging wind over 30y; extreme-heat days projected 3→8/yr by 2055 (HVAC capex compounding) — expect insurance premiums to compound above CPI over the hold.
Questions for the listing agent
- It's been on market 158 days. Have you received any prior offers? Is the seller open to a 12% concession, seller financing, or rate buy-down credit?
- Built in 1977 — when were the roof, HVAC, electrical panel, plumbing, and water heater last replaced?
- What does the HOA fee cover, when was the last increase, and are there any pending special assessments or reserve-fund shortfalls?
- Any open or pending special assessments — roof, HVAC, plumbing, elevator, façade? What's the per-unit balance and payoff schedule, and is the seller paying it off at close or rolling it to the buyer?
- Why hasn't it sold? Are there any deal-killer items the seller is aware of (foundation, flood, title, zoning, code violations)?
- Is there a deadline driving the sale (1031 exchange, divorce, estate, relocation)? That informs how much negotiation room exists.
- Schools are D-rated, which usually means shorter tenancies and higher turnover. Who's the typical renter profile here, and what's been the actual vacancy rate?
- What's the average days-on-market for RENTAL listings here right now (not sales)? A rising rental-DOM trend means longer vacancies and softer asking-rent achievability than the comps imply.
- What's the recent tenant-quality profile in this submarket — average credit score on applications, eviction rate, late-payment / NSF rate, and stable-employment percentage? A property-management company in the area should have these aggregated.
- How much new apartment / multifamily construction is in the pipeline within 1–3 miles? Heavy new supply (>2% of stock underway) typically softens rents 12–24 months out; light construction supports rent growth.
Investment metrics
- 1% rule
- 1.45% ✓
- Cap rate
- 9.19%
- Cash-on-cash
- 10.35%
- DSCR
- 1.46
- GRM
- 5.8
CMA / ARV
No comps found within radius.
Projected returns pro-forma
-3.0% appreciation · 1.33% rent growth · sell at horizon
- IRR
- -3.0%
- Equity multiple
- 0.89×
- Total profit
- $-4,135
- Equity at exit
- $20,129
- IRR
- 4.4%
- Equity multiple
- 1.30×
- Total profit
- $11,152
- Equity at exit
- $11,672
Cash invested: $37,800 (down + closing). Projections, not guarantees.
Landlord ↔ Tenant lean methodology
- Overall (STATE)
- 87 Strongly Landlord-Friendly
- State Florida
- 87 Strongly Landlord-Friendly · R+3
- County
- — inherits STATE
- City
- — inherits STATE
ZIP-level market 33463
- Home prices YoY
- -30.9%
- Rents YoY
- 1.3%
- Active inventory
- 354
- Price-to-rent
- 5.8×
Monthly cashflow live
- Estimated rent
- $1,955 high interval (Pro) →
- Mortgage (P&I)
- −$708
- Tax from tax record
- −$37 /mo · $443/yr
- Insurance
- −$56
- HOA
- −$417
- Vacancy / Maint / Mgmt
- −$410
- Net cashflow
- $326
Break-even live
Sensitivity live
| Price | -10% $402 | -5% $364 | +0% $326 | +5% $288 | +10% $250 |
|---|---|---|---|---|---|
| Rent | -10% $172 | -5% $249 | +0% $326 | +5% $403 | +10% $480 |
| Rate | -1.0pp $394 | -0.5pp $360 | base $326 | +0.5pp $291 | +1.0pp $255 |
UW: 25.0% down · 7.5% · 30yr · 1.5% tax · 5.0% vac · 8.0% maint · 8.0% mgmt
Financing live
Cash to close
- Down payment
- $33,750
- Closing costs
- $4,050
- Reserves months
- —
- Total cash needed
- —
Loan-product check · same deal, 3 products live
Conventional
25% down · 7.5% · 30yr
- Down + closing
- —
- Monthly P&I
- —
- Monthly cashflow
- —
- DSCR
- —
- Eligible?
- —
Personal DTI + credit; lowest rate.
DSCR
20% down · 8.5% · 30yr
- Down + closing
- —
- Monthly P&I
- —
- Monthly cashflow
- —
- DSCR
- —
- Eligible?
- —
No personal income docs; deal must DSCR.
Hard money
10% down · 12.0% · 12mo
- Down + closing
- —
- Monthly P&I
- —
- Monthly cashflow
- —
- DSCR
- —
- Eligible?
- —
Short-term bridge; refi at stabilization.
Rent comps 40 comps
| Address | Beds | Baths | Sqft | Rent | $/sqft | DOM | Units | Dist |
|---|---|---|---|---|---|---|---|---|
| 3490 La Jardin Ct Unit B2 Greenacres, FL | 1.0 | 1.0 | 780 | $1,385 | $1.78 | 4d | 1 | 0.02mi |
| 5971 La Pinata Blvd Unit B1 Greenacres, FL | 2.0 | 1.0 | 920 | $1,750 | $1.90 | 26d | 1 | 0.15mi |
| 342 Pine Ridge Cir Unit B2 Greenacres, FL | 2.0 | 1.5 | 935 | $2,200 | $2.35 | 16d | 1 | 0.15mi |
| 3808 Inlet Cir #3808 Greenacres, FL | 2.0 | 2.0 | 992 | $2,200 | $2.22 | 0d | 1 | 0.29mi |
| 5855 S 37th St Unit 5857 Greenacres, FL | 2.0 | 1.0 | 747 | $1,949 | $2.61 | 1d | 1 | 0.30mi |
| 6061 10th Ave N #242 Greenacres, FL | 2.0 | 2.0 | 855 | $2,000 | $2.34 | 6d | 1 | 0.37mi |
| 6031 10th Ave N #219 Greenacres, FL | 3.0 | 2.0 | 1078 | $2,400 | $2.23 | 6d | 1 | 0.39mi |
| 6023 10th Ave N #114 Greenacres, FL | 2.0 | 2.0 | 1050 | $2,000 | $1.90 | 0d | 1 | 0.43mi |
| 6170 Dodd Rd Unit The Greenacres, FL | 2.0 | 2.0 | 1000 | $2,600 | $2.60 | 26d | 1 | 0.54mi |
| 5775 Fernley Dr W #131 West Palm Beach, FL | 2.0 | 2.0 | 1072 | $2,000 | $1.87 | 13d | 1 | 0.58mi |
| 826 Sky Pine Way Greenacres, FL | 2.0–3.0 | 2.0 | 1304 | $1,800 | $1.38 | 0d | 2 | 0.61mi |
| 813 Sky Pine Way Unit F2 Greenacres, FL | 2.0 | 2.0 | 1111 | $1,725 | $1.55 | 4d | 1 | 0.63mi |
| 813 Sky Pine Way Unit F2 Greenacres, FL | 2.0 | 2.0 | 1111 | $1,725 | $1.55 | 16d | 1 | 0.63mi |
| 812 Sky Pine Way Greenacres, FL | 2.0 | 2.0 | 1064 | $2,100 | $1.97 | 26d | 1 | 0.67mi |
| 712 Sunny Pine Way Greenacres, FL | 2.0 | 2.0 | 1068 | $2,150 | $2.01 | 26d | 1 | 0.68mi |
| 811 Sky Pine Way Unit F2 Greenacres, FL | 2.0 | 2.0 | 1064 | $1,550 | $1.46 | 22d | 1 | 0.69mi |
| 629 Sea Pine Way Unit D3 Greenacres, FL | 2.0 | 2.0 | 1005 | $2,100 | $2.09 | 24d | 1 | 0.70mi |
| 2715 Emory Dr W Unit C West Palm Beach, FL | 1.0 | 1.5 | 661 | $1,425 | $2.16 | 19d | 1 | 0.71mi |
| 802 Sky Pine Way Unit E2 Greenacres, FL | 2.0 | 2.0 | 1111 | $1,750 | $1.58 | 9d | 1 | 0.71mi |
| 2980 Crosley Dr E Unit F West Palm Beach, FL | 2.0 | 1.0 | 829 | $1,575 | $1.90 | 1d | 1 | 0.72mi |
| 628 Sea Pine Way Unit A2 Greenacres, FL | 2.0 | 2.0 | 1005 | $2,100 | $2.09 | 18d | 1 | 0.74mi |
| 718 Sunny Pine Way Unit H2 Greenacres, FL | 2.0 | 2.0 | 1111 | $2,000 | $1.80 | 22d | 1 | 0.77mi |
| 718 Sunny Pine Way Unit H2 Greenacres, FL | 2.0 | 2.0 | 1111 | $2,000 | $1.80 | 7d | 1 | 0.77mi |
| 4181 S 57th Ave Unit D Greenacres, FL | 2.0 | 2.0 | 847 | $1,850 | $2.18 | 26d | 1 | 0.77mi |
| 4191 S 57th Ave Unit H Greenacres, FL | 2.0 | 2.0 | 847 | $1,750 | $2.07 | 26d | 1 | 0.77mi |
| 2647 Emory Dr W Unit C West Palm Beach, FL | 1.0 | 1.0 | 612 | $1,250 | $2.04 | 26d | 1 | 0.78mi |
| 703 Sunny Pine Way Unit G2 Greenacres, FL | 2.0 | 2.0 | 1068 | $2,000 | $1.87 | 17d | 1 | 0.79mi |
| 4205 S 57th Ave Unit G Greenacres, FL | 2.0 | 2.0 | 1046 | $1,900 | $1.82 | 26d | 1 | 0.80mi |
| 2625 Emory Dr W Unit F West Palm Beach, FL | 2.0 | 2.0 | 895 | $1,700 | $1.90 | 26d | 1 | 0.80mi |
| 720 Sunny Pine Way Unit G1 Greenacres, FL | 2.0 | 2.0 | 1111 | $2,000 | $1.80 | 21d | 1 | 0.80mi |
| 2783 Dudley Dr E Unit D West Palm Beach, FL | 2.0 | 2.0 | 910 | $1,650 | $1.81 | 18d | 1 | 0.81mi |
| 3386 Lucerne Park Dr Greenacres, FL | 2.0 | 2.0 | 1059 | $1,950 | $1.84 | 26d | 1 | 0.83mi |
| 3350 Perimeter Dr #1323 Greenacres, FL | 2.0 | 2.0 | 1059 | $1,975 | $1.86 | 4d | 1 | 0.83mi |
| 2723 Dudley Dr W Unit G West Palm Beach, FL | 1.0 | 1.0 | 611 | $1,300 | $2.13 | 26d | 1 | 0.83mi |
| 2854 Crosley Dr E Unit J West Palm Beach, FL | 1.0 | 1.0 | 612 | $1,300 | $2.12 | 26d | 1 | 0.83mi |
| 2805 Crosley Dr E Unit E West Palm Beach, FL | 1.0 | 1.5 | 662 | $1,250 | $1.89 | 26d | 1 | 0.84mi |
| 2515 Emory Dr W Unit A West Palm Beach, FL | 2.0 | 2.0 | 895 | $1,750 | $1.96 | 26d | 1 | 0.86mi |
| 2515 Emory Dr W Unit A West Palm Beach, FL | 2.0 | 2.0 | 895 | $1,700 | $1.90 | 4d | 1 | 0.86mi |
| 3045 Jackson Ave Greenacres, FL | 2.0 | 1.0 | 900 | $1,775 | $1.97 | 26d | 1 | 0.87mi |
| 2551 Emory Dr W Unit A West Palm Beach, FL | 1.0 | 1.5 | 661 | $1,600 | $2.42 | 26d | 1 | 0.88mi |
HOA detail condo
- Monthly dues
- $417 · $5,004/yr
- Likely covers
- landscapingexterior maint.pool
- Assessments
- None detected in remarks — confirm with the listing agent.
Listing history 33 events
-
2026-04-25status Pending
-
2026-03-23status Active
-
2026-03-13status Pending
-
2026-02-14price $135,000
-
2026-01-05price $140,000
-
2025-12-19price $145,000
-
2025-11-28price $149,000
-
2025-11-07$159,000 Active
-
2025-06-10historical
-
2025-05-02price $138,900
-
2025-04-11price $139,000
-
2025-03-08$145,000 Active
-
2025-03-08historical
-
2025-01-15status Active
-
2025-01-02historical
-
2024-12-16price $144,900
-
2024-11-18price $145,000
-
2024-10-03price $149,000
-
2024-08-18price $154,900
-
2024-07-27$164,900 Active
-
2013-09-22historical
-
2013-09-22historical
-
2005-11-15soldstatus $75,100
-
2004-03-09soldstatus $67,907
-
2002-09-18$59,900
-
2001-12-26soldstatus $31,000
-
2001-11-13soldstatus $31,000
-
2001-11-01historical
-
2001-06-14$34,900
-
2000-12-11$39,900
-
2000-12-11historical
-
2000-07-06$40,900
-
1994-07-20soldstatus $28,000
ⓘ Source: listings_history table (triggers on properties + properties_extension) + one-shot
backfill from property_details.listing_events for pre-trigger history.
Tax reassessment forecast FL · Resets to sale price
- Current annual tax
- $443 · $37/mo
- Projected year-2 tax
- $1,120 · $93/mo
- Expected delta
- +$677/yr (+$56/mo · 152.8%)
ⓘ Screening estimate from a state-policy table — verify with the county assessor before closing.
Climate risk First Street
- Flood 1/10 Low FEMA zone X (unshaded) · 0% chance over 30 yrs
- Wildfire 1/10 Low
- Heat 9/10 Extreme 3 d/yr ≥105°F today · 8 d/yr by 30 yrs out
- Wind 10/10 Extreme 99% chance of damaging wind over 30 yrs
- Air quality 2/10 Low 0 unhealthy d/yr today · 2 by 30 yrs out
Nearby sold comps map
Loading sold comps map…
Walkable amenities ~0.75 mi
Loading nearby amenities…
Taxation est. · year 1
- Rental income
- $23,456
- − Mortgage interest
- −$7,562
- − Property taxes
- −$443
- − Insurance
- −$675
- − Repairs & maintenance
- −$1,877
- − Management
- −$1,877
- − HOA
- −$5,004
- − Depreciation
- −$3,927
- Taxable income
- $2,092
- Est. tax owed @ 24.0%
- −$502
- After-tax cash flow
- $3,411/yr
For passive investors: Depreciation is non-cash, so a rental often shows a tax loss while cash-flowing — sheltering income. Rental losses are passive: they offset passive income freely, and up to $25,000/yr can offset ordinary (W-2) income if you actively participate and your MAGI is under $100k (phasing out to $0 by $150k); unused losses carry forward. On sale, claimed depreciation is recaptured at up to 25%, and gains may owe capital-gains tax (a 1031 exchange can defer both). Figures are a year-1 estimate at your 24.0% rate — not tax advice; consult a CPA.
Schools (NCES district)
- District
- Palm Beach
- NCES district ID
- 1201500
- Math proficiency
- 46% ▼ -16.00%
- Reading proficiency
- 53% ▼ -4.00%
- Median HH income
- $53,943
- Composite
- 42.72/100
- National rank
- #3160
- State rank
- #34 of 73 in FL
Livability — Greenacres
- Score
- 69/100
- State rank
- #490
- US rank
- #9008
Category grades
Schools grade is shown separately in the Schools card above.
Census & demographics
- Census place
- Greenacres, FL
- County
- Palm Beach County · 1,438,312 people
- City population
- 65,478
- Metro
- Miami-Fort Lauderdale-Pompano Beach, FL
- Population (ZIP)
- 65,478
- Household income
- $73,865
- Rent vs Own
- Severe rent burden
- 1466.0
Population outlook (Palm Beach County) Hauer SSP2
- Today (2025)
- 1,637,487 people
- By 2030
- 1,743,255 · +6.5%
- By 2040
- 1,948,712 · +19.0%
- By 2050
- 2,132,979 · +30.3%
- By 2075
- 2,530,027 · +54.5%
- By 2100
- 2,706,979 · +65.3%
Race, ethnicity, and origin ACS 2023
- Neighborhood character
- Diverse neighborhood (Simpson 0.70)
- Race & ethnicity
- Hispanic / Latino 38% Black 29% White 27% Two or more races 11% Asian 4%
- Hispanic origin (detail)
- Mexican 8% Puerto Rican 6% Cuban 5% Dominican 2%
- Common ancestry
- Hispanic 15% Romanian 1% Slovak 1%
- Foreign-born
- 39% · Canada, Jamaica, China
- Languages at home
- 45% English-only · Spanish 32% French/Haitian/Cajun 17% Other Indo-European 2%
Political lean MEDSL · Palm Beach
- 2024 margin
- Toss-up / Even · D 50.0% · R 49.2%
- 2008→2024 swing
- -22.1pp toward R · 2008: 22.9pp · 2024: 0.8pp
- All cycles
- 2024: D+0.8 2020: D+12.8 2016: D+15.3 2012: D+17.0 2008: D+22.9
Not yet ingested
- Civics
- —
Market trends
- HPI YoY
- ▼ -175.33%
- Current HPI
- 392.055
- Rent YoY
- ▲ 1.33%
- Metro
- Miami-Fort Lauderdale-Pompano Beach, FL
- State GDP YoY
- ▲ 3.28%
- F500 in state
- 36
Industry mix (Fortune 500 HQ in FL)
| Industry | F500 HQs | Revenue |
|---|---|---|
| Industrial Technology | 2 | $29B |
|
||
| Insurance | 2 | $17B |
|
||
| Retail | 1 | $60B |
|
||
| Technology Distribution | 1 | $58B |
|
||
| Homebuilding | 1 | $35B |
|
||
| Technology Manufacturing | 1 | $35B |
|
||
Price history
+382.1% since first listed33 events — show timeline
- 2026-04-25 Pending — Beaches MLS
- 2026-03-23 Relisted — Beaches MLS
- 2026-03-13 Pending — Beaches MLS
- 2026-02-14 Price Changed $135,000 Beaches MLS
- 2026-01-05 Price Changed $140,000 Beaches MLS
- 2025-12-19 Price Changed $145,000 Beaches MLS
- 2025-11-28 Price Changed $149,000 Beaches MLS
- 2025-11-07 Listed $159,000 Beaches MLS
- 2025-06-10 Listing Removed — Beaches MLS
- 2025-05-02 Price Changed $138,900 Beaches MLS
- 2025-04-11 Price Changed $139,000 Beaches MLS
- 2025-03-08 Listing Removed — Beaches MLS
- 2025-03-08 Listed $145,000 Beaches MLS
- 2025-01-15 Relisted — Beaches MLS
- 2025-01-02 Listing Removed — Beaches MLS
- 2024-12-16 Price Changed $144,900 Beaches MLS
- 2024-11-18 Price Changed $145,000 Beaches MLS
- 2024-10-03 Price Changed $149,000 Beaches MLS
- 2024-08-18 Price Changed $154,900 Beaches MLS
- 2024-07-27 Listed $164,900 Beaches MLS
- 2013-09-22 Listing Removed — Beaches MLS
- 2013-09-22 Listing Removed — Beaches MLS
- 2005-11-15 Sold (Public Records) $75,100 Public Records
- 2004-03-09 Sold (Public Records) $67,907 Public Records
- 2002-09-18 Listed $59,900 Beaches MLS
- 2001-12-26 Sold (Public Records) $31,000 Public Records
- 2001-11-13 Sold (MLS) $31,000 Beaches MLS
- 2001-11-01 Listing Removed — Beaches MLS
- 2001-06-14 Listed $34,900 Beaches MLS
- 2000-12-11 Listing Removed — Beaches MLS
- 2000-12-11 Listed $39,900 Beaches MLS
- 2000-07-06 Listed $40,900 Beaches MLS
- 1994-07-20 Sold (Public Records) $28,000 Public Records
Property tax history
+6.6%/yrLatest (2025): $443 · +7.5% YoY. Source: county tax records.
Cash-flow waterfall
monthlySold comps — $/sqft
last 12 mo · ≤1 miLoading sold comps…