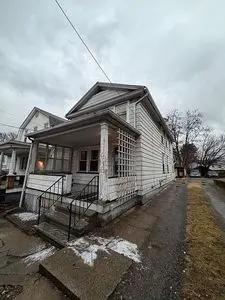
222 Blackman St · Wilkes-Barre, PA
Flood risk 1/10 · Minimal
- FEMA flood zone
- X (unshaded)
- Chance of flooding over 30 yrs
- 0.0%
- Est. flood insurance / yr
- $507 – $1,088
Fire risk 3/10 · Minor
- Est. fire insurance / yr
- $511 – $949
Heat risk 4/10 · Minor
- Hot days now (above 94°F)
- 7 days/yr
- Hot days in 30 yrs
- 16 days/yr
Wind risk 3/10 · Minor
- Chance of severe wind over 30 yrs
- 5.0%
Air-quality risk 2/10 · Minimal
- Unhealthy air days now
- 1 days/yr
- Unhealthy air days in 30 yrs
- 2 days/yr
Risk factors via First Street. Map © Google.
Why this score? — see what drove the C+ grade
The composite is a weighted blend of 9 inputs, each scored 0–100. Each bar is that input's sub-score; the figure is the points it added to the 100-point composite (weight × sub-score).
- Cash flow +26.3/30.0
- ARV discount +10.9/15.0
- DSCR +8.9/10.0
- 1% rule +7.0/10.0
- Rent growth +4.2/5.0
- Livability +2.5/5.0
- Condition / age +2.5/5.0
- Schools +2.1/10.0
- Appreciation +0.0/10.0
$115,420
🖨 Deal sheet 📄 Offer letter ✓ Due diligence
Listing remarks
Welcome to 222 Blackman St, Wilkes-Barre, PA & acirc; & euro; & rdquo; a well-maintained 3-bedroom, 1-bath home offering approximately 1,250 sq ft of comfortable living space. This move-in-ready property features off-street parking, a rear garage/shed for added storage, and newer mechanicals for added peace of mind. With a practical layout and solid condition, this home is a strong option for a buyer looking for value and convenience. Proof of funds or lender pre-approval is required before scheduling a showing. If interested, call Estephania at (570) 445-2041 or email [email protected]. Se vende por due & Atilde; & plusmn; o. Casa de 3 habitaciones, 2 ba & At
Neighborhood map
What this means for you Summary
Snapshot
- This is a 3-bed/2.0-bath single-family listed at $115k.
Deal economics
- At list price, monthly cash flow is $299 ($4k/yr) — positive.
- The deal already cash-flows at list — no discount required.
- Meets the 1% rule at list price ($1k rent vs $115k).
- Cap rate 9.4% vs local median 5.7% in Wilkes-Barre — top-decile yield for the area; either an underpriced asset or a hidden risk that comps aren't pricing in. Stress-test before assuming the spread holds.
Location & tenants
- Location reads: area grade C — affects rentability + tenant quality, not the cash-flow math above.
- Wilkes-Barre Area SD (urban): math 19% / reading 32% proficiency, ranked #469 of 539 in PA (top 87%) — low school quality limits family demand, transient renter base, plan for 1-2y turnover; 61% free/reduced lunch — lower-income household profile, screen leases tightly.
- Market conditions: Rents rising fast (+6.8%/yr); 221 active listings in the ZIP; 40 comparable units currently listed for rent nearby; rentals at typical pace (median 21d on market — plan ~3-4 weeks tenant-placement turnaround); 48% of comp listings sitting > 30 days — soft ceiling on asking rent; 349 units permitted in Luzerne County in 2024 (16 in 5+ unit buildings).
Forward outlook
- Local home prices are declining (-3.0%/yr); year-one equity from $798 of loan paydown is wiped out by about $3k of value loss. Plan a longer hold.
- Luzerne County population projected at +4% by 2050 — modest demand growth; plan on rents tracking national, not racing it.
- At projected returns (-3.0% appreciation + 6.8% rent growth), your $32k cash investment doubles in ~8 years — after that, you're playing with house money.
Negotiation context
- Only 0 days on market — expect competitive offers; lowballing is unlikely to land.
Risks & watch-outs
- Watch-outs: built in 1935 — expect roof / HVAC / electrical / plumbing capex.
Questions for the listing agent
- Built in 1935 — when were the roof, HVAC, electrical panel, plumbing, and water heater last replaced?
- Is there a deadline driving the sale (1031 exchange, divorce, estate, relocation)? That informs how much negotiation room exists.
- What's the average days-on-market for RENTAL listings here right now (not sales)? A rising rental-DOM trend means longer vacancies and softer asking-rent achievability than the comps imply.
- What's the recent tenant-quality profile in this submarket — average credit score on applications, eviction rate, late-payment / NSF rate, and stable-employment percentage? A property-management company in the area should have these aggregated.
- How much new for-sale + rental construction is in the pipeline within 1–3 miles? Heavy new supply typically softens prices + rents 12–24 months out; constrained supply supports both.
Investment metrics
- 1% rule
- 1.20% ✓
- Cap rate
- 9.40%
- Cash-on-cash
- 11.09%
- DSCR
- 1.49
- GRM
- 6.9
CMA / ARV
- ARV (on-the-fly)
- $124,800
- Comps found
- 12
Show comp detail 12 sales within ~0.75 mi
| Address | Dist | Beds/Ba | Sqft | Sold | Price | $/sf | Match |
|---|---|---|---|---|---|---|---|
| 127 Loomis St | 0.21mi | 2/2.0 (-1) | 1,245 (-0%) | 0mo | $124,000 | $100 | 84 |
| 287 Andover St | 0.24mi | 3/2.0 | 1,312 (+5%) | 2mo | $120,000 | $91 | 79 |
| 230 Poplar St | 0.16mi | 3/1.0 | 1,200 (-4%) | 5mo | $90,000 | $75 | 78 |
| 22 Bruce Ln | 0.15mi | 3/1.0 | 1,173 (-6%) | 1mo | $125,000 | $107 | 78 |
| 64 Prospect St | 0.35mi | 3/1.0 | 1,231 (-1%) | 1mo | $123,000 | $100 | 76 |
| 131 Stanton St | 0.28mi | 3/1.0 | 1,200 (-4%) | 0mo | $110,500 | $92 | 76 |
| 242 Poplar St | 0.16mi | 3/1.0 | 1,360 (+9%) | 5mo | $110,000 | $81 | 69 |
| 71 Prospect St | 0.33mi | 3/1.0 | 1,120 (-10%) | 0mo | $115,000 | $103 | 63 |
| 290 Hazle St | 0.45mi | 3/1.5 | 1,088 (-13%) | 0mo | $152,000 | $140 | 55 |
| 14 Green St | 0.71mi | 3/1.0 | 1,216 (-3%) | 4mo | $70,000 | $58 | 55 |
| 76 Mary St | 0.67mi | 3/1.0 | 1,152 (-8%) | 5mo | $160,000 | $139 | 48 |
| 85 Brown St | 0.74mi | 3/1.0 | 1,422 (+14%) | 4mo | $140,000 | $98 | 35 |
Match score weights: distance 35% · size 25% · config 20% · recency 20%. Top-matched comps best support the ARV.
Projected returns pro-forma
-3.0% appreciation · 6.84% rent growth · sell at horizon
- IRR
- 4.5%
- Equity multiple
- 1.18×
- Total profit
- $5,908
- Equity at exit
- $17,209
- IRR
- 17.3%
- Equity multiple
- 2.69×
- Total profit
- $54,456
- Equity at exit
- $9,979
Cash invested: $32,318 (down + closing). Projections, not guarantees.
Landlord ↔ Tenant lean methodology
- Overall (STATE)
- 62 Landlord-Friendly
- State Pennsylvania
- 62 Landlord-Friendly · EVEN
- County
- — inherits STATE
- City
- — inherits STATE
ZIP-level market 18702
- Rents YoY
- 6.8%
- Active inventory
- 221
- Price-to-rent
- 6.9×
Monthly cashflow live
- Estimated rent
- $1,388 high interval (Pro) →
- Mortgage (P&I)
- −$605
- Tax est. 1.5%
- −$144 /mo · $1,731/yr
- Insurance
- −$48
- HOA
- −$0
- Vacancy / Maint / Mgmt
- −$291
- Net cashflow
- $299
Break-even live
UW: 25.0% down · 7.5% · 30yr · 1.5% tax · 5.0% vac · 8.0% maint · 8.0% mgmt
Financing live
Cash to close
- Down payment
- $28,855
- Closing costs
- $3,463
- Reserves months
- —
- Total cash needed
- —
Loan-product check · same deal, 3 products live
Conventional
25% down · 7.5% · 30yr
- Down + closing
- —
- Monthly P&I
- —
- Monthly cashflow
- —
- DSCR
- —
- Eligible?
- —
Personal DTI + credit; lowest rate.
DSCR
20% down · 8.5% · 30yr
- Down + closing
- —
- Monthly P&I
- —
- Monthly cashflow
- —
- DSCR
- —
- Eligible?
- —
No personal income docs; deal must DSCR.
Hard money
10% down · 12.0% · 12mo
- Down + closing
- —
- Monthly P&I
- —
- Monthly cashflow
- —
- DSCR
- —
- Eligible?
- —
Short-term bridge; refi at stabilization.
Rent comps 40 comps
| Address | Beds | Baths | Sqft | Rent | $/sqft | DOM | Units | Dist |
|---|---|---|---|---|---|---|---|---|
| 239 Poplar St Wilkes Barre, PA | 3.0 | 1.5 | 1100 | $1,350 | $1.23 | 43d | 1 | 0.20mi |
| 26 Bradford St Wilkes Barre, PA | 3.0 | 1.5 | 1056 | $1,400 | $1.33 | 13d | 1 | 0.25mi |
| 32 Murray St Unit 34 Wilkes-Barre, PA | 3.0 | 1.0 | 930 | $1,100 | $1.18 | 21d | 1 | 0.41mi |
| 233 Gilligan St Wilkes Barre, PA | 3.0 | 1.0 | 1440 | $1,600 | $1.11 | 21d | 1 | 0.41mi |
| 407 McLean St Wilkes Barre, PA | 3.0 | 1.0 | 1482 | $1,400 | $0.94 | 13d | 1 | 0.43mi |
| 100-102 Westminster St Wilkes-Barre, PA | 2.0 | 1.0 | 1100 | $1,150 | $1.05 | 13d | 1 | 0.53mi |
| 100-102 Westminster St Wilkes-Barre, PA | 2.0 | 1.0 | 1200 | $1,150 | $0.96 | 21d | 1 | 0.53mi |
| 100 Westminster St Wilkes Barre, PA | 4.0 | 1.0 | 1150 | $1,400 | $1.22 | 13d | 1 | 0.54mi |
| 75 Wood St Wilkes Barre, PA | 2.0 | 1.0 | 990 | $1,300 | $1.31 | 43d | 1 | 0.56mi |
| 132 Sambourne St Wilkes Barre, PA | 2.0 | 1.0 | 1000 | $1,250 | $1.25 | 21d | 1 | 0.56mi |
| 62 Hutson St Wilkes Barre, PA | 2.0 | 1.0 | 1100 | $1,150 | $1.05 | 43d | 1 | 0.60mi |
| 62 Hutson St Unit 1 Wilkes-Barre, PA | 2.0 | 1.0 | 730 | $1,250 | $1.71 | 13d | 1 | 0.60mi |
| 34 Barney St Fl Right Wilkes-Barre, PA | 2.0 | 1.0 | 1000 | $1,195 | $1.20 | 43d | 1 | 0.66mi |
| 156 Hanover St Wilkes Barre, PA | 3.0 | 1.0 | 850 | $1,300 | $1.53 | 13d | 1 | 0.67mi |
| 284 Barney St Wilkes Barre, PA | 3.0 | 1.0 | 1070 | $1,600 | $1.50 | 44d | 1 | 0.71mi |
| 134 Nicholson St Wilkes Barre, PA | 4.0 | 1.0 | 1200 | $1,600 | $1.33 | 21d | 1 | 0.74mi |
| 134 Nicholson St Unit 3 Wilkes-Barre Township, PA | 4.0 | 1.0 | 1200 | $1,500 | $1.25 | 13d | 1 | 0.74mi |
| 403 S Franklin St Wilkes Barre, PA | 2.0 | 1.0 | 900 | $1,050 | $1.17 | 21d | 1 | 0.75mi |
| 780 Hazle St Unit Rear 2nd Fl Ashley, PA | 2.0 | 1.0 | 850 | $975 | $1.15 | 13d | 1 | 0.75mi |
| 68 Circle Dr Hanover Township, PA | 3.0 | 1.5 | 950 | $1,800 | $1.89 | 13d | 1 | 0.76mi |
| 44 Eagle Ct Wilkes Barre, PA | 1.0–3.0 | 1.0–1.5 | 910 | $1,999 | $2.20 | 13d | 5 | 0.81mi |
| 100 E Newport St Hanover Township, PA | 2.0 | 1.5 | 1344 | $1,250 | $0.93 | 43d | 1 | 0.81mi |
| 216 Horton St Wilkes Barre, PA | 3.0 | 1.5 | 1475 | $1,575 | $1.07 | 43d | 1 | 0.83mi |
| 129 Carlisle St Wilkes Barre, PA | 2.0 | 1.0 | 1005 | $1,200 | $1.19 | 13d | 1 | 0.84mi |
| 131 Academy St Wilkes Barre, PA | 3.0 | 1.0 | 1300 | $1,500 | $1.15 | 43d | 1 | 0.84mi |
| 99 N Main St Ashley, PA | 3.0 | 1.0 | 700 | $1,095 | $1.56 | 43d | 1 | 0.91mi |
| 155 W River St Wilkes Barre, PA | 3.0 | 2.0 | 1100 | $1,425 | $1.30 | 43d | 1 | 0.92mi |
| 13 Woodbury St Hanover Township, PA | 2.0 | 1.0 | 1000 | $1,100 | $1.10 | 43d | 1 | 0.94mi |
| 75 Oxford St Hanover Township, PA | 2.0 | 1.0 | 900 | $950 | $1.06 | 13d | 1 | 0.98mi |
| 26 Stanley St Wilkes Barre, PA | 2.0 | 1.0 | 950 | $1,650 | $1.74 | 43d | 1 | 0.99mi |
| 1321 S Main St Hanover Township, PA | 2.0 | 1.0 | 800 | $1,095 | $1.37 | 43d | 1 | 1.02mi |
| 27 Oak St Wilkes Barre, PA | 3.0 | 1.5 | 1500 | $1,700 | $1.13 | 43d | 1 | 1.05mi |
| 159 New Mallery Pl Unit 2 Wilkes-Barre, PA | 2.0 | 1.0 | 1020 | $950 | $0.93 | 43d | 1 | 1.07mi |
| 342 Horton St Wilkes Barre, PA | 3.0 | 1.5 | 1472 | $1,650 | $1.12 | 13d | 1 | 1.07mi |
| 224 New Mallery Pl Wilkes Barre, PA | 2.0 | 1.0 | 850 | $1,000 | $1.18 | 13d | 1 | 1.10mi |
| 75 Melrose Ave Apt 2 Wilkes-Barre, PA | 2.0 | 1.0 | 1150 | $1,250 | $1.09 | 43d | 1 | 1.11mi |
| 150 S Franklin St Wilkes Barre, PA | 2.0 | 1.0 | 850 | $1,750 | $2.06 | 43d | 1 | 1.14mi |
| 86 Maffett St Wilkes-Barre, PA | 2.0 | 1.0 | 1032 | $1,300 | $1.26 | 43d | 1 | 1.17mi |
| 51 S Welles St Wilkes Barre, PA | 4.0 | 1.0 | 1344 | $1,600 | $1.19 | 43d | 1 | 1.23mi |
| 109 Barnes St Unit C Ashley, PA | 2.0 | 1.0 | 925 | $1,045 | $1.13 | 21d | 1 | 1.27mi |
Listing history 2 events
-
2026-06-10remarks 675-char remark
-
2026-06-10$115,420 Under Contract
ⓘ Source: listings_history table (triggers on properties + properties_extension) + one-shot
backfill from property_details.listing_events for pre-trigger history.
Climate risk First Street
- Flood 1/10 Low FEMA zone X (unshaded) · 0% chance over 30 yrs
- Wildfire 3/10 Moderate
- Heat 4/10 Moderate 7 d/yr ≥94°F today · 16 d/yr by 30 yrs out
- Wind 3/10 Moderate 5% chance of damaging wind over 30 yrs
- Air quality 2/10 Low 1 unhealthy d/yr today · 2 by 30 yrs out
Nearby sold comps map
Loading sold comps map…
Walkable amenities ~0.75 mi
Loading nearby amenities…
Taxation est. · year 1
- Rental income
- $16,653
- − Mortgage interest
- −$6,465
- − Property taxes
- −$1,731
- − Insurance
- −$577
- − Repairs & maintenance
- −$1,332
- − Management
- −$1,332
- − Depreciation
- −$3,358
- Taxable income
- $1,857
- Est. tax owed @ 24.0%
- −$446
- After-tax cash flow
- $3,138/yr
For passive investors: Depreciation is non-cash, so a rental often shows a tax loss while cash-flowing — sheltering income. Rental losses are passive: they offset passive income freely, and up to $25,000/yr can offset ordinary (W-2) income if you actively participate and your MAGI is under $100k (phasing out to $0 by $150k); unused losses carry forward. On sale, claimed depreciation is recaptured at up to 25%, and gains may owe capital-gains tax (a 1031 exchange can defer both). Figures are a year-1 estimate at your 24.0% rate — not tax advice; consult a CPA.
Schools (NCES district)
- District
- Wilkes-Barre Area SD
- NCES district ID
- 4226300
- Math proficiency
- 19% ▼ -2.00%
- Reading proficiency
- 32% ▼ -9.00%
- Median HH income
- $37,420
- Composite
- 21.22/100
- National rank
- #8409
- State rank
- #469 of 539 in PA
Livability — Wilkes-Barre
No livability data for this city. (Only ~50 U.S. cities are tracked.)
Census & demographics
- Census place
- Wilkes-Barre, PA
- County
- Luzerne County · 118,885 people
- City population
- 73,981
- Metro
- Scranton--Wilkes-Barre, PA
- Population (ZIP)
- 41,970
- Household income
- $56,378
- Rent vs Own
- Severe rent burden
- 1632.0
Population outlook (Luzerne County) Hauer SSP2
- Today (2025)
- 319,505 people
- By 2030
- 319,943 · +0.1%
- By 2040
- 322,643 · +1.0%
- By 2050
- 330,817 · +3.5%
- By 2075
- 379,145 · +18.7%
- By 2100
- 431,908 · +35.2%
Race, ethnicity, and origin ACS 2023
- Neighborhood character
- Diverse neighborhood (Simpson 0.59)
- Race & ethnicity
- White 58% Hispanic / Latino 25% Black 12% Two or more races 11% Asian 2%
- Hispanic origin (detail)
- Mexican 6% Puerto Rican 6% Dominican 9%
- Common ancestry
- Romanian 14% Scotch-Irish 2% Iranian 1%
- Foreign-born
- 13% · Canada, Jamaica
- Languages at home
- 79% English-only · Spanish 17% Other Asian/Pacific 1% Other Indo-European 1%
Political lean MEDSL · Luzerne
- 2024 margin
- R (+19.2) · D 40.0% · R 59.2%
- 2008→2024 swing
- -27.6pp toward R · 2008: 8.4pp · 2024: -19.2pp
- All cycles
- 2024: R+19.2 2020: R+14.4 2016: R+19.6 2012: D+4.8 2008: D+8.4
Not yet ingested
- Civics
- —
Market trends
- HPI YoY
- ▼ -156.99%
- Current HPI
- 216.9373
- Rent YoY
- ▲ 6.84%
- Metro
- Scranton--Wilkes-Barre, PA
- State GDP YoY
- ▲ 1.68%
- F500 in state
- 34
Industry mix (Fortune 500 HQ in PA)
| Industry | F500 HQs | Revenue |
|---|---|---|
| Healthcare | 2 | $309B |
|
||
| Insurance | 2 | $27B |
|
||
| Telecommunications / Media | 1 | $124B |
|
||
| Industrial Distribution | 1 | $22B |
|
||
| Financial Services | 1 | $20B |
|
||
| Chemicals / Materials | 1 | $18B |
|
||
Price history
1 event — show timeline
- 2026-06-10 Listed $115,420 FSBO.com
Property tax history
+20.4%/yrLatest (2026): $10,173 · +0.1% YoY. Source: county tax records.
Cash-flow waterfall
monthlySold comps — $/sqft
last 12 mo · ≤1 miLoading sold comps…