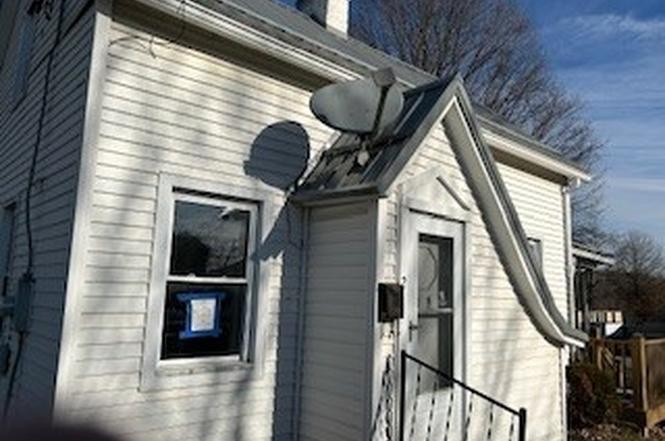
2 Arlington Ave · Masontown, PA
Flood risk 1/10 · Minimal
- FEMA flood zone
- X (unshaded)
- Chance of flooding over 30 yrs
- 0.0%
- Est. flood insurance / yr
- $473 – $860
Fire risk 1/10 · Minimal
- Est. fire insurance / yr
- $511 – $949
Heat risk 4/10 · Minor
- Hot days now (above 98°F)
- 7 days/yr
- Hot days in 30 yrs
- 19 days/yr
Wind risk 2/10 · Minimal
- Chance of severe wind over 30 yrs
- —
Air-quality risk 2/10 · Minimal
- Unhealthy air days now
- 1 days/yr
- Unhealthy air days in 30 yrs
- 2 days/yr
Risk factors via First Street. Map © Google.
Why this score? — see what drove the B grade
The composite is a weighted blend of 9 inputs, each scored 0–100. Each bar is that input's sub-score; the figure is the points it added to the 100-point composite (weight × sub-score).
- Cash flow +30.0/30.0
- 1% rule +10.0/10.0
- DSCR +10.0/10.0
- ARV discount +6.9/15.0
- Appreciation +5.8/10.0
- Livability +3.2/5.0
- Schools +3.0/10.0
- Rent growth +2.5/5.0
- Condition / age +2.5/5.0
$35,000
🖨 Deal sheet (PDF) 📄 Offer letter ✓ Due diligence
Listing remarks MLS
Home is located in town area within walking distance to shopping areas
Key facts
- Updated metal roof
- 3,837 sq ft lot
- Parking
Tags
Neighborhood map
What this means for you Summary
Snapshot
- This is a 2-bed/1.0-bath single-family listed at $35k.
Deal economics
- At list price, monthly cash flow is $442 ($5k/yr) — positive.
- The deal already cash-flows at list — no discount required.
- Meets the 1% rule at list price ($898 rent vs $35k).
- Recommended offer: $34k (1.5% below list) — sets the bar for market timing.
Location & tenants
- Location reads 65/100 on livability (#1,115 in PA) — a middle-class / working-renter tenant base. Strengths: cost of living A+, housing A+; Watch: amenities F, commute F, employment D-.
- Albert Gallatin Area SD (rural): math 26% / reading 46% proficiency, ranked #419 of 539 in PA (top 78%) — families likely to look elsewhere, expect single-tenant / working-renter base with shorter leases.
- Zoned schools: Masontown El Sch (math 22% / reading 42%, grade F, #1,094 of 1,518 statewide, top 73%, 249 students, 100% FRL); Albert Gallatin South Ms (math 16% / reading 42%, grade F, #391 of 512 statewide, top 77%, 360 students, 100% FRL); Albert Gallatin Area Shs (math 48% / reading 50%, grade D, #151 of 437 statewide, top 35%, 964 students, 76% FRL) — zoned schools average 92% FRL vs 56% district-wide (36 pts higher); higher-poverty schools than district average — tighter screening recommended.
- Market conditions: 19 active listings in the ZIP; 201 units permitted in Fayette County in 2024 (10 in 5+ unit buildings).
Forward outlook
- In year one you build about $824 of equity ($242 loan paydown + $582 appreciation (1.7% local appreciation)).
- Fayette County population projected at -19% by 2050 — secular population decline; favor cash flow + early exit over multi-decade hold.
- At projected returns (1.7% appreciation + 3.0% rent growth), your $10k cash investment doubles in ~2 years — after that, you're playing with house money.
Negotiation context
- It's been on market 26 days — a 2% lower offer ($34k) is reasonable based on typical stale-listing flexibility.
- 3 sale attempts; this cycle's ask has dropped $5k (12%) from the opening price — seller is motivated, your offer sets the floor, not the list.
Risks & watch-outs
- Watch-outs: built in 1910 — expect roof / HVAC / electrical / plumbing capex.
Questions for the listing agent
- Built in 1910 — when were the roof, HVAC, electrical panel, plumbing, and water heater last replaced?
- Is there a deadline driving the sale (1031 exchange, divorce, estate, relocation)? That informs how much negotiation room exists.
- What's the average days-on-market for RENTAL listings here right now (not sales)? A rising rental-DOM trend means longer vacancies and softer asking-rent achievability than the comps imply.
- What's the recent tenant-quality profile in this submarket — average credit score on applications, eviction rate, late-payment / NSF rate, and stable-employment percentage? A property-management company in the area should have these aggregated.
- How much new for-sale + rental construction is in the pipeline within 1–3 miles? Heavy new supply typically softens prices + rents 12–24 months out; constrained supply supports both.
Investment metrics
- 1% rule
- 2.57% ✓
- Cap rate
- 21.43%
- Cash-on-cash
- 54.08%
- DSCR
- 3.41
- GRM
- 3.2
CMA / ARV
- ARV (on-the-fly)
- $34,560
- Comps found
- 1
Show comp detail 1 sale within ~0.75 mi
| Address | Dist | Beds/Ba | Sqft | Sold | Price | $/sf | Match |
|---|---|---|---|---|---|---|---|
| 11 Gilmore Ave | 0.23mi | 2/1.5 | 744 (+3%) | 7mo | $36,001 | $48 | 76 |
Match score weights: distance 35% · size 25% · config 20% · recency 20%. Top-matched comps best support the ARV.
Projected returns pro-forma
1.66% appreciation · 3.0% rent growth · sell at horizon
- IRR
- 57.6%
- Equity multiple
- 4.06×
- Total profit
- $29,960
- Equity at exit
- $13,171
- IRR
- 58.4%
- Equity multiple
- 8.19×
- Total profit
- $70,453
- Equity at exit
- $18,490
Cash invested: $9,800 (down + closing). Projections, not guarantees.
Landlord ↔ Tenant lean methodology
- Overall (STATE)
- 62 Landlord-Friendly
- State Pennsylvania
- 62 Landlord-Friendly · EVEN
- County
- — inherits STATE
- City
- — inherits STATE
ZIP-level market 15461
- Home prices YoY
- 0.8%
- Active inventory
- 19
- Price-to-rent
- 3.2×
Monthly cashflow live
- Estimated rent
- $898 medium interval (Pro) →
- Mortgage (P&I)
- −$184
- Tax from tax record
- −$70 /mo · $836/yr
- Insurance
- −$15
- HOA
- −$0
- Vacancy / Maint / Mgmt
- −$189
- Net cashflow
- $442
Break-even live
Sensitivity live
| Price | -10% $461 | -5% $452 | +0% $442 | +5% $432 | +10% $422 |
|---|---|---|---|---|---|
| Rent | -10% $371 | -5% $406 | +0% $442 | +5% $477 | +10% $513 |
| Rate | -1.0pp $459 | -0.5pp $451 | base $442 | +0.5pp $433 | +1.0pp $423 |
UW: 25.0% down · 7.5% · 30yr · 1.5% tax · 5.0% vac · 8.0% maint · 8.0% mgmt
Financing live
Cash to close
- Down payment
- $8,750
- Closing costs
- $1,050
- Reserves months
- —
- Total cash needed
- —
Loan-product check · same deal, 3 products live
Conventional
25% down · 7.5% · 30yr
- Down + closing
- —
- Monthly P&I
- —
- Monthly cashflow
- —
- DSCR
- —
- Eligible?
- —
Personal DTI + credit; lowest rate.
DSCR
20% down · 8.5% · 30yr
- Down + closing
- —
- Monthly P&I
- —
- Monthly cashflow
- —
- DSCR
- —
- Eligible?
- —
No personal income docs; deal must DSCR.
Hard money
10% down · 12.0% · 12mo
- Down + closing
- —
- Monthly P&I
- —
- Monthly cashflow
- —
- DSCR
- —
- Eligible?
- —
Short-term bridge; refi at stabilization.
Listing history 11 events
-
2026-03-12status Pending
-
2026-03-01price $35,000
-
2026-02-23status Active
-
2026-01-29status Pending
-
2026-01-21$40,000 Active
-
2026-01-06historical Expired 70-char remark
Show marketing remark (70 chars)
Home is located in town area within walking distance to shopping areas
-
2025-12-19price $45,000 70-char remark
Show marketing remark (70 chars)
Home is located in town area within walking distance to shopping areas
-
2025-11-17price $50,000 70-char remark
Show marketing remark (70 chars)
Home is located in town area within walking distance to shopping areas
-
2025-10-17price $55,000 70-char remark
Show marketing remark (70 chars)
Home is located in town area within walking distance to shopping areas
-
2025-09-12$60,000 Active 70-char remark
Show marketing remark (70 chars)
Home is located in town area within walking distance to shopping areas
-
2003-07-17soldstatus $39,000
ⓘ Source: listings_history table (triggers on properties + properties_extension) + one-shot
backfill from property_details.listing_events for pre-trigger history.
Tax reassessment forecast PA · Partial reset (capped growth)
- Current annual tax
- $836 · $70/mo
- Projected year-2 tax
- $836 · $70/mo
- Expected delta
- $0/yr ($0/mo · 0.0%)
ⓘ Screening estimate from a state-policy table — verify with the county assessor before closing.
Climate risk First Street
- Flood 1/10 Low FEMA zone X (unshaded) · 0% chance over 30 yrs
- Wildfire 1/10 Low
- Heat 4/10 Moderate 7 d/yr ≥98°F today · 19 d/yr by 30 yrs out
- Wind 2/10 Low
- Air quality 2/10 Low 1 unhealthy d/yr today · 2 by 30 yrs out
Nearby sold comps map
Loading sold comps map…
Walkable amenities ~0.75 mi
Loading nearby amenities…
Taxation est. · year 1
- Rental income
- $10,775
- − Mortgage interest
- −$1,961
- − Property taxes
- −$836
- − Insurance
- −$175
- − Repairs & maintenance
- −$862
- − Management
- −$862
- − Depreciation
- −$1,018
- Taxable income
- $5,062
- Est. tax owed @ 24.0%
- −$1,215
- After-tax cash flow
- $4,085/yr
For passive investors: Depreciation is non-cash, so a rental often shows a tax loss while cash-flowing — sheltering income. Rental losses are passive: they offset passive income freely, and up to $25,000/yr can offset ordinary (W-2) income if you actively participate and your MAGI is under $100k (phasing out to $0 by $150k); unused losses carry forward. On sale, claimed depreciation is recaptured at up to 25%, and gains may owe capital-gains tax (a 1031 exchange can defer both). Figures are a year-1 estimate at your 24.0% rate — not tax advice; consult a CPA.
Schools (NCES district)
- District
- Albert Gallatin Area SD
- NCES district ID
- 4202100
- Math proficiency
- 26% ▼ -15.00%
- Reading proficiency
- 46% ▼ -7.00%
- Median HH income
- $36,456
- Composite
- 29.8/100
- National rank
- #6422
- State rank
- #419 of 539 in PA
Livability — Masontown
- Score
- 65/100
- State rank
- #1115
- US rank
- #12702
Category grades
Schools grade is shown separately in the Schools card above.
Census & demographics
- Census place
- Masontown, PA
- Population (ZIP)
- 3,624
Population outlook (Fayette County) Hauer SSP2
- Today (2025)
- 127,561 people
- By 2030
- 123,206 · -3.4%
- By 2040
- 113,232 · -11.2%
- By 2050
- 103,468 · -18.9%
- By 2075
- 83,185 · -34.8%
- By 2100
- 62,384 · -51.1%
Race, ethnicity, and origin ACS 2023
- Neighborhood character
- Predominantly White (86%)
- Race & ethnicity
- White 86% Black 11% Two or more races 3% Hispanic / Latino 1%
- Common ancestry
- Italian 9% Romanian 7% Slovak 5%
- Foreign-born
- 1% · South Korea
- Languages at home
- 98% English-only · Spanish 2% Chinese 1%
Political lean MEDSL · Fayette
- 2024 margin
- Solid R (+37.9) · D 30.8% · R 68.7%
- 2008→2024 swing
- -37.5pp toward R · 2008: -0.4pp · 2024: -37.9pp
- All cycles
- 2024: R+37.9 2020: R+33.5 2016: R+31.0 2012: R+8.3 2008: R+0.4
Not yet ingested
- Civics
- —
Market trends
- HPI YoY
- ▲ 1.66%
- Current HPI
- 207.2041
- Rent YoY
- —
- Metro
- —
- State GDP YoY
- ▲ 1.68%
- F500 in state
- 34
Industry mix (Fortune 500 HQ in PA)
| Industry | F500 HQs | Revenue |
|---|---|---|
| Healthcare | 2 | $309B |
|
||
| Insurance | 2 | $27B |
|
||
| Telecommunications / Media | 1 | $124B |
|
||
| Industrial Distribution | 1 | $22B |
|
||
| Financial Services | 1 | $20B |
|
||
| Chemicals / Materials | 1 | $18B |
|
||
Price history
-10.3% since first listed11 events — show timeline
- 2026-03-12 Pending — West Penn MLS
- 2026-03-01 Price Changed $35,000 West Penn MLS
- 2026-02-23 Relisted — West Penn MLS
- 2026-01-29 Pending — West Penn MLS
- 2026-01-21 Listed $40,000 West Penn MLS
- 2026-01-06 Delisted — West Penn MLS
- 2025-12-19 Price Changed $45,000 West Penn MLS
- 2025-11-17 Price Changed $50,000 West Penn MLS
- 2025-10-17 Price Changed $55,000 West Penn MLS
- 2025-09-12 Listed $60,000 West Penn MLS
- 2003-07-17 Sold (Public Records) $39,000 Public Records
Property tax history
+5.5%/yrLatest (2026): $836 · +0.0% YoY. Source: county tax records.
Cash-flow waterfall
monthlySold comps — $/sqft
last 12 mo · ≤1 miLoading sold comps…