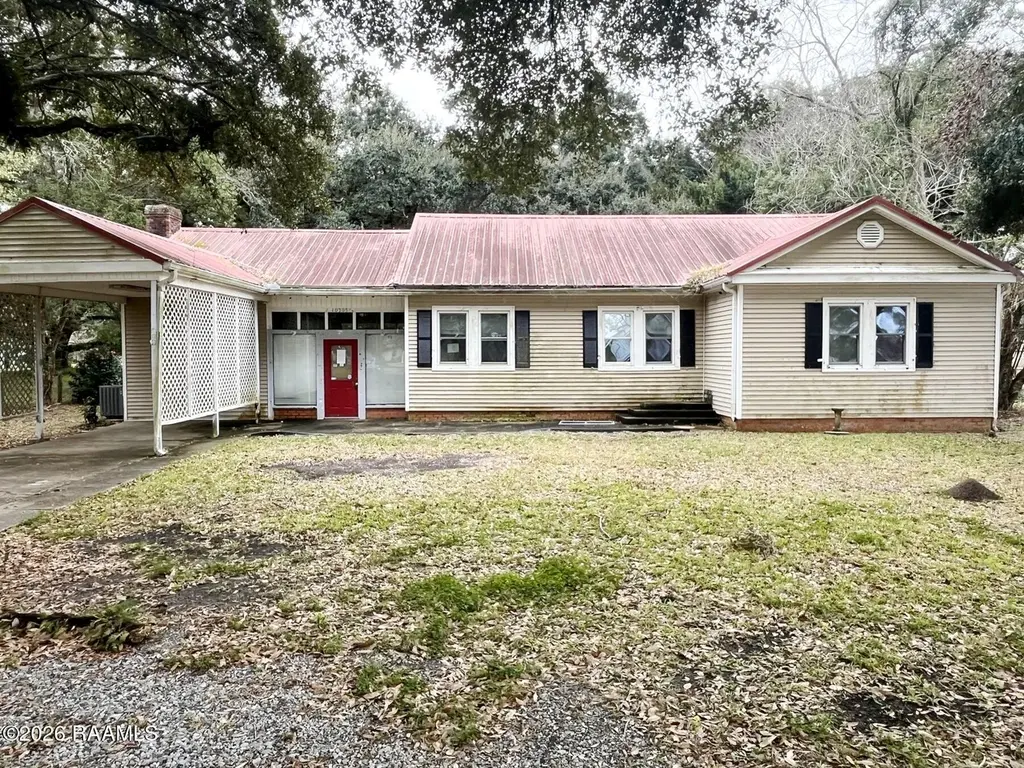
10305 Highway 182 · Franklin, LA
Flood risk 5/10 · Moderate
- FEMA flood zone
- X (shaded)
- Chance of flooding over 30 yrs
- 0.14%
- Est. flood insurance / yr
- $507 – $1,088
Fire risk 1/10 · Minimal
- Est. fire insurance / yr
- $1,269 – $2,357
Heat risk 9/10 · Severe
- Hot days now (above 105°F)
- 7 days/yr
- Hot days in 30 yrs
- 23 days/yr
Wind risk 9/10 · Severe
- Chance of severe wind over 30 yrs
- 99.0%
Air-quality risk 1/10 · Minimal
- Unhealthy air days now
- 0 days/yr
- Unhealthy air days in 30 yrs
- 0 days/yr
Risk factors via First Street. Map © Google.
Why this score? — see what drove the B grade
The composite is a weighted blend of 9 inputs, each scored 0–100. Each bar is that input's sub-score; the figure is the points it added to the 100-point composite (weight × sub-score).
- Cash flow +30.0/30.0
- 1% rule +10.0/10.0
- DSCR +10.0/10.0
- ARV discount +7.5/15.0
- Appreciation +6.3/10.0
- Livability +3.4/5.0
- Schools +2.8/10.0
- Rent growth +2.5/5.0
- Condition / age +2.5/5.0
$70,000
🖨 Deal sheet 📄 Offer letter ✓ Due diligence
Listing remarks MLS
Spacious single-family home offering approximately 2,112 sq ft of living area, featuring a covered front porch, carport, and a functional floor plan. The property is located along Highway 182 with convenient access to local services, schools, and amenities in Franklin. Interior and exterior repairs are needed, and the home is being offered in its current condition, providing an opportunity for renovation or value enhancement. 'Due to condition, the property may have health/safety risk(s). Prior to entry / access, all parties must sign a Hold Harmless Agreement and the property may only be shown by appointment'
Key facts
- Covered front porch
- Convenient access
- Carport
Tags
Neighborhood map
What this means for you Summary
Snapshot
- This is a 4-bed/2.0-bath single-family listed at $70k.
Deal economics
- At list price, monthly cash flow is $586 ($7k/yr) — positive.
- The deal already cash-flows at list — no discount required.
- Meets the 1% rule at list price ($1k rent vs $70k).
- Recommended offer: $62k (12.0% below list) — sets the bar for market timing.
- Cap rate 16.3% vs local median 6.2% in Franklin — top-decile yield for the area; either an underpriced asset or a hidden risk that comps aren't pricing in. Stress-test before assuming the spread holds.
Location & tenants
- Location reads 67/100 on livability (#107 in LA) — a middle-class / working-renter tenant base. Strengths: cost of living A+, housing A+, health & safety B+; Watch: crime F, amenities F, commute F.
- St. Mary Parish (town): math 28% / reading 39% proficiency, ranked #37 of 98 in LA (top 38%) — families likely to look elsewhere, expect single-tenant / working-renter base with shorter leases; 68% free/reduced lunch — lower-income household profile, screen leases tightly.
- Market conditions: 92 active listings in the ZIP; 37 units permitted in St. Mary Parish in 2024 (20 in 5+ unit buildings).
Forward outlook
- In year one you build about $2k of equity ($484 loan paydown + $2k appreciation (2.6% local appreciation)).
- St. Mary County population projected at -18% by 2050 — secular population decline; favor cash flow + early exit over multi-decade hold.
- At projected returns (2.6% appreciation + 3.0% rent growth), your $20k cash investment doubles in ~3 years — after that, you're playing with house money.
Negotiation context
- It's been on market 140 days — a 12% lower offer ($62k) is reasonable based on typical stale-listing flexibility.
- 3 sale attempts since 20y ago; this cycle's ask has dropped $45k (39%) from the opening price — seller is motivated, your offer sets the floor, not the list.
Risks & watch-outs
- Watch-outs: property tax is 2.9% of price.
- Climate carrying-cost: moderate flood risk; severe wind risk, 99% chance of damaging wind over 30y; extreme-heat days projected 7→23/yr by 2055 (HVAC capex compounding) — expect insurance premiums to compound above CPI over the hold.
Questions for the listing agent
- It's been on market 140 days. Have you received any prior offers? Is the seller open to a 12% concession, seller financing, or rate buy-down credit?
- Property tax is high relative to price — has the assessment been appealed recently, and will the sale trigger a re-assessment?
- Why hasn't it sold? Are there any deal-killer items the seller is aware of (foundation, flood, title, zoning, code violations)?
- Is there a deadline driving the sale (1031 exchange, divorce, estate, relocation)? That informs how much negotiation room exists.
- Crime grade is F in this area — have there been break-ins, vandalism, or insurance claims at this property in the last 3 years? What carrier currently insures it and at what premium?
- What's the average days-on-market for RENTAL listings here right now (not sales)? A rising rental-DOM trend means longer vacancies and softer asking-rent achievability than the comps imply.
- What's the recent tenant-quality profile in this submarket — average credit score on applications, eviction rate, late-payment / NSF rate, and stable-employment percentage? A property-management company in the area should have these aggregated.
- How much new for-sale + rental construction is in the pipeline within 1–3 miles? Heavy new supply typically softens prices + rents 12–24 months out; constrained supply supports both.
Investment metrics
- 1% rule
- 2.08% ✓
- Cap rate
- 16.34%
- Cash-on-cash
- 35.88%
- DSCR
- 2.60
- GRM
- 4.0
CMA / ARV
- ARV (median comp)
- $280,482
- List price
- $70,000
- Delta
- -75.04%
- Verdict
- UNDERPRICED
- Comps
- 5 within 1.0 mi
Show comp detail 3 sales within ~0.75 mi
| Address | Dist | Beds/Ba | Sqft | Sold | Price | $/sf | Match |
|---|---|---|---|---|---|---|---|
| 10546 Hwy 182 | 0.34mi | 3/2.0 (-1) | 2,283 (-5%) | 17mo | $313,000 | $137 | 58 |
| 10653 Hwy 182 | 0.52mi | 4/2.0 | 2,471 (+3%) | 17mo | $315,000 | $127 | 56 |
| 10683 Hwy 182 | 0.60mi | 3/2.0 (-1) | 2,316 (-3%) | 18mo | $225,000 | $97 | 47 |
Match score weights: distance 35% · size 25% · config 20% · recency 20%. Top-matched comps best support the ARV.
Projected returns pro-forma
2.56% appreciation · 3.0% rent growth · sell at horizon
- IRR
- 40.8%
- Equity multiple
- 3.25×
- Total profit
- $44,197
- Equity at exit
- $29,738
- IRR
- 41.2%
- Equity multiple
- 6.47×
- Total profit
- $107,206
- Equity at exit
- $44,521
Cash invested: $19,600 (down + closing). Projections, not guarantees.
Landlord ↔ Tenant lean methodology
- Overall (STATE)
- 90 Strongly Landlord-Friendly
- State Louisiana
- 90 Strongly Landlord-Friendly · R+12
- County
- — inherits STATE
- City
- — inherits STATE
ZIP-level market 70538
- Home prices YoY
- 3.2%
- Active inventory
- 92
- Price-to-rent
- 4.0×
Monthly cashflow live
- Estimated rent
- $1,458 medium interval (Pro) →
- Mortgage (P&I)
- −$367
- Tax from tax record
- −$170 /mo · $2,038/yr
- Insurance
- −$29
- HOA
- −$0
- Vacancy / Maint / Mgmt
- −$306
- Net cashflow
- $586
Break-even live
UW: 25.0% down · 7.5% · 30yr · 1.5% tax · 5.0% vac · 8.0% maint · 8.0% mgmt
Financing live
Cash to close
- Down payment
- $17,500
- Closing costs
- $2,100
- Reserves months
- —
- Total cash needed
- —
Loan-product check · same deal, 3 products live
Conventional
25% down · 7.5% · 30yr
- Down + closing
- —
- Monthly P&I
- —
- Monthly cashflow
- —
- DSCR
- —
- Eligible?
- —
Personal DTI + credit; lowest rate.
DSCR
20% down · 8.5% · 30yr
- Down + closing
- —
- Monthly P&I
- —
- Monthly cashflow
- —
- DSCR
- —
- Eligible?
- —
No personal income docs; deal must DSCR.
Hard money
10% down · 12.0% · 12mo
- Down + closing
- —
- Monthly P&I
- —
- Monthly cashflow
- —
- DSCR
- —
- Eligible?
- —
Short-term bridge; refi at stabilization.
Listing history 26 events
-
2026-06-18days on market $70,000 Active 140 DOM
-
2026-06-17days on market $70,000 Active 139 DOM
-
2026-06-16days on market $70,000 Active 138 DOM
-
2026-06-15pricedays on market $70,000 Active 137 DOM
-
2026-06-13days on market $85,000 Active 135 DOM
-
2026-06-12days on market $85,000 Active 134 DOM
-
2026-06-09days on market $85,000 Active 131 DOM
-
2026-06-08days on market $85,000 Active 130 DOM
-
2026-06-07days on market $85,000 Active 129 DOM
-
2026-06-07days on market $85,000 Active 128 DOM
-
2026-06-04days on market $85,000 Active 125 DOM
-
2026-06-02days on market $85,000 Active 124 DOM
-
2026-06-01days on market $85,000 Active 123 DOM
-
2026-05-31days on market $85,000 Active 122 DOM
-
2026-05-31days on market $85,000 Active 121 DOM
-
2026-05-01price $85,000 617-char remark
Show marketing remark (617 chars)
Spacious single-family home offering approximately 2,112 sq ft of living area, featuring a covered front porch, carport, and a functional floor plan. The property is located along Highway 182 with convenient access to local services, schools, and amenities in Franklin. Interior and exterior repairs are needed, and the home is being offered in its current condition, providing an opportunity for renovation or value enhancement. 'Due to condition, the property may have health/safety risk(s). Prior to entry / access, all parties must sign a Hold Harmless Agreement and the property may only be shown by appointment'
-
2026-03-15price $95,000 617-char remark
Show marketing remark (617 chars)
Spacious single-family home offering approximately 2,112 sq ft of living area, featuring a covered front porch, carport, and a functional floor plan. The property is located along Highway 182 with convenient access to local services, schools, and amenities in Franklin. Interior and exterior repairs are needed, and the home is being offered in its current condition, providing an opportunity for renovation or value enhancement. 'Due to condition, the property may have health/safety risk(s). Prior to entry / access, all parties must sign a Hold Harmless Agreement and the property may only be shown by appointment'
-
2026-01-28$115,000 Active 617-char remark
Show marketing remark (617 chars)
Spacious single-family home offering approximately 2,112 sq ft of living area, featuring a covered front porch, carport, and a functional floor plan. The property is located along Highway 182 with convenient access to local services, schools, and amenities in Franklin. Interior and exterior repairs are needed, and the home is being offered in its current condition, providing an opportunity for renovation or value enhancement. 'Due to condition, the property may have health/safety risk(s). Prior to entry / access, all parties must sign a Hold Harmless Agreement and the property may only be shown by appointment'
-
2015-04-06soldstatus $172,000
-
2009-05-27soldstatus $130,584
-
2008-03-13$146,900
-
2006-10-27soldstatus $132,551
-
2006-10-27soldstatus $136,650
-
2006-09-05$145,000
-
2005-09-14soldstatus $110,000
-
2004-09-13soldstatus
ⓘ Source: listings_history table (triggers on properties + properties_extension) + one-shot
backfill from property_details.listing_events for pre-trigger history.
Tax reassessment forecast LA · Resets to sale price
- Current annual tax
- $2,038 · $170/mo
- Projected year-2 tax
- $2,038 · $170/mo
- Expected delta
- $0/yr ($0/mo · 0.0%)
ⓘ Screening estimate from a state-policy table — verify with the county assessor before closing.
Climate risk First Street
- Flood 5/10 Major FEMA zone X (shaded) · 14% chance over 30 yrs
- Wildfire 1/10 Low
- Heat 9/10 Extreme 7 d/yr ≥105°F today · 23 d/yr by 30 yrs out
- Wind 9/10 Extreme 99% chance of damaging wind over 30 yrs
- Air quality 1/10 Low 0 unhealthy d/yr today · 0 by 30 yrs out
Nearby sold comps map
Loading sold comps map…
Walkable amenities ~0.75 mi
Loading nearby amenities…
Taxation est. · year 1
- Rental income
- $17,501
- − Mortgage interest
- −$3,921
- − Property taxes
- −$2,038
- − Insurance
- −$350
- − Repairs & maintenance
- −$1,400
- − Management
- −$1,400
- − Depreciation
- −$2,036
- Taxable income
- $6,355
- Est. tax owed @ 24.0%
- −$1,525
- After-tax cash flow
- $5,507/yr
For passive investors: Depreciation is non-cash, so a rental often shows a tax loss while cash-flowing — sheltering income. Rental losses are passive: they offset passive income freely, and up to $25,000/yr can offset ordinary (W-2) income if you actively participate and your MAGI is under $100k (phasing out to $0 by $150k); unused losses carry forward. On sale, claimed depreciation is recaptured at up to 25%, and gains may owe capital-gains tax (a 1031 exchange can defer both). Figures are a year-1 estimate at your 24.0% rate — not tax advice; consult a CPA.
Schools (NCES district)
- District
- St. Mary Parish
- NCES district ID
- 2201620
- Math proficiency
- 28% ▼ -40.00%
- Reading proficiency
- 39% ▼ -33.00%
- Median HH income
- $39,843
- Composite
- 28.1/100
- National rank
- #6828
- State rank
- #37 of 98 in LA
Livability — Franklin
- Score
- 67/100
- State rank
- #107
- US rank
- #10368
Category grades
Schools grade is shown separately in the Schools card above.
Census & demographics
- Population (ZIP)
- 12,561
Population outlook (St. Mary County) Hauer SSP2
- Today (2025)
- 49,510 people
- By 2030
- 47,570 · -3.9%
- By 2040
- 43,880 · -11.4%
- By 2050
- 40,655 · -17.9%
- By 2075
- 37,190 · -24.9%
- By 2100
- 38,101 · -23.0%
Race, ethnicity, and origin ACS 2023
- Neighborhood character
- Diverse neighborhood (Simpson 0.60)
- Race & ethnicity
- White 48% Black 41% Two or more races 7% Hispanic / Latino 5% Native American 2%
- Hispanic origin (detail)
- Mexican 2%
- Common ancestry
- Lithuanian 8% Italian 1%
- Foreign-born
- 1% · Canada, Vietnam
- Languages at home
- 95% English-only · Spanish 4% French/Haitian/Cajun 1% Vietnamese 1%
Political lean MEDSL · St. Mary
- 2024 margin
- Solid R (+31.9) · D 33.5% · R 65.4% · Other 1.0%
- 2008→2024 swing
- -15.1pp toward R · 2008: -16.8pp · 2024: -31.9pp
- All cycles
- 2024: R+31.9 2020: R+29.1 2016: R+27.6 2012: R+18.8 2008: R+16.8
Not yet ingested
- Civics
- —
Market trends
- HPI YoY
- ▲ 2.56%
- Current HPI
- 82.9321
- Rent YoY
- —
- Metro
- —
- State GDP YoY
- ▲ 3.29%
- F500 in state
- 10
Industry mix (Fortune 500 HQ in LA)
| Industry | F500 HQs | Revenue |
|---|---|---|
| Telecommunications | 2 | $23B |
|
||
| Utilities | 1 | $12B |
|
||
| Wholesale / Distribution | 1 | $5B |
|
||
| Advertising | 1 | $2B |
|
||
Price history
-22.7% since first listed11 events — show timeline
- 2026-05-01 Price Changed $85,000 AcadianaMLS
- 2026-03-15 Price Changed $95,000 AcadianaMLS
- 2026-01-28 Listed $115,000 AcadianaMLS
- 2015-04-06 Sold (Public Records) $172,000 Public Records
- 2009-05-27 Sold (Public Records) $130,584 Public Records
- 2008-03-13 Listed $146,900 AcadianaMLS
- 2006-10-27 Sold (Public Records) $136,650 Public Records
- 2006-10-27 Sold (MLS) $132,551 AcadianaMLS
- 2006-09-05 Listed $145,000 AcadianaMLS
- 2005-09-14 Sold (Public Records) $110,000 Public Records
- 2004-09-13 Sold (Public Records) — Public Records
Property tax history
+3.5%/yrLatest (2025): $2,038 · +0.0% YoY. Source: county tax records.
Cash-flow waterfall
monthlySold comps — $/sqft
last 12 mo · ≤1 miLoading sold comps…