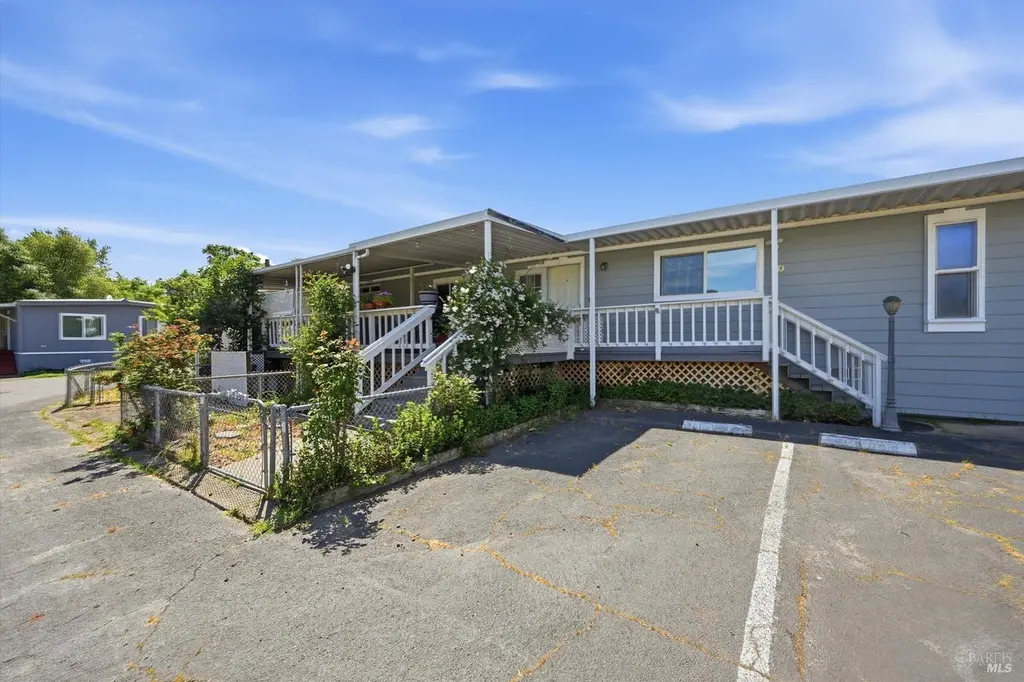
4801 N State St #10 · Calpella, CA
Flood risk 1/10 · Minimal
- FEMA flood zone
- X (unshaded)
- Chance of flooding over 30 yrs
- 0.0%
- Est. flood insurance / yr
- $507 – $1,088
Fire risk 8/10 · Major
- Est. fire insurance / yr
- $659 – $1,223
Heat risk 6/10 · Moderate
- Hot days now (above 100°F)
- 7 days/yr
- Hot days in 30 yrs
- 15 days/yr
Wind risk 1/10 · Minimal
- Chance of severe wind over 30 yrs
- —
Air-quality risk 10/10 · Severe
- Unhealthy air days now
- 24 days/yr
- Unhealthy air days in 30 yrs
- 25 days/yr
Risk factors via First Street. Map © Google.
Why this score? — see what drove the B grade
The composite is a weighted blend of 9 inputs, each scored 0–100. Each bar is that input's sub-score; the figure is the points it added to the 100-point composite (weight × sub-score).
- Cash flow +30.0/30.0
- 1% rule +10.0/10.0
- DSCR +10.0/10.0
- ARV discount +8.1/15.0
- Rent growth +4.0/5.0
- Schools +2.9/10.0
- Livability +2.5/5.0
- Condition / age +2.5/5.0
- Appreciation +0.0/10.0
$180,000
🖨 Deal sheet (PDF) 📄 Offer letter ✓ Due diligence
Listing remarks
This is a gorgeous home with a huge kitchen designed for cooking. 4 bedrooms, one of which is primary suite. Instant hot water heater. Corner location. Fully fenced yard ideal for small dogs. Deck across back of house and large patio with shed. Across from empty field and Russian River. Tons of cabinet space in kitchen. Gas tankless water heater and supplemental small water heaters under the sink in each bathroom for on-demand hot water at all times.
Key facts
- Deck across back
- Large patio
- Huge kitchen
Tags
Property features AI
Finance
- Financial info: Land lease amount $895; Future space rent $1,395
- HOA & community: No association; Not a senior community
Exterior
- Parking: 3 parking spaces; Guest parking available
- Utilities: Natural gas connected; Septic system
- Home design: Manufactured in-park double wide; Original condition
- Construction: Karston Villa manufactured home; Manufactured by The Andrew Karston Co Inc; Skirt: See remarks
- Exterior features: Located in North Valley Mobilehome Park; Land lease community
Interior
- Bedrooms: 4 bedrooms
- Bathrooms: 2 full bathrooms
- Heating & cooling: Central heating; Central air conditioning
- Interior features: Unfurnished; Low-flow showers; Shower stall(s)
- Laundry & utility: Washer hookups in interior laundry room; Dryer included
Neighborhood map
What this means for you Summary
Snapshot
- This is a 4-bed/2.0-bath manufactured listed at $180k.
Deal economics
- At list price, monthly cash flow is $1k ($12k/yr) — positive.
- The deal already cash-flows at list — no discount required.
- Meets the 1% rule at list price ($3k rent vs $180k).
- Recommended offer: $175k (3.0% below list) — sets the bar for market timing.
- Cap rate 13.0% vs local median 2.5% in Calpella — top-decile yield for the area; either an underpriced asset or a hidden risk that comps aren't pricing in. Stress-test before assuming the spread holds.
Location & tenants
- Location reads 49/100 on livability (#1,171 in CA) — a working-class tenant base; expect higher turnover. Strengths: employment A+; Watch: crime C-, health & safety D+, schools F.
- Ukiah Unified (town): math 24% / reading 37% proficiency, ranked #1,018 of 1,400 in CA (top 73%) — families likely to look elsewhere, expect single-tenant / working-renter base with shorter leases; 65% free/reduced lunch — lower-income household profile, screen leases tightly.
- Market conditions: Rents rising fast (+6.1%/yr); 153 active listings in the ZIP; 8 units permitted in Mendocino County in 2024 (0 in 5+ unit buildings).
- At $2,721/mo this rent would consume 47% of the median local household income ($70k/yr) (locally 1349% of renters already pay >50% of income on rent) — very limited rent-growth headroom before tenants either downsize or default.
Forward outlook
- Local home prices are declining (-3.0%/yr); year-one equity from $1k of loan paydown is wiped out by about $5k of value loss. Plan a longer hold.
- Mendocino County population projected at -15% by 2050 — secular population decline; favor cash flow + early exit over multi-decade hold.
- At projected returns (-3.0% appreciation + 6.1% rent growth), your $50k cash investment doubles in ~5 years — after that, you're playing with house money.
Negotiation context
- It's been on market 45 days — a 3% lower offer ($175k) is reasonable based on typical stale-listing flexibility.
- 2 sale attempts with the ask held roughly flat each time — persistent listings suggest the price (not the market) is what's stuck; bring a comps-based counter.
Risks & watch-outs
- Climate carrying-cost: severe wildfire risk; extreme-heat days projected 7→15/yr by 2055 (HVAC capex compounding) — expect insurance premiums to compound above CPI over the hold.
Questions for the listing agent
- It's been on market 45 days. Have you received any prior offers? Is the seller open to a 3% concession, seller financing, or rate buy-down credit?
- Is there a deadline driving the sale (1031 exchange, divorce, estate, relocation)? That informs how much negotiation room exists.
- Schools are F-rated, which usually means shorter tenancies and higher turnover. Who's the typical renter profile here, and what's been the actual vacancy rate?
- What's the average days-on-market for RENTAL listings here right now (not sales)? A rising rental-DOM trend means longer vacancies and softer asking-rent achievability than the comps imply.
- What's the recent tenant-quality profile in this submarket — average credit score on applications, eviction rate, late-payment / NSF rate, and stable-employment percentage? A property-management company in the area should have these aggregated.
- How much new for-sale + rental construction is in the pipeline within 1–3 miles? Heavy new supply typically softens prices + rents 12–24 months out; constrained supply supports both.
Investment metrics
- 1% rule
- 1.51% ✓
- Cap rate
- 13.02%
- Cash-on-cash
- 24.03%
- DSCR
- 2.07
- GRM
- 5.5
CMA / ARV
- ARV (median comp)
- $182,482
- List price
- $180,000
- Delta
- -1.36%
- Verdict
- FAIR
- Comps
- 3 within 1.0 mi
Projected returns pro-forma
-3.0% appreciation · 6.07% rent growth · sell at horizon
- IRR
- 20.5%
- Equity multiple
- 1.87×
- Total profit
- $43,744
- Equity at exit
- $26,839
- IRR
- 30.6%
- Equity multiple
- 4.15×
- Total profit
- $158,629
- Equity at exit
- $15,563
Cash invested: $50,400 (down + closing). Projections, not guarantees.
Landlord ↔ Tenant lean methodology
- Overall (STATE)
- 18 Strongly Tenant-Friendly
- State California
- 18 Strongly Tenant-Friendly · D+13
- County
- — inherits STATE
- City
- — inherits STATE
ZIP-level market 95482
- Rents YoY
- 6.1%
- Active inventory
- 153
- Price-to-rent
- 5.5×
Monthly cashflow live
- Estimated rent
- $2,721 medium interval (Pro) →
- Mortgage (P&I)
- −$944
- Tax from tax record
- −$122 /mo · $1,463/yr
- Insurance
- −$75
- HOA
- −$0
- Vacancy / Maint / Mgmt
- −$572
- Net cashflow
- $1,009
Break-even live
Sensitivity live
| Price | -10% $1,111 | -5% $1,060 | +0% $1,009 | +5% $958 | +10% $907 |
|---|---|---|---|---|---|
| Rent | -10% $794 | -5% $902 | +0% $1,009 | +5% $1,117 | +10% $1,224 |
| Rate | -1.0pp $1,100 | -0.5pp $1,055 | base $1,009 | +0.5pp $962 | +1.0pp $915 |
UW: 25.0% down · 7.5% · 30yr · 1.5% tax · 5.0% vac · 8.0% maint · 8.0% mgmt
Financing live
Cash to close
- Down payment
- $45,000
- Closing costs
- $5,400
- Reserves months
- —
- Total cash needed
- —
Loan-product check · same deal, 3 products live
Conventional
25% down · 7.5% · 30yr
- Down + closing
- —
- Monthly P&I
- —
- Monthly cashflow
- —
- DSCR
- —
- Eligible?
- —
Personal DTI + credit; lowest rate.
DSCR
20% down · 8.5% · 30yr
- Down + closing
- —
- Monthly P&I
- —
- Monthly cashflow
- —
- DSCR
- —
- Eligible?
- —
No personal income docs; deal must DSCR.
Hard money
10% down · 12.0% · 12mo
- Down + closing
- —
- Monthly P&I
- —
- Monthly cashflow
- —
- DSCR
- —
- Eligible?
- —
Short-term bridge; refi at stabilization.
Listing history 19 events
-
2026-06-19days on market $180,000 Active 45 DOM
-
2026-06-18days on market $180,000 Active 44 DOM
-
2026-06-17days on market $180,000 Active 43 DOM
-
2026-06-16days on market $180,000 Active 42 DOM
-
2026-06-15days on market $180,000 Active 41 DOM
-
2026-06-14days on market $180,000 Active 39 DOM
-
2026-06-12days on market $180,000 Active 38 DOM
-
2026-06-09days on market $180,000 Active 35 DOM
-
2026-06-08days on market $180,000 Active 34 DOM
-
2026-06-07days on market $180,000 Active 33 DOM
-
2026-06-05days on market $180,000 Active 30 DOM
-
2026-06-03days on market $180,000 Active 29 DOM
-
2026-06-02days on market $180,000 Active 28 DOM
-
2026-06-01days on market $180,000 Active 27 DOM
-
2026-05-31days on market $180,000 Active 26 DOM
-
2026-05-30days on market $180,000 Active 25 DOM
-
2026-05-13status Active 454-char remark
-
2026-05-06historical Contingent (Show) 454-char remark
-
2026-05-01$180,000 Active 454-char remark
ⓘ Source: listings_history table (triggers on properties + properties_extension) + one-shot
backfill from property_details.listing_events for pre-trigger history.
Tax reassessment forecast CA · Resets to sale price
- Current annual tax
- $1,463 · $122/mo
- Projected year-2 tax
- $1,463 · $122/mo
- Expected delta
- $0/yr ($0/mo · 0.0%)
ⓘ Screening estimate from a state-policy table — verify with the county assessor before closing.
Climate risk First Street
- Flood 1/10 Low FEMA zone X (unshaded) · 0% chance over 30 yrs
- Wildfire 8/10 Severe
- Heat 6/10 Major 7 d/yr ≥100°F today · 15 d/yr by 30 yrs out
- Wind 1/10 Low
- Air quality 10/10 Extreme 24 unhealthy d/yr today · 25 by 30 yrs out
Nearby sold comps map
Loading sold comps map…
Walkable amenities ~0.75 mi
Loading nearby amenities…
Taxation est. · year 1
- Rental income
- $32,657
- − Mortgage interest
- −$10,083
- − Property taxes
- −$1,463
- − Insurance
- −$900
- − Repairs & maintenance
- −$2,613
- − Management
- −$2,613
- − Depreciation
- −$5,236
- Taxable income
- $9,750
- Est. tax owed @ 24.0%
- −$2,340
- After-tax cash flow
- $9,769/yr
For passive investors: Depreciation is non-cash, so a rental often shows a tax loss while cash-flowing — sheltering income. Rental losses are passive: they offset passive income freely, and up to $25,000/yr can offset ordinary (W-2) income if you actively participate and your MAGI is under $100k (phasing out to $0 by $150k); unused losses carry forward. On sale, claimed depreciation is recaptured at up to 25%, and gains may owe capital-gains tax (a 1031 exchange can defer both). Figures are a year-1 estimate at your 24.0% rate — not tax advice; consult a CPA.
Schools (NCES district)
- District
- Ukiah Unified
- NCES district ID
- 0640300
- Math proficiency
- 24% ▲ 2.00%
- Reading proficiency
- 37% ▲ 4.00%
- Median HH income
- $47,865
- Composite
- 29.21/100
- National rank
- #11858
- State rank
- #1018 of 1400 in CA
Livability — Calpella
- Score
- 49/100
- State rank
- #1171
- US rank
- #25917
Category grades
Schools grade is shown separately in the Schools card above.
Census & demographics
- County
- Mendocino County · 33,164 people
- Metro
- Ukiah, CA
- Population (ZIP)
- 33,164
- Household income
- $69,772
- Rent vs Own
- Severe rent burden
- 1349.0
Population outlook (Mendocino County) Hauer SSP2
- Today (2025)
- 84,643 people
- By 2030
- 82,138 · -3.0%
- By 2040
- 76,402 · -9.7%
- By 2050
- 71,759 · -15.2%
- By 2075
- 61,454 · -27.4%
- By 2100
- 50,130 · -40.8%
Race, ethnicity, and origin ACS 2023
- Neighborhood character
- Diverse neighborhood (Simpson 0.57)
- Race & ethnicity
- White 57% Hispanic / Latino 32% Two or more races 18% Asian 3% Native American 2% Black 1%
- Hispanic origin (detail)
- Mexican 30%
- Common ancestry
- Slovak 3% Italian 2% Lithuanian 2%
- Foreign-born
- 16% · Canada, China, Vietnam
- Languages at home
- 71% English-only · Spanish 25% Chinese 1% Tagalog/Filipino 1%
Political lean MEDSL · Mendocino
- 2024 margin
- Strong D (+26.8) · D 61.3% · R 34.5% · Other 4.2%
- 2008→2024 swing
- -16.0pp toward R · 2008: 42.8pp · 2024: 26.8pp
- All cycles
- 2024: D+26.8 2020: D+35.8 2016: D+29.1 2012: D+37.6 2008: D+42.8
Not yet ingested
- Civics
- —
Market trends
- HPI YoY
- ▼ -485.34%
- Current HPI
- 164.6978
- Rent YoY
- ▲ 6.07%
- Metro
- Ukiah, CA
- State GDP YoY
- ▲ 3.21%
- F500 in state
- 116
Industry mix (Fortune 500 HQ in CA)
| Industry | F500 HQs | Revenue |
|---|---|---|
| Technology | 27 | $1,492B |
|
||
| Financial Services | 3 | $174B |
|
||
| Retail | 3 | $44B |
|
||
| Insurance | 3 | $26B |
|
||
| Media / Entertainment | 2 | $115B |
|
||
| Pharmaceuticals / Biotech | 2 | $62B |
|
||
Price history
3 events — show timeline
- 2026-05-13 Relisted — BAREIS
- 2026-05-06 Contingent — BAREIS
- 2026-05-01 Listed $180,000 BAREIS
Property tax history
+1.9%/yrLatest (2025): $1,463 · +4.1% YoY. Source: county tax records.
Cash-flow waterfall
monthlySold comps — $/sqft
last 12 mo · ≤1 miLoading sold comps…