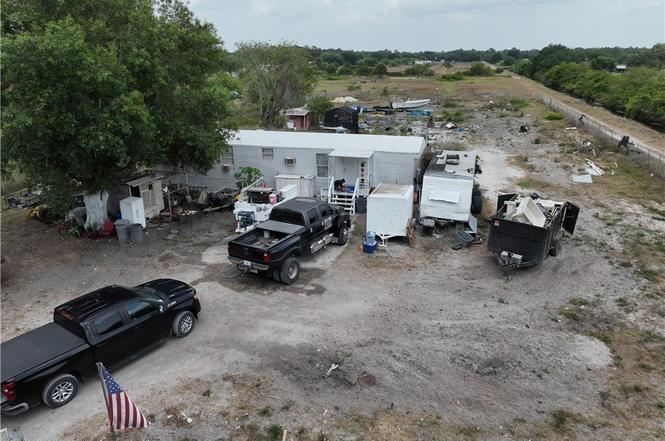
615 N Olivo St · Montura, FL
Flood risk 1/10 · Minimal
- FEMA flood zone
- X (unshaded)
- Chance of flooding over 30 yrs
- 0.0%
- Est. flood insurance / yr
- $507 – $1,088
Fire risk 6/10 · Moderate
- Est. fire insurance / yr
- $947 – $1,759
Heat risk 9/10 · Severe
- Hot days now (above 109°F)
- 7 days/yr
- Hot days in 30 yrs
- 26 days/yr
Wind risk 10/10 · Severe
- Chance of severe wind over 30 yrs
- 99.0%
Air-quality risk 1/10 · Minimal
- Unhealthy air days now
- 0 days/yr
- Unhealthy air days in 30 yrs
- 0 days/yr
Risk factors via First Street. Map © Google.
Why this score? — see what drove the C grade
The composite is a weighted blend of 9 inputs, each scored 0–100. Each bar is that input's sub-score; the figure is the points it added to the 100-point composite (weight × sub-score).
- Cash flow +23.5/30.0
- DSCR +7.5/10.0
- ARV discount +7.5/15.0
- 1% rule +5.7/10.0
- Schools +3.1/10.0
- Livability +3.1/5.0
- Rent growth +2.5/5.0
- Condition / age +2.5/5.0
- Appreciation +0.5/10.0
$169,000
🖨 Deal sheet 📄 Offer letter ✓ Due diligence
Listing remarks
Private 1.25-Acre Property in Montura Ranch Estates! Discover the peaceful country lifestyle on this 1.25-acre fenced property located at the end of a quiet street in desirable Montura Ranch Estates, offering added privacy and plenty of space to enjoy. This property features a 3-bedroom, 1-bath manufactured home with a comfortable layout, including a spacious living area and a functional kitchen. In addition, the property includes an RV, providing extra flexibility for guests, storage, or recreational use. With ample room for animals, equipment, gardening, or future improvements, this property is ideal for those seeking space, privacy, and country living while still maintaining convenien
Key facts
- Quiet street
- Functional kitchen
- Spacious living area
Tags
Property features AI
Finance
- Financial info: Pets allowed
- HOA & community: Non-gated community; No association fee
Exterior
- Utilities: Cable available; Septic tank; Well water
- Home design: Manufactured home with aluminum siding; Single-story; Faces south; Resale property
- Construction: Metal roof; Manufactured construction; Aluminum siding
- Exterior features: Fenced; Patio; Dead-end lot; Canal access; North exposure; Has view
Interior
- Kitchen: Electric cooktop; Freezer; Microwave; Refrigerator
- Bedrooms: Other; Great room
- Flooring: Tile
- Bathrooms: 1 full bathroom
- Heating & cooling: Central heating (electric); Central air conditioning (electric)
- Interior features: Built-in features; Separate/formal dining room; Family/dining room; Living/dining room; Shower only; Separate shower; Sliding windows; Furnishing negotiable
Neighborhood map
What this means for you Summary
Snapshot
- This is a 3-bed/2.0-bath manufactured listed at $169k.
Deal economics
- At list price, monthly cash flow is $314 ($4k/yr) — positive.
- The deal already cash-flows at list — no discount required.
- Meets the 1% rule at list price ($2k rent vs $169k).
- Cap rate 8.5% vs local median 4.3% in Montura — top-decile yield for the area; either an underpriced asset or a hidden risk that comps aren't pricing in. Stress-test before assuming the spread holds.
Location & tenants
- Location reads 61/100 on livability (#777 in FL) — a middle-class / working-renter tenant base. Strengths: cost of living A+, housing A+, crime A-; Watch: health & safety D, schools F, amenities F.
- Hendry (town): math 35% / reading 40% proficiency, ranked #65 of 73 in FL (top 89%) — families likely to look elsewhere, expect single-tenant / working-renter base with shorter leases; 75% free/reduced lunch — lower-income household profile, screen leases tightly.
- Market conditions: 404 active listings in the ZIP; 557 units permitted in Hendry County in 2024 (45 in 5+ unit buildings).
Forward outlook
- Local home prices are declining (-3.0%/yr); year-one equity from $1k of loan paydown is wiped out by about $5k of value loss. Plan a longer hold.
- Hendry County population projected to shrink 7% by 2050 — rents likely to lag national; underwrite the cash flow, not the appreciation.
Negotiation context
- Only 1 days on market — expect competitive offers; lowballing is unlikely to land.
- 4 sale attempts since 3y ago with the ask held roughly flat each time — persistent listings suggest the price (not the market) is what's stuck; bring a comps-based counter.
- Current owner paid $7k; list at $169k implies a 2314% gain — meaningful room to come down on a strong offer.
Risks & watch-outs
- Climate carrying-cost: severe wind risk, 99% chance of damaging wind over 30y; major wildfire risk; extreme-heat days projected 7→26/yr by 2055 (HVAC capex compounding) — expect insurance premiums to compound above CPI over the hold.
Questions for the listing agent
- Is there a deadline driving the sale (1031 exchange, divorce, estate, relocation)? That informs how much negotiation room exists.
- Schools are F-rated, which usually means shorter tenancies and higher turnover. Who's the typical renter profile here, and what's been the actual vacancy rate?
- What's the average days-on-market for RENTAL listings here right now (not sales)? A rising rental-DOM trend means longer vacancies and softer asking-rent achievability than the comps imply.
- What's the recent tenant-quality profile in this submarket — average credit score on applications, eviction rate, late-payment / NSF rate, and stable-employment percentage? A property-management company in the area should have these aggregated.
- How much new for-sale + rental construction is in the pipeline within 1–3 miles? Heavy new supply typically softens prices + rents 12–24 months out; constrained supply supports both.
Investment metrics
- 1% rule
- 1.07% ✓
- Cap rate
- 8.53%
- Cash-on-cash
- 7.97%
- DSCR
- 1.35
- GRM
- 7.8
CMA / ARV
No comps found within radius.
Projected returns pro-forma
-3.0% appreciation · 3.0% rent growth · sell at horizon
- IRR
- -4.2%
- Equity multiple
- 0.84×
- Total profit
- $-7,368
- Equity at exit
- $25,198
- IRR
- 5.5%
- Equity multiple
- 1.41×
- Total profit
- $19,341
- Equity at exit
- $14,612
Cash invested: $47,320 (down + closing). Projections, not guarantees.
Landlord ↔ Tenant lean methodology
- Overall (STATE)
- 87 Strongly Landlord-Friendly
- State Florida
- 87 Strongly Landlord-Friendly · R+3
- County
- — inherits STATE
- City
- — inherits STATE
ZIP-level market 33440
- Home prices YoY
- -2.1%
- Active inventory
- 404
- Price-to-rent
- 7.8×
Monthly cashflow live
- Estimated rent
- $1,807 medium interval (Pro) →
- Mortgage (P&I)
- −$886
- Tax from tax record
- −$156 /mo · $1,877/yr
- Insurance
- −$70
- HOA
- −$0
- Vacancy / Maint / Mgmt
- −$379
- Net cashflow
- $314
Break-even live
Sensitivity live
| Price | -10% $410 | -5% $362 | +0% $314 | +5% $267 | +10% $219 |
|---|---|---|---|---|---|
| Rent | -10% $172 | -5% $243 | +0% $314 | +5% $386 | +10% $457 |
| Rate | -1.0pp $399 | -0.5pp $357 | base $314 | +0.5pp $271 | +1.0pp $226 |
UW: 25.0% down · 7.5% · 30yr · 1.5% tax · 5.0% vac · 8.0% maint · 8.0% mgmt
Financing live
Cash to close
- Down payment
- $42,250
- Closing costs
- $5,070
- Reserves months
- —
- Total cash needed
- —
Loan-product check · same deal, 3 products live
Conventional
25% down · 7.5% · 30yr
- Down + closing
- —
- Monthly P&I
- —
- Monthly cashflow
- —
- DSCR
- —
- Eligible?
- —
Personal DTI + credit; lowest rate.
DSCR
20% down · 8.5% · 30yr
- Down + closing
- —
- Monthly P&I
- —
- Monthly cashflow
- —
- DSCR
- —
- Eligible?
- —
No personal income docs; deal must DSCR.
Hard money
10% down · 12.0% · 12mo
- Down + closing
- —
- Monthly P&I
- —
- Monthly cashflow
- —
- DSCR
- —
- Eligible?
- —
Short-term bridge; refi at stabilization.
Listing history 2 events
-
2026-06-18remarks 699-char remark
-
2026-06-18$169,000 Active 1 DOM
ⓘ Source: listings_history table (triggers on properties + properties_extension) + one-shot
backfill from property_details.listing_events for pre-trigger history.
Tax reassessment forecast FL · Resets to sale price
- Current annual tax
- $1,877 · $156/mo
- Projected year-2 tax
- $1,877 · $156/mo
- Expected delta
- $0/yr ($0/mo · 0.0%)
ⓘ Screening estimate from a state-policy table — verify with the county assessor before closing.
Climate risk First Street
- Flood 1/10 Low FEMA zone X (unshaded) · 0% chance over 30 yrs
- Wildfire 6/10 Major
- Heat 9/10 Extreme 7 d/yr ≥109°F today · 26 d/yr by 30 yrs out
- Wind 10/10 Extreme 99% chance of damaging wind over 30 yrs
- Air quality 1/10 Low 0 unhealthy d/yr today · 0 by 30 yrs out
Nearby sold comps map
Loading sold comps map…
Walkable amenities ~0.75 mi
Loading nearby amenities…
Taxation est. · year 1
- Rental income
- $21,683
- − Mortgage interest
- −$9,467
- − Property taxes
- −$1,877
- − Insurance
- −$845
- − Repairs & maintenance
- −$1,735
- − Management
- −$1,735
- − Depreciation
- −$4,916
- Taxable income
- $1,109
- Est. tax owed @ 24.0%
- −$266
- After-tax cash flow
- $3,507/yr
For passive investors: Depreciation is non-cash, so a rental often shows a tax loss while cash-flowing — sheltering income. Rental losses are passive: they offset passive income freely, and up to $25,000/yr can offset ordinary (W-2) income if you actively participate and your MAGI is under $100k (phasing out to $0 by $150k); unused losses carry forward. On sale, claimed depreciation is recaptured at up to 25%, and gains may owe capital-gains tax (a 1031 exchange can defer both). Figures are a year-1 estimate at your 24.0% rate — not tax advice; consult a CPA.
Schools (NCES district)
- District
- Hendry
- NCES district ID
- 1200780
- Math proficiency
- 35% ▼ -11.00%
- Reading proficiency
- 40% ▼ -4.00%
- Median HH income
- $37,043
- Composite
- 31.16/100
- National rank
- #6054
- State rank
- #65 of 73 in FL
Livability — Montura
- Score
- 61/100
- State rank
- #777
- US rank
- #17589
Category grades
Schools grade is shown separately in the Schools card above.
Census & demographics
- Census place
- Montura, FL
- Population (ZIP)
- 21,119
Population outlook (Hendry County) Hauer SSP2
- Today (2025)
- 38,866 people
- By 2030
- 38,558 · -0.8%
- By 2040
- 37,743 · -2.9%
- By 2050
- 36,117 · -7.1%
- By 2075
- 30,070 · -22.6%
- By 2100
- 21,966 · -43.5%
Race, ethnicity, and origin ACS 2023
- Neighborhood character
- Diverse neighborhood (Simpson 0.62)
- Race & ethnicity
- Hispanic / Latino 55% Two or more races 26% White 23% Black 18% Native American 3% Asian 2%
- Hispanic origin (detail)
- Mexican 18% Puerto Rican 5% Cuban 18%
- Common ancestry
- Lithuanian 2% Italian 1% Serbian 1%
- Foreign-born
- 30% · Canada, Jamaica, China
- Languages at home
- 48% English-only · Spanish 48% Other Indo-European 1% French/Haitian/Cajun 1%
Political lean MEDSL · Hendry
- 2024 margin
- Solid R (+38.3) · D 30.4% · R 68.7%
- 2008→2024 swing
- -31.1pp toward R · 2008: -7.2pp · 2024: -38.3pp
- All cycles
- 2024: R+38.3 2020: R+23.0 2016: R+14.2 2012: R+5.9 2008: R+7.2
Not yet ingested
- Civics
- —
Market trends
- HPI YoY
- ▼ -9.08%
- Current HPI
- 414.9243
- Rent YoY
- —
- Metro
- —
- State GDP YoY
- ▲ 3.28%
- F500 in state
- 36
Industry mix (Fortune 500 HQ in FL)
| Industry | F500 HQs | Revenue |
|---|---|---|
| Industrial Technology | 2 | $29B |
|
||
| Insurance | 2 | $17B |
|
||
| Retail | 1 | $60B |
|
||
| Technology Distribution | 1 | $58B |
|
||
| Homebuilding | 1 | $35B |
|
||
| Technology Manufacturing | 1 | $35B |
|
||
Price history
+2314.3% since first listed13 events — show timeline
- 2026-06-18 Listed $169,000 FORTMLS
- 2025-09-02 Listing Removed — Stellar MLS as Distributed by MLS Grid
- 2025-02-04 Listing Removed — FORTMLS
- 2024-11-07 Price Changed $139,900 FORTMLS
- 2024-10-14 Price Changed $148,900 FORTMLS
- 2024-09-17 Price Changed $151,000 FORTMLS
- 2024-09-10 Price Changed $152,000 FORTMLS
- 2024-09-02 Listed $153,000 Stellar MLS as Distributed by MLS Grid
- 2024-09-02 Listed $153,000 FORTMLS
- 2024-08-08 Listing Removed — FORTMLS
- 2024-05-11 Price Changed $155,900 FORTMLS
- 2023-08-06 Listed $143,900 FORTMLS
- 1994-05-23 Sold (Public Records) $7,000 Public Records
Property tax history
+8.4%/yrLatest (2025): $1,877 · +2.5% YoY. Source: county tax records.
Cash-flow waterfall
monthlySold comps — $/sqft
last 12 mo · ≤1 miLoading sold comps…