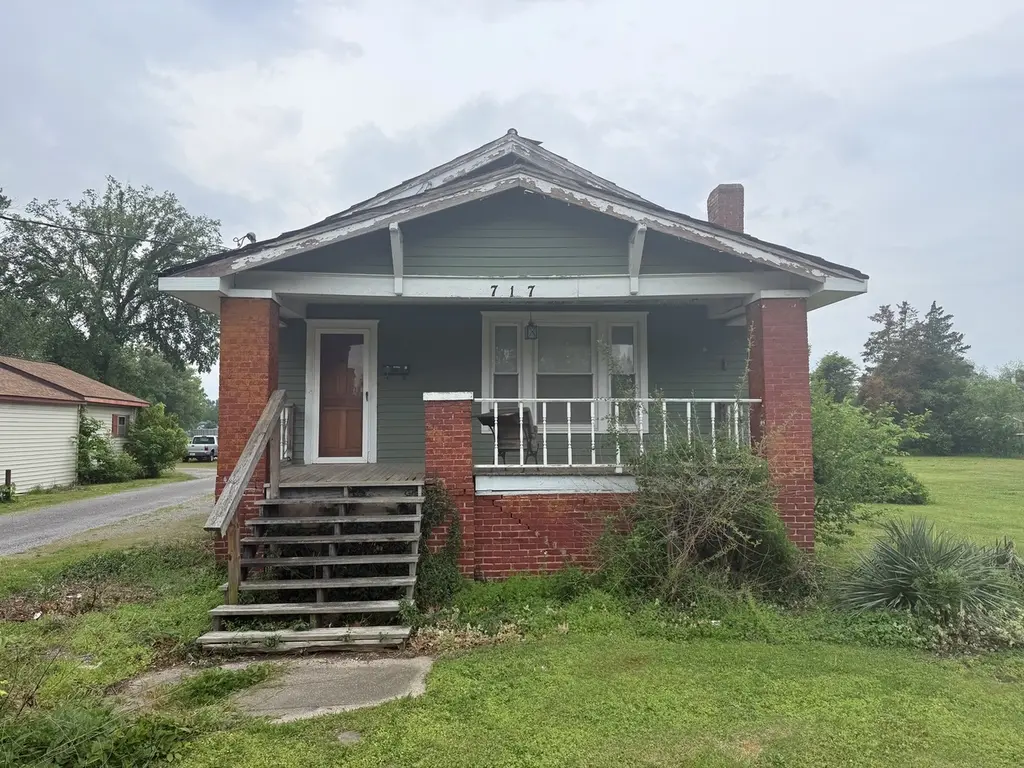
717 W Sloan St · Harrisburg, IL
Flood risk 6/10 · Moderate
- FEMA flood zone
- A
- Chance of flooding over 30 yrs
- 0.7%
- Est. flood insurance / yr
- $946 – $6,584
Fire risk 1/10 · Minimal
- Est. fire insurance / yr
- $804 – $1,492
Heat risk 5/10 · Moderate
- Hot days now (above 108°F)
- 7 days/yr
- Hot days in 30 yrs
- 20 days/yr
Wind risk 2/10 · Minimal
- Chance of severe wind over 30 yrs
- 4.0%
Air-quality risk 2/10 · Minimal
- Unhealthy air days now
- 1 days/yr
- Unhealthy air days in 30 yrs
- 1 days/yr
Risk factors via First Street. Map © Google.
Why this score? — see what drove the B grade
The composite is a weighted blend of 9 inputs, each scored 0–100. Each bar is that input's sub-score; the figure is the points it added to the 100-point composite (weight × sub-score).
- Cash flow +30.0/30.0
- ARV discount +15.0/15.0
- 1% rule +10.0/10.0
- DSCR +10.0/10.0
- Livability +3.6/5.0
- Rent growth +2.5/5.0
- Condition / age +2.5/5.0
- Schools +1.3/10.0
- Appreciation +0.0/10.0
$50,000
🖨 Deal sheet 📄 Offer letter ✓ Due diligence
Listing remarks
Looking for a fixer-upper with serious upside? This 2-bedroom, 1-bath "good bones" home offers an affordable entry point for investors, flippers, landlords, or buyers ready to build equity through renovation. While the home is in need of repairs and updating, the functional layout and full basement provide the solid foundation rehab-minded buyers are always searching for. Whether your vision includes a stylish remodel, long-term rental, or affordable personal residence, the potential here is undeniable. The standout feature is the impressive 30x50 detached building with a concrete floor that has already been insulated and divided into separate rooms. With the right finishing touch
Key facts
- Separate rooms
- Full basement
- Detached building
Tags
Property features AI
Finance
- Other: Property in unincorporated area
- Financial info: Tax exemptions listed for homeowner, senior, and disabled persons
- HOA & community: No master association fees (not required)
Exterior
- Parking: Detached garage (garage owned); Gravel parking; Total of 1 parking space and 1 garage space
- Utilities: Public water; Public sewer; Natural gas service
- Home design: Detached single-family home; One-story layout; Fee simple ownership
- Construction: Originally built approximately 81–90 years ago; Wood siding exterior; Brick/mortar foundation; Shingle roof not specified (no roof detail provided)
- Exterior features: Lot dimensions approximately 75 x 203; Lot size about 0.25–0.49 acre; Located in a flood zone; No special lot features listed
Interior
- Kitchen: Kitchen on main level (17 x 12) with laminate flooring
- Bedrooms: Master bedroom on main level (11 x 12) with carpet; Second bedroom on main level (12 x 9) with carpet
- Flooring: Carpet in living areas and bedrooms; Laminate in kitchen
- Bathrooms: One full bathroom
- Heating & cooling: Natural gas heating
- Interior features: Five total rooms; Unfinished full basement
- Laundry & utility: Dedicated laundry room
Neighborhood map
What this means for you Summary
Snapshot
- This is a 2-bed/1.0-bath single-family listed at $50k.
Deal economics
- At list price, monthly cash flow is $195 ($2k/yr) — positive.
- The deal already cash-flows at list — no discount required.
- Meets the 1% rule at list price ($1k rent vs $50k).
- Recommended offer: $49k (1.5% below list) — sets the bar for market timing.
- Cap rate 18.5% vs local median 5.1% in Harrisburg — top-decile yield for the area; either an underpriced asset or a hidden risk that comps aren't pricing in. Stress-test before assuming the spread holds.
Location & tenants
- Location reads 72/100 on livability (#309 in IL) — a middle-class / working-renter tenant base. Strengths: crime A+, cost of living A+, housing A+; Watch: commute F, employment F.
- Harrisburg CUSD 3 (town): math 5% / reading 25% proficiency, ranked #521 of 620 in IL (top 84%) — low school quality limits family demand, transient renter base, plan for 1-2y turnover.
- Zoned schools: Harrisburg Middle School (math 7% / reading 28%, grade F, #450 of 665 statewide, top 69%, 331 students, 0% FRL); Harrisburg High School (math 2% / reading 22%, grade F, #506 of 693 statewide, top 74%, 544 students, 0% FRL) — zoned schools average 0% FRL vs 51% district-wide (51 pts lower); this property's tenant base skews higher-income than the district average.
- Market conditions: 73 active listings in the ZIP.
Forward outlook
- Local home prices are declining (-3.0%/yr); year-one equity from $346 of loan paydown is wiped out by about $2k of value loss. Plan a longer hold.
- Saline County population projected at -16% by 2050 — secular population decline; favor cash flow + early exit over multi-decade hold.
- At projected returns (-3.0% appreciation + 3.0% rent growth), your $14k cash investment doubles in ~7 years — after that, you're playing with house money.
Negotiation context
- It's been on market 30 days — a 2% lower offer ($49k) is reasonable based on typical stale-listing flexibility.
Risks & watch-outs
- Watch-outs: flood insurance adds $314/mo; built in 1940 — expect roof / HVAC / electrical / plumbing capex.
- Climate carrying-cost: in FEMA flood zone A (mandatory federal flood insurance); extreme-heat days projected 7→20/yr by 2055 (HVAC capex compounding) — expect insurance premiums to compound above CPI over the hold.
Questions for the listing agent
- Built in 1940 — when were the roof, HVAC, electrical panel, plumbing, and water heater last replaced?
- What's the actual annual flood-insurance premium (NFIP or private), and is the property in a SFHA with mandatory coverage?
- Is there a deadline driving the sale (1031 exchange, divorce, estate, relocation)? That informs how much negotiation room exists.
- Schools are F-rated, which usually means shorter tenancies and higher turnover. Who's the typical renter profile here, and what's been the actual vacancy rate?
- What's the average days-on-market for RENTAL listings here right now (not sales)? A rising rental-DOM trend means longer vacancies and softer asking-rent achievability than the comps imply.
- What's the recent tenant-quality profile in this submarket — average credit score on applications, eviction rate, late-payment / NSF rate, and stable-employment percentage? A property-management company in the area should have these aggregated.
- How much new for-sale + rental construction is in the pipeline within 1–3 miles? Heavy new supply typically softens prices + rents 12–24 months out; constrained supply supports both.
Investment metrics
- 1% rule
- 2.12% ✓
- Cap rate
- 18.51%
- Cash-on-cash
- 43.63%
- DSCR
- 2.94
- GRM
- 3.9
CMA / ARV
- ARV (on-the-fly)
- $64,064
- Comps found
- 12
Show comp detail 12 sales within ~0.75 mi
| Address | Dist | Beds/Ba | Sqft | Sold | Price | $/sf | Match |
|---|---|---|---|---|---|---|---|
| 609 S Ledford St | 0.20mi | 2/1.0 | 1,075 (-6%) | 2mo | $15,500 | $14 | 79 |
| 317 S Webster St | 0.49mi | 2/1.0 | 1,120 (-2%) | 2mo | $20,000 | $18 | 72 |
| 1028 S Roosevelt St | 0.61mi | 2/1.0 | 1,120 (-2%) | 2mo | $40,000 | $36 | 67 |
| 1101 S Mckinley St | 0.48mi | 2/1.0 | 1,080 (-6%) | 3mo | $85,000 | $79 | 66 |
| 430 W Church St | 0.48mi | 2/1.0 | 1,259 (+10%) | 0mo | $45,000 | $36 | 61 |
| 500 W Sloan St | 0.20mi | 3/1.0 (+1) | 1,300 (+14%) | 4mo | $35,000 | $27 | 60 |
| 206 W Homer Ave | 0.45mi | 3/1.0 (+1) | 1,236 (+8%) | 4mo | $114,000 | $92 | 57 |
| 103 W Park St | 0.56mi | 2/3.0 | 1,200 (+5%) | 3mo | $139,500 | $116 | 55 |
| 1001 S Jackson St | 0.62mi | 3/1.0 (+1) | 1,064 (-7%) | 3mo | $108,500 | $102 | 52 |
| 1116 S Land St St | 0.44mi | 3/1.0 (+1) | 990 (-14%) | 4mo | $80,000 | $81 | 49 |
| 213 N Granger St | 0.74mi | 2/1.0 | 1,290 (+13%) | 3mo | $35,000 | $27 | 42 |
| 215 S Jackson St | 0.61mi | 3/1.5 (+1) | 1,288 (+13%) | 6mo | $72,000 | $56 | 39 |
Match score weights: distance 35% · size 25% · config 20% · recency 20%. Top-matched comps best support the ARV.
Projected returns pro-forma
-3.0% appreciation · 3.0% rent growth · sell at horizon
- IRR
- 8.2%
- Equity multiple
- 1.32×
- Total profit
- $4,535
- Equity at exit
- $7,455
- IRR
- 17.7%
- Equity multiple
- 2.48×
- Total profit
- $20,770
- Equity at exit
- $4,323
Cash invested: $14,000 (down + closing). Projections, not guarantees.
Landlord ↔ Tenant lean methodology
- Overall (STATE)
- 43 Moderately Tenant-Leaning
- State Illinois
- 43 Moderately Tenant-Leaning · D+7
- County
- — inherits STATE
- City
- — inherits STATE
ZIP-level market 62946
- Active inventory
- 73
- Price-to-rent
- 3.9×
Monthly cashflow live
- Estimated rent
- $1,059 medium interval (Pro) →
- Mortgage (P&I)
- −$262
- Tax from tax record
- −$45 /mo · $536/yr
- Insurance
- −$21
- Flood insurance flood zone
- −$314 /mo · $3,765/yr
- HOA
- −$0
- Vacancy / Maint / Mgmt
- −$222
- Net cashflow
- $195
Break-even live
UW: 25.0% down · 7.5% · 30yr · 1.5% tax · 5.0% vac · 8.0% maint · 8.0% mgmt
Financing live
Cash to close
- Down payment
- $12,500
- Closing costs
- $1,500
- Reserves months
- —
- Total cash needed
- —
Loan-product check · same deal, 3 products live
Conventional
25% down · 7.5% · 30yr
- Down + closing
- —
- Monthly P&I
- —
- Monthly cashflow
- —
- DSCR
- —
- Eligible?
- —
Personal DTI + credit; lowest rate.
DSCR
20% down · 8.5% · 30yr
- Down + closing
- —
- Monthly P&I
- —
- Monthly cashflow
- —
- DSCR
- —
- Eligible?
- —
No personal income docs; deal must DSCR.
Hard money
10% down · 12.0% · 12mo
- Down + closing
- —
- Monthly P&I
- —
- Monthly cashflow
- —
- DSCR
- —
- Eligible?
- —
Short-term bridge; refi at stabilization.
Listing history 16 events
-
2026-06-18days on market $50,000 Active 30 DOM
-
2026-06-17days on market $50,000 Active 29 DOM
-
2026-06-16days on market $50,000 Active 28 DOM
-
2026-06-15days on market $50,000 Active 27 DOM
-
2026-06-13days on market $50,000 Active 25 DOM
-
2026-06-12days on market $50,000 Active 24 DOM
-
2026-06-09days on market $50,000 Active 21 DOM
-
2026-06-08days on market $50,000 Active 20 DOM
-
2026-06-07days on market $50,000 Active 19 DOM
-
2026-06-07days on market $50,000 Active 18 DOM
-
2026-06-04days on market $50,000 Active 15 DOM
-
2026-06-02days on market $50,000 Active 14 DOM
-
2026-06-01days on market $50,000 Active 13 DOM
-
2026-05-31days on market $50,000 Active 12 DOM
-
2026-05-31days on market $50,000 Active 11 DOM
-
2026-05-19$50,000 Active
ⓘ Source: listings_history table (triggers on properties + properties_extension) + one-shot
backfill from property_details.listing_events for pre-trigger history.
Tax reassessment forecast IL · Partial reset (capped growth)
- Current annual tax
- $536 · $45/mo
- Projected year-2 tax
- $835 · $70/mo
- Expected delta
- +$300/yr (+$25/mo · 55.9%)
ⓘ Screening estimate from a state-policy table — verify with the county assessor before closing.
Climate risk First Street
- Flood 6/10 Major FEMA zone A · 70% chance over 30 yrs
- Wildfire 1/10 Low
- Heat 5/10 Major 7 d/yr ≥108°F today · 20 d/yr by 30 yrs out
- Wind 2/10 Low 4% chance of damaging wind over 30 yrs
- Air quality 2/10 Low 1 unhealthy d/yr today · 1 by 30 yrs out
Nearby sold comps map
Loading sold comps map…
Walkable amenities ~0.75 mi
Loading nearby amenities…
Taxation est. · year 1
- Rental income
- $12,710
- − Mortgage interest
- −$2,801
- − Property taxes
- −$536
- − Insurance
- −$4,015
- − Repairs & maintenance
- −$1,017
- − Management
- −$1,017
- − Depreciation
- −$1,455
- Taxable income
- $1,870
- Est. tax owed @ 24.0%
- −$449
- After-tax cash flow
- $1,895/yr
For passive investors: Depreciation is non-cash, so a rental often shows a tax loss while cash-flowing — sheltering income. Rental losses are passive: they offset passive income freely, and up to $25,000/yr can offset ordinary (W-2) income if you actively participate and your MAGI is under $100k (phasing out to $0 by $150k); unused losses carry forward. On sale, claimed depreciation is recaptured at up to 25%, and gains may owe capital-gains tax (a 1031 exchange can defer both). Figures are a year-1 estimate at your 24.0% rate — not tax advice; consult a CPA.
Schools (NCES district)
- District
- Harrisburg CUSD 3
- NCES district ID
- 1718270
- Math proficiency
- 5% ▼ -5.00%
- Reading proficiency
- 25% ▼ -9.00%
- Median HH income
- $38,717
- Composite
- 12.61/100
- National rank
- #9613
- State rank
- #521 of 620 in IL
Livability — Harrisburg
- Score
- 72/100
- State rank
- #309
- US rank
- #6073
Category grades
Schools grade is shown separately in the Schools card above.
Census & demographics
- Census place
- Harrisburg, IL
- Population (ZIP)
- 11,465
Population outlook (Saline County) Hauer SSP2
- Today (2025)
- 23,915 people
- By 2030
- 23,262 · -2.7%
- By 2040
- 21,775 · -8.9%
- By 2050
- 20,098 · -16.0%
- By 2075
- 15,234 · -36.3%
- By 2100
- 10,302 · -56.9%
Race, ethnicity, and origin ACS 2023
- Neighborhood character
- Predominantly White (93%)
- Race & ethnicity
- White 93% Two or more races 4% Black 3%
- Common ancestry
- Italian 2% Slovak 2% Serbian 2%
- Foreign-born
- 0%
Political lean MEDSL · Saline
- 2024 margin
- Solid R (+49.0) · D 24.8% · R 73.8% · Other 1.3%
- 2008→2024 swing
- -40.1pp toward R · 2008: -8.9pp · 2024: -49.0pp
- All cycles
- 2024: R+49.0 2020: R+47.9 2016: R+50.7 2012: R+29.0 2008: R+8.9
Not yet ingested
- Civics
- —
Market trends
- HPI YoY
- ▼ -61.20%
- Current HPI
- 102.6962
- Rent YoY
- —
- Metro
- —
- State GDP YoY
- ▲ 1.59%
- F500 in state
- 60
Industry mix (Fortune 500 HQ in IL)
| Industry | F500 HQs | Revenue |
|---|---|---|
| Insurance | 4 | $201B |
|
||
| Consumer Goods | 4 | $87B |
|
||
| Industrial Machinery | 3 | $64B |
|
||
| Healthcare | 2 | $55B |
|
||
| Retail / Pharmacy | 1 | $148B |
|
||
| Agriculture / Food | 1 | $86B |
|
||
Price history
1 event — show timeline
- 2026-05-19 Listed $50,000 MRED as Distributed by MLS Grid
Property tax history
-4.6%/yrLatest (2024): $536 · +75.4% YoY. Source: county tax records.
Cash-flow waterfall
monthlySold comps — $/sqft
last 12 mo · ≤1 miLoading sold comps…