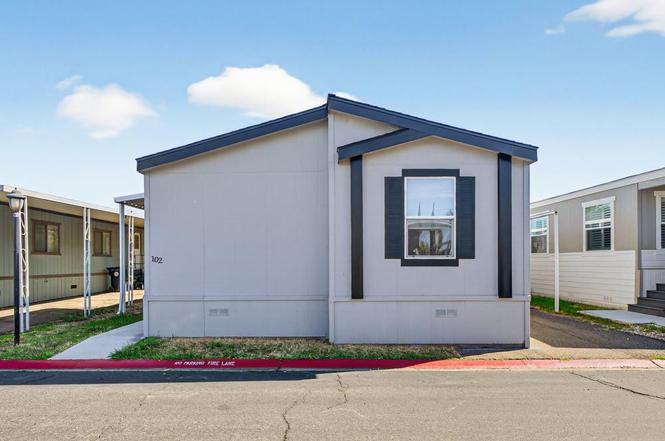
102 Village Cir · Sacramento, CA
Flood risk 1/10 · Minimal
- FEMA flood zone
- X (unshaded)
- Chance of flooding over 30 yrs
- 0.0%
- Est. flood insurance / yr
- $507 – $1,088
Fire risk 1/10 · Minimal
- Est. fire insurance / yr
- $659 – $1,223
Heat risk 7/10 · Major
- Hot days now (above 102°F)
- 7 days/yr
- Hot days in 30 yrs
- 15 days/yr
Wind risk 1/10 · Minimal
- Chance of severe wind over 30 yrs
- —
Air-quality risk 10/10 · Severe
- Unhealthy air days now
- 33 days/yr
- Unhealthy air days in 30 yrs
- 38 days/yr
Risk factors via First Street. Map © Google.
Why this score? — see what drove the B grade
The composite is a weighted blend of 9 inputs, each scored 0–100. Each bar is that input's sub-score; the figure is the points it added to the 100-point composite (weight × sub-score).
- Cash flow +30.0/30.0
- 1% rule +10.0/10.0
- DSCR +10.0/10.0
- ARV discount +9.4/15.0
- Livability +3.6/5.0
- Schools +3.2/10.0
- Condition / age +2.5/5.0
- Rent growth +1.8/5.0
- Appreciation +0.0/10.0
$129,500
🖨 Deal sheet 📄 Offer letter ✓ Due diligence
Listing remarks
Welcome to 102 Village Circle, Sacramento, CA 95838 a well-maintained 3-bedroom, 2-bath home located in a desirable gated all-age community in North Sacramento. This inviting home features a functional open layout with abundant natural light, updated fixtures and a newer roof, offering comfort and peace of mind. The spacious living arears flows seamlessly into the kitchen and dining space - ideal for everyday living and entertaining. Residents Enjoy fantastic community amenities including a swimming pool, clubhouse, playground, and pet - friendly areas. Conveniently located to schools, shopping, and with easy freeway access for commuters. An excellent opportunity for first- buyers or those
Key facts
- Gated community
- Clubhouse
- Newer roof
Tags
Property features AI
Finance
- Financial info: Land lease: No (listed land lease amount provided separately)
- HOA & community: No association; Not a senior community
Exterior
- Parking: Attached covered parking
- Utilities: Individual electric meter; Individual gas meter; 220V in laundry; Public water; Public sewer
- Home design: Manufactured in park (double wide); Built in 2001
- Construction: Composition roof; Wood skirting; Fleetwood make
- Exterior features: Backyard; Shed(s)
Interior
- Kitchen: Free-standing gas range; Hood over range; Dishwasher; Disposal
- Bedrooms: 3 bedrooms
- Flooring: Vinyl flooring; Wood flooring
- Bathrooms: 2 full bathrooms; Double sinks; Tub with shower over; Shower stall(s)
- Heating & cooling: Central heating; Central air conditioning; Ceiling fans
- Interior features: Cathedral ceiling; Skylight(s); Pantry closet; Laminate countertops; Kitchen and family room combined / dining and family room combined; Storage area (interior)
- Laundry & utility: Washer and dryer included; Laundry hookups; Laundry located inside
Neighborhood map
What this means for you Summary
Snapshot
- This is a 3-bed/2.0-bath manufactured listed at $130k.
Deal economics
- At list price, monthly cash flow is $766 ($9k/yr) — positive.
- The deal already cash-flows at list — no discount required.
- Meets the 1% rule at list price ($2k rent vs $130k).
- Recommended offer: $118k (9.0% below list) — sets the bar for market timing.
- Cap rate 13.4% vs local median 3.0% in Sacramento — top-decile yield for the area; either an underpriced asset or a hidden risk that comps aren't pricing in. Stress-test before assuming the spread holds.
Location & tenants
- Location reads 71/100 on livability (#218 in CA) — a middle-class / working-renter tenant base. Strengths: amenities A+, commute A+, housing A; Watch: schools D+, crime F, cost of living F.
- Robla Elementary (urban): math 29% / reading 38% proficiency, ranked #923 of 1,400 in CA (top 66%) — families likely to look elsewhere, expect single-tenant / working-renter base with shorter leases; 77% free/reduced lunch — lower-income household profile, screen leases tightly.
- Market conditions: Rents soft (-2.7%/yr); 162 active listings in the ZIP; 16 comparable units currently listed for rent nearby; rentals at typical pace (median 24d on market — plan ~3-4 weeks tenant-placement turnaround); 6,825 units permitted in Sacramento County in 2024 (1,752 in 5+ unit buildings).
- This rent runs 37% of the median local income ($68k/yr) — at the standard rent-burdened threshold; future hikes will face affordability resistance.
Forward outlook
- Local home prices are declining (-3.0%/yr); year-one equity from $895 of loan paydown is wiped out by about $4k of value loss. Plan a longer hold.
- Sacramento County population projected at +17% by 2050 — long-run rental-demand tailwind backs the buy-and-hold thesis.
- At projected returns (-3.0% appreciation + 0.0% rent growth), your $36k cash investment doubles in ~6 years — after that, you're playing with house money.
Negotiation context
- It's been on market 96 days — a 9% lower offer ($118k) is reasonable based on typical stale-listing flexibility.
Risks & watch-outs
- Climate carrying-cost: extreme-heat days projected 7→15/yr by 2055 (HVAC capex compounding) — expect insurance premiums to compound above CPI over the hold.
Questions for the listing agent
- It's been on market 96 days. Have you received any prior offers? Is the seller open to a 9% concession, seller financing, or rate buy-down credit?
- Why hasn't it sold? Are there any deal-killer items the seller is aware of (foundation, flood, title, zoning, code violations)?
- Is there a deadline driving the sale (1031 exchange, divorce, estate, relocation)? That informs how much negotiation room exists.
- Schools are D-rated, which usually means shorter tenancies and higher turnover. Who's the typical renter profile here, and what's been the actual vacancy rate?
- Crime grade is F in this area — have there been break-ins, vandalism, or insurance claims at this property in the last 3 years? What carrier currently insures it and at what premium?
- What's the average days-on-market for RENTAL listings here right now (not sales)? A rising rental-DOM trend means longer vacancies and softer asking-rent achievability than the comps imply.
- What's the recent tenant-quality profile in this submarket — average credit score on applications, eviction rate, late-payment / NSF rate, and stable-employment percentage? A property-management company in the area should have these aggregated.
- How much new for-sale + rental construction is in the pipeline within 1–3 miles? Heavy new supply typically softens prices + rents 12–24 months out; constrained supply supports both.
Investment metrics
- 1% rule
- 1.62% ✓
- Cap rate
- 13.39%
- Cash-on-cash
- 25.36%
- DSCR
- 2.13
- GRM
- 5.1
CMA / ARV
- ARV (on-the-fly)
- $135,300
- Comps found
- 7
Show comp detail 7 sales within ~0.75 mi
| Address | Dist | Beds/Ba | Sqft | Sold | Price | $/sf | Match |
|---|---|---|---|---|---|---|---|
| 88 Village Cir | 0.05mi | 3/2.0 | 1,248 (+2%) | 0mo | $136,900 | $110 | 95 |
| 216 Village Cir #216 | 0.07mi | 3/2.0 | 1,152 (-6%) | 5mo | $82,000 | $71 | 82 |
| 152 Village Cir #152 | 0.05mi | 3/2.0 | 1,344 (+9%) | 8mo | $125,000 | $93 | 76 |
| 197 Village Cir | 0.16mi | 3/2.0 | 1,142 (-7%) | 22mo | $140,000 | $123 | 62 |
| 220 Village Cir #220 | 0.11mi | 3/2.0 | 1,081 (-12%) | 18mo | $162,500 | $150 | 60 |
| 62 Kit Ln | 0.03mi | 2/2.0 (-1) | 1,344 (+9%) | 23mo | $110,000 | $82 | 59 |
| 81 Village Cir | 0.04mi | 3/2.0 | 1,400 (+14%) | 24mo | $212,900 | $152 | 55 |
Match score weights: distance 35% · size 25% · config 20% · recency 20%. Top-matched comps best support the ARV.
Projected returns pro-forma
-3.0% appreciation · 0.0% rent growth · sell at horizon
- IRR
- 15.5%
- Equity multiple
- 1.60×
- Total profit
- $21,691
- Equity at exit
- $19,309
- IRR
- 21.8%
- Equity multiple
- 2.60×
- Total profit
- $58,046
- Equity at exit
- $11,197
Cash invested: $36,260 (down + closing). Projections, not guarantees.
Landlord ↔ Tenant lean methodology
- Overall (STATE)
- 18 Strongly Tenant-Friendly
- State California
- 18 Strongly Tenant-Friendly · D+13
- County
- — inherits STATE
- City
- — inherits STATE
ZIP-level market 95838
- Rents YoY
- -2.7%
- Active inventory
- 162
- Price-to-rent
- 5.1×
Monthly cashflow live
- Estimated rent
- $2,103 high interval (Pro) →
- Mortgage (P&I)
- −$679
- Tax est. 1.5%
- −$162 /mo · $1,942/yr
- Insurance
- −$54
- HOA
- −$0
- Vacancy / Maint / Mgmt
- −$442
- Net cashflow
- $766
Break-even live
UW: 25.0% down · 7.5% · 30yr · 1.5% tax · 5.0% vac · 8.0% maint · 8.0% mgmt
Financing live
Cash to close
- Down payment
- $32,375
- Closing costs
- $3,885
- Reserves months
- —
- Total cash needed
- —
Loan-product check · same deal, 3 products live
Conventional
25% down · 7.5% · 30yr
- Down + closing
- —
- Monthly P&I
- —
- Monthly cashflow
- —
- DSCR
- —
- Eligible?
- —
Personal DTI + credit; lowest rate.
DSCR
20% down · 8.5% · 30yr
- Down + closing
- —
- Monthly P&I
- —
- Monthly cashflow
- —
- DSCR
- —
- Eligible?
- —
No personal income docs; deal must DSCR.
Hard money
10% down · 12.0% · 12mo
- Down + closing
- —
- Monthly P&I
- —
- Monthly cashflow
- —
- DSCR
- —
- Eligible?
- —
Short-term bridge; refi at stabilization.
Rent comps 16 comps
| Address | Beds | Baths | Sqft | Rent | $/sqft | DOM | Units | Dist |
|---|---|---|---|---|---|---|---|---|
| 3720 Astoria St Unit 8 Sacramento, CA | 2.0 | 1.0 | 950 | $1,395 | $1.47 | 1d | 1 | 0.62mi |
| 4426 Dry Creek Rd Sacramento, CA | 3.0 | 2.5 | 1408 | $2,700 | $1.92 | 1d | 1 | 0.96mi |
| 1138 North Ave Unit A Sacramento, CA | 3.0 | 2.0 | 900 | $2,000 | $2.22 | 1d | 1 | 1.01mi |
| 3226 Pilgrim Ct Sacramento, CA | 3.0 | 1.0 | 1300 | $2,700 | $2.08 | 1d | 1 | 1.10mi |
| 3829 Belden St Sacramento, CA | 2.0 | 2.0 | 1001 | $2,126 | $2.12 | 43d | 1 | 1.14mi |
| 4015 May St Sacramento, CA | 2.0 | 1.5 | 875 | $1,850 | $2.11 | 23d | 1 | 1.16mi |
| 3901 Cypress St Unit 921 Harris Sacramento, CA | 2.0 | 1.0 | 700 | $1,950 | $2.79 | 43d | 1 | 1.30mi |
| 3231 Del Mar Way Sacramento, CA | 3.0 | 1.0 | 1380 | $2,095 | $1.52 | 16d | 1 | 1.31mi |
| 3616 Branch St Sacramento, CA | 2.0 | 1.0 | 850 | $1,599 | $1.88 | 1d | 1 | 1.34mi |
| 3228 Fairview Ct Apt 4 Sacramento, CA | 2.0 | 1.0 | 795 | $1,395 | $1.75 | 43d | 1 | 1.39mi |
| 2256 Frazier Ct Unit ADU Sacramento, CA | 3.0 | 1.5 | 917 | $2,350 | $2.56 | 43d | 1 | 1.43mi |
| 3101 Truax Ct Sacramento, CA | 1.0–2.0 | 1.0 | 667 | $1,495 | $2.24 | 7d | 4 | 1.46mi |
| 2503 Edison Ave Unit 2503-11 Sacramento, CA | 2.0 | 1.0 | 825 | $1,600 | $1.94 | 23d | 1 | 1.46mi |
| 3307 Belden St Sacramento, CA | 2.0 | 1.0 | 768 | $2,200 | $2.86 | 1d | 1 | 1.46mi |
| 2253 Edison Ave Sacramento, CA | 3.0 | 1.0 | 980 | $2,400 | $2.45 | 43d | 1 | 1.46mi |
| 2507 Edison Ave Unit 2507-11 Sacramento, CA | 2.0 | 1.0 | 825 | $1,600 | $1.94 | 23d | 1 | 1.47mi |
Listing history 8 events
-
2026-06-10status $129,500 Pending 96 DOM
-
2026-06-09days on market $129,500 Active 96 DOM
-
2026-06-08days on market $129,500 Active 95 DOM
-
2026-06-07days on market $129,500 Active 94 DOM
-
2026-06-03days on market $129,500 Active 90 DOM
-
2026-06-02days on market $129,500 Active 89 DOM
-
2026-06-01days on market $129,500 Active 88 DOM
-
2026-05-31days on market $129,500 Active 87 DOM
ⓘ Source: listings_history table (triggers on properties + properties_extension) + one-shot
backfill from property_details.listing_events for pre-trigger history.
Climate risk First Street
- Flood 1/10 Low FEMA zone X (unshaded) · 0% chance over 30 yrs
- Wildfire 1/10 Low
- Heat 7/10 Severe 7 d/yr ≥102°F today · 15 d/yr by 30 yrs out
- Wind 1/10 Low
- Air quality 10/10 Extreme 33 unhealthy d/yr today · 38 by 30 yrs out
Nearby sold comps map
Loading sold comps map…
Walkable amenities ~0.75 mi
Loading nearby amenities…
Taxation est. · year 1
- Rental income
- $25,234
- − Mortgage interest
- −$7,254
- − Property taxes
- −$1,942
- − Insurance
- −$648
- − Repairs & maintenance
- −$2,019
- − Management
- −$2,019
- − Depreciation
- −$3,767
- Taxable income
- $7,585
- Est. tax owed @ 24.0%
- −$1,820
- After-tax cash flow
- $7,375/yr
For passive investors: Depreciation is non-cash, so a rental often shows a tax loss while cash-flowing — sheltering income. Rental losses are passive: they offset passive income freely, and up to $25,000/yr can offset ordinary (W-2) income if you actively participate and your MAGI is under $100k (phasing out to $0 by $150k); unused losses carry forward. On sale, claimed depreciation is recaptured at up to 25%, and gains may owe capital-gains tax (a 1031 exchange can defer both). Figures are a year-1 estimate at your 24.0% rate — not tax advice; consult a CPA.
Schools (NCES district)
- District
- Robla Elementary
- NCES district ID
- 0633240
- Math proficiency
- 29% ▲ 1.00%
- Reading proficiency
- 38% ▲ 3.00%
- Median HH income
- $48,481
- Composite
- 31.64/100
- National rank
- #11126
- State rank
- #923 of 1400 in CA
Livability — Sacramento
- Score
- 71/100
- State rank
- #218
- US rank
- #6957
Category grades
Schools grade is shown separately in the Schools card above.
Census & demographics
- Census place
- Sacramento, CA
- County
- Sacramento County · 1,539,646 people
- City population
- 761,410
- Metro
- Sacramento-Roseville-Folsom, CA
- Population (ZIP)
- 40,677
- Household income
- $68,349
- Rent vs Own
- Severe rent burden
- 1834.0
Population outlook (Sacramento County) Hauer SSP2
- Today (2025)
- 1,660,763 people
- By 2030
- 1,732,990 · +4.3%
- By 2040
- 1,855,755 · +11.7%
- By 2050
- 1,941,335 · +16.9%
- By 2075
- 2,046,162 · +23.2%
- By 2100
- 1,961,444 · +18.1%
Race, ethnicity, and origin ACS 2023
- Neighborhood character
- Highly diverse neighborhood (Simpson 0.77)
- Race & ethnicity
- Hispanic / Latino 37% White 21% Asian 18% Two or more races 15% Black 13% Pacific Islander 2%
- Hispanic origin (detail)
- Mexican 33%
- Common ancestry
- Scotch-Irish 2% Subsaharan African 1% Scottish 1%
- Foreign-born
- 25% · Canada, Vietnam, China
- Languages at home
- 55% English-only · Spanish 22% Other Asian/Pacific 10% Other Indo-European 5%
Political lean MEDSL · Sacramento
- 2024 margin
- D (+19.7) · D 58.1% · R 38.4% · Other 3.5%
- 2008→2024 swing
- +0.7pp no change · 2008: 19.0pp · 2024: 19.7pp
- All cycles
- 2024: D+19.7 2020: D+25.3 2016: D+23.7 2012: D+16.3 2008: D+19.0
Not yet ingested
- Civics
- —
Market trends
- HPI YoY
- ▼ -391.80%
- Current HPI
- 415.1804
- Rent YoY
- ▼ -2.74%
- Metro
- Sacramento-Roseville-Folsom, CA
- State GDP YoY
- ▲ 3.21%
- F500 in state
- 116
Industry mix (Fortune 500 HQ in CA)
| Industry | F500 HQs | Revenue |
|---|---|---|
| Technology | 27 | $1,492B |
|
||
| Financial Services | 3 | $174B |
|
||
| Retail | 3 | $44B |
|
||
| Insurance | 3 | $26B |
|
||
| Media / Entertainment | 2 | $115B |
|
||
| Pharmaceuticals / Biotech | 2 | $62B |
|
||
Property tax history
-2.0%/yrLatest (2025): $211 · -3.4% YoY. Source: county tax records.
Cash-flow waterfall
monthlySold comps — $/sqft
last 12 mo · ≤1 miLoading sold comps…