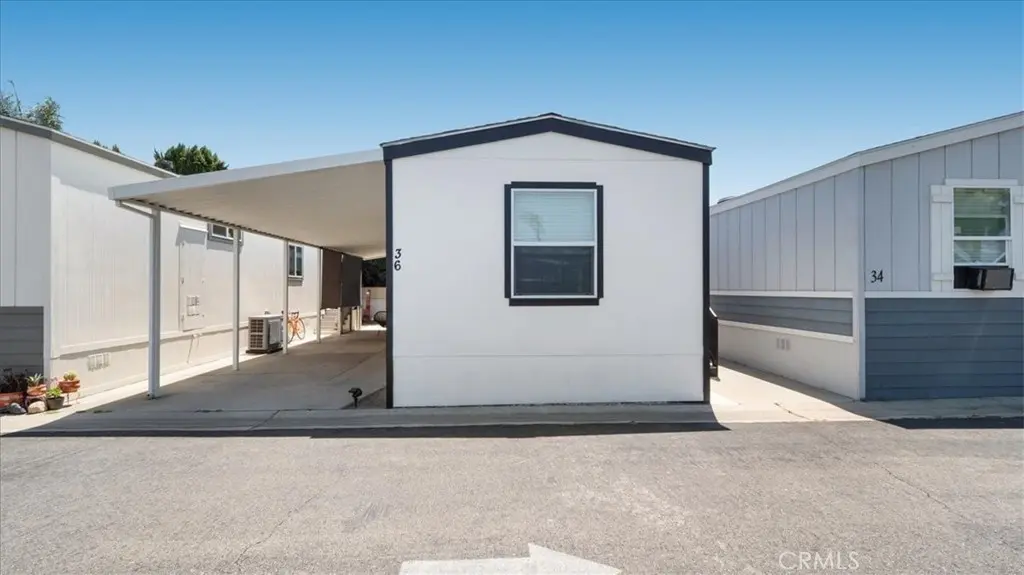
3825 Valley Blvd #36 · Pomona, CA
Flood risk 6/10 · Moderate
- FEMA flood zone
- X (unshaded)
- Chance of flooding over 30 yrs
- 0.71%
- Est. flood insurance / yr
- $507 – $1,088
Fire risk 3/10 · Minor
- Est. fire insurance / yr
- $659 – $1,223
Heat risk 7/10 · Major
- Hot days now (above 99°F)
- 7 days/yr
- Hot days in 30 yrs
- 20 days/yr
Wind risk 1/10 · Minimal
- Chance of severe wind over 30 yrs
- —
Air-quality risk 6/10 · Moderate
- Unhealthy air days now
- 10 days/yr
- Unhealthy air days in 30 yrs
- 13 days/yr
Risk factors via First Street. Map © Google.
Why this score? — see what drove the C+ grade
The composite is a weighted blend of 9 inputs, each scored 0–100. Each bar is that input's sub-score; the figure is the points it added to the 100-point composite (weight × sub-score).
- Cash flow +30.0/30.0
- 1% rule +10.0/10.0
- DSCR +10.0/10.0
- Condition / age +4.0/5.0
- Livability +2.9/5.0
- Rent growth +2.6/5.0
- Schools +2.0/10.0
- ARV discount +0.0/15.0
- Appreciation +0.0/10.0
$117,000
🖨 Deal sheet 📄 Offer letter ✓ Due diligence
Listing remarks MLS
This is a great opportunity for someone looking for a mobile home in turkey condition. The home was built in 2021. It has stainless steel appliances, full size washer and dryer, dishwasher, and a 5-burner stove. Beautiful flooring throughout. It also has granite counter tops, nicely covered carport, and new side fence. There is also a community club house that you can rent for parties plus a community pool. This home is very close to shopping, restaurants, Cal Poly Pomona and Mt. San Antonio College, and freeway close. Seller is motivated and will consider all reasonable offers. Don't let this one get away!!
Key facts
- 5-burner stove
- New side fence
- Granite counter tops
Tags
Neighborhood map
What this means for you Summary
Snapshot
- This is a 2-bed/1.0-bath manufactured listed at $117k. Condition is rated good.
Deal economics
- At list price, monthly cash flow is $2k ($21k/yr) — positive.
- The deal already cash-flows at list — no discount required.
- Meets the 1% rule at list price ($3k rent vs $117k).
- Recommended offer: $103k (12.0% below list) — sets the bar for market timing.
- Cap rate 24.0% vs local median 2.8% in Pomona — top-decile yield for the area; either an underpriced asset or a hidden risk that comps aren't pricing in. Stress-test before assuming the spread holds.
Location & tenants
- Location reads 58/100 on livability (#676 in CA) — a working-class tenant base; expect higher turnover. Strengths: commute A+; Watch: schools D, crime F, amenities F.
- Pomona Unified (suburban): math 12% / reading 31% proficiency, ranked #444 of 517 in CA (top 86%) — low school quality limits family demand, transient renter base, plan for 1-2y turnover; 73% free/reduced lunch — lower-income household profile, screen leases tightly.
- Market conditions: Rents flat; 137 active listings in the ZIP; 1 comparable units currently listed for rent nearby; high-income renter base; 19,697 units permitted in Los Angeles County in 2024 (9,426 in 5+ unit buildings).
Forward outlook
- Local home prices are declining (-3.0%/yr); year-one equity from $809 of loan paydown is wiped out by about $4k of value loss. Plan a longer hold.
- Los Angeles County population projected at +9% by 2050 — modest demand growth; plan on rents tracking national, not racing it.
- At projected returns (-3.0% appreciation + 0.3% rent growth), your $33k cash investment doubles in ~2 years — after that, you're playing with house money.
Negotiation context
- It's been on market 166 days — a 12% lower offer ($103k) is reasonable based on typical stale-listing flexibility.
- 10 sale attempts since 4y ago; this cycle's ask has dropped $13k (10%) from the opening price — seller is motivated, your offer sets the floor, not the list.
Risks & watch-outs
- Climate carrying-cost: major flood risk; extreme-heat days projected 7→20/yr by 2055 (HVAC capex compounding) — expect insurance premiums to compound above CPI over the hold.
Questions for the listing agent
- It's been on market 166 days. Have you received any prior offers? Is the seller open to a 12% concession, seller financing, or rate buy-down credit?
- Why hasn't it sold? Are there any deal-killer items the seller is aware of (foundation, flood, title, zoning, code violations)?
- Is there a deadline driving the sale (1031 exchange, divorce, estate, relocation)? That informs how much negotiation room exists.
- Schools are D-rated, which usually means shorter tenancies and higher turnover. Who's the typical renter profile here, and what's been the actual vacancy rate?
- Crime grade is F in this area — have there been break-ins, vandalism, or insurance claims at this property in the last 3 years? What carrier currently insures it and at what premium?
- What's the average days-on-market for RENTAL listings here right now (not sales)? A rising rental-DOM trend means longer vacancies and softer asking-rent achievability than the comps imply.
- What's the recent tenant-quality profile in this submarket — average credit score on applications, eviction rate, late-payment / NSF rate, and stable-employment percentage? A property-management company in the area should have these aggregated.
- How much new for-sale + rental construction is in the pipeline within 1–3 miles? Heavy new supply typically softens prices + rents 12–24 months out; constrained supply supports both.
Investment metrics
- 1% rule
- 2.66% ✓
- Cap rate
- 24.01%
- Cash-on-cash
- 63.28%
- DSCR
- 3.82
- GRM
- 3.1
CMA / ARV
- ARV (median comp)
- $98,482
- List price
- $117,000
- Delta
- 18.80%
- Verdict
- OVERPRICED
- Comps
- 16 within 1.0 mi
Show comp detail 4 sales within ~0.75 mi
| Address | Dist | Beds/Ba | Sqft | Sold | Price | $/sf | Match |
|---|---|---|---|---|---|---|---|
| 3825 VALLEY Blvd #11 | 0.03mi | 2/1.0 | 660 (-2%) | 8mo | $95,000 | $144 | 89 |
| 3825 Valley Blvd #41 | 0.00mi | 2/1.0 | 672 (0%) | 16mo | $99,800 | $149 | 87 |
| 3825 Valley Blvd #30 | 0.00mi | 2/2.0 | 690 (+3%) | 11mo | $150,000 | $217 | 82 |
| 3825 Valley Blvd #13 | 0.00mi | 3/2.0 (+1) | 720 (+7%) | 20mo | $134,500 | $187 | 62 |
Match score weights: distance 35% · size 25% · config 20% · recency 20%. Top-matched comps best support the ARV.
Projected returns pro-forma
-3.0% appreciation · 0.35% rent growth · sell at horizon
- IRR
- 59.3%
- Equity multiple
- 3.53×
- Total profit
- $82,991
- Equity at exit
- $17,445
- IRR
- 63.2%
- Equity multiple
- 6.57×
- Total profit
- $182,515
- Equity at exit
- $10,116
Cash invested: $32,760 (down + closing). Projections, not guarantees.
Landlord ↔ Tenant lean methodology
- Overall (STATE)
- 18 Strongly Tenant-Friendly
- State California
- 18 Strongly Tenant-Friendly · D+13
- County
- — inherits STATE
- City
- — inherits STATE
ZIP-level market 91789
- Rents YoY
- 0.3%
- Active inventory
- 137
- Price-to-rent
- 3.1×
Monthly cashflow live
- Estimated rent
- $3,108 medium interval (Pro) →
- Mortgage (P&I)
- −$614
- Tax from tax record
- −$65 /mo · $785/yr
- Insurance
- −$49
- HOA
- −$0
- Vacancy / Maint / Mgmt
- −$653
- Net cashflow
- $1,728
Break-even live
UW: 25.0% down · 7.5% · 30yr · 1.5% tax · 5.0% vac · 8.0% maint · 8.0% mgmt
Financing live
Cash to close
- Down payment
- $29,250
- Closing costs
- $3,510
- Reserves months
- —
- Total cash needed
- —
Loan-product check · same deal, 3 products live
Conventional
25% down · 7.5% · 30yr
- Down + closing
- —
- Monthly P&I
- —
- Monthly cashflow
- —
- DSCR
- —
- Eligible?
- —
Personal DTI + credit; lowest rate.
DSCR
20% down · 8.5% · 30yr
- Down + closing
- —
- Monthly P&I
- —
- Monthly cashflow
- —
- DSCR
- —
- Eligible?
- —
No personal income docs; deal must DSCR.
Hard money
10% down · 12.0% · 12mo
- Down + closing
- —
- Monthly P&I
- —
- Monthly cashflow
- —
- DSCR
- —
- Eligible?
- —
Short-term bridge; refi at stabilization.
Rent comps 1 comps
| Address | Beds | Baths | Sqft | Rent | $/sqft | DOM | Units | Dist |
|---|---|---|---|---|---|---|---|---|
| 400 Appian Way Pomona, CA | 2.0 | 1.0–2.0 | 624 | $3,145 | $5.04 | 4d | 1 | 1.29mi |
Listing history 38 events
-
2026-06-18days on market $117,000 Active 166 DOM
-
2026-06-17days on market $117,000 Active 165 DOM
-
2026-06-16days on market $117,000 Active 164 DOM
-
2026-06-15days on market $117,000 Active 163 DOM
-
2026-06-13days on market $117,000 Active 161 DOM
-
2026-06-13days on market $117,000 Active 160 DOM
-
2026-06-09days on market $117,000 Active 157 DOM
-
2026-06-08days on market $117,000 Active 156 DOM
-
2026-06-07days on market $117,000 Active 155 DOM
-
2026-06-04days on market $117,000 Active 152 DOM
-
2026-06-03days on market $117,000 Active 151 DOM
-
2026-06-02days on market $117,000 Active 150 DOM
-
2026-06-01days on market $117,000 Active 149 DOM
-
2026-05-31days on market $117,000 Active 148 DOM
-
2026-01-31price $117,000 615-char remark
Show marketing remark (615 chars)
This is a great opportunity for someone looking for a mobile home in turkey condition. The home was built in 2021. It has stainless steel appliances, full size washer and dryer, dishwasher, and a 5-burner stove. Beautiful flooring throughout. It also has granite counter tops, nicely covered carport, and new side fence. There is also a community club house that you can rent for parties plus a community pool. This home is very close to shopping, restaurants, Cal Poly Pomona and Mt. San Antonio College, and freeway close. Seller is motivated and will consider all reasonable offers. Don't let this one get away!!
-
2026-01-03$129,999 Active 615-char remark
Show marketing remark (615 chars)
This is a great opportunity for someone looking for a mobile home in turkey condition. The home was built in 2021. It has stainless steel appliances, full size washer and dryer, dishwasher, and a 5-burner stove. Beautiful flooring throughout. It also has granite counter tops, nicely covered carport, and new side fence. There is also a community club house that you can rent for parties plus a community pool. This home is very close to shopping, restaurants, Cal Poly Pomona and Mt. San Antonio College, and freeway close. Seller is motivated and will consider all reasonable offers. Don't let this one get away!!
-
2025-12-01historical
-
2025-11-13price $127,000
-
2025-11-12price $127,950
-
2025-10-01price $129,950
-
2025-06-18$139,500 Active
-
2024-05-31historical
-
2024-02-17status Active
-
2024-02-06price $143,000
-
2023-11-10status Active
-
2023-10-06status Active
-
2023-07-07status Pending Sale
-
2023-06-13price $157,500
-
2023-05-09$169,500 Active
-
2022-05-25soldstatus $135,000 Closed Sale
-
2022-05-12status Pending Sale
-
2022-05-02status Active
-
2022-04-22status Pending Sale
-
2022-04-15status Pending Sale
-
2022-04-09status Active
-
2022-03-23status Active
-
2022-03-16status Pending Sale
-
2022-02-09$139,950 Active
ⓘ Source: listings_history table (triggers on properties + properties_extension) + one-shot
backfill from property_details.listing_events for pre-trigger history.
Tax reassessment forecast CA · Resets to sale price
- Current annual tax
- $785 · $65/mo
- Projected year-2 tax
- $889 · $74/mo
- Expected delta
- +$104/yr (+$9/mo · 13.3%)
ⓘ Screening estimate from a state-policy table — verify with the county assessor before closing.
Climate risk First Street
- Flood 6/10 Major FEMA zone X (unshaded) · 71% chance over 30 yrs
- Wildfire 3/10 Moderate
- Heat 7/10 Severe 7 d/yr ≥99°F today · 20 d/yr by 30 yrs out
- Wind 1/10 Low
- Air quality 6/10 Major 10 unhealthy d/yr today · 13 by 30 yrs out
Nearby sold comps map
Loading sold comps map…
Walkable amenities ~0.75 mi
Loading nearby amenities…
Taxation est. · year 1
- Rental income
- $37,295
- − Mortgage interest
- −$6,554
- − Property taxes
- −$785
- − Insurance
- −$585
- − Repairs & maintenance
- −$2,984
- − Management
- −$2,984
- − Depreciation
- −$3,404
- Taxable income
- $20,000
- Est. tax owed @ 24.0%
- −$4,800
- After-tax cash flow
- $15,930/yr
For passive investors: Depreciation is non-cash, so a rental often shows a tax loss while cash-flowing — sheltering income. Rental losses are passive: they offset passive income freely, and up to $25,000/yr can offset ordinary (W-2) income if you actively participate and your MAGI is under $100k (phasing out to $0 by $150k); unused losses carry forward. On sale, claimed depreciation is recaptured at up to 25%, and gains may owe capital-gains tax (a 1031 exchange can defer both). Figures are a year-1 estimate at your 24.0% rate — not tax advice; consult a CPA.
Condition & rehab AI · 1 photo
This 2021 manufactured home is in excellent condition with stainless steel appliances and beautiful flooring. Minor cosmetic updates could further enhance its curb appeal and value.
Value-add opportunities
- Both Paint exterior and interior — Enhances curb appeal and interior aesthetics
- Both Replace carport roof if damaged — Improves durability and appearance
- Both Install new side fence if damaged — Enhances privacy and security
- Resale Upgrade appliances if outdated — Attracts more buyers with modern features
Renovation cost estimate screening
Value-add ROI direction
- Both Paint exterior and interior — Enhances curb appeal and interior aesthetics ↑
- Both Replace carport roof if damaged — Improves durability and appearance ↑
- Both Install new side fence if damaged — Enhances privacy and security ↑
- Resale Upgrade appliances if outdated — Attracts more buyers with modern features ↑
ⓘ Cost ranges are severity-bucket heuristics (US national rule-of-thumb). Get contractor quotes + a written scope before underwriting a rehab budget.
Schools (NCES district)
- District
- Pomona Unified
- NCES district ID
- 0631320
- Math proficiency
- 12% ▼ -15.00%
- Reading proficiency
- 31% ▼ -10.00%
- Median HH income
- $54,839
- Composite
- 19.54/100
- National rank
- #8761
- State rank
- #444 of 517 in CA
Livability — Pomona
- Score
- 58/100
- State rank
- #676
- US rank
- #20782
Category grades
Schools grade is shown separately in the Schools card above.
Census & demographics
- Census place
- Pomona, CA
- County
- Los Angeles County · 9,444,647 people
- City population
- 152,679
- Metro
- Los Angeles-Long Beach-Anaheim, CA
- Population (ZIP)
- 40,298
- Household income
- $125,720
- Rent vs Own
- Severe rent burden
- 603.0
Population outlook (Los Angeles County) Hauer SSP2
- Today (2025)
- 10,940,515 people
- By 2030
- 11,256,481 · +2.9%
- By 2040
- 11,729,929 · +7.2%
- By 2050
- 11,948,407 · +9.2%
- By 2075
- 11,818,114 · +8.0%
- By 2100
- 10,842,928 · -0.9%
Race, ethnicity, and origin ACS 2023
- Neighborhood character
- Predominantly Asian (67%)
- Race & ethnicity
- Asian 67% Hispanic / Latino 18% White 9% Two or more races 7% Black 2%
- Hispanic origin (detail)
- Mexican 15%
- Foreign-born
- 51% · China, South Korea, Canada
- Languages at home
- 33% English-only · Chinese 38% Spanish 9% Tagalog/Filipino 6%
Political lean MEDSL · Los Angeles
- 2024 margin
- Solid D (+32.9) · D 64.8% · R 31.9% · Other 3.3%
- 2008→2024 swing
- -7.4pp toward R · 2008: 40.4pp · 2024: 32.9pp
- All cycles
- 2024: D+32.9 2020: D+44.2 2016: D+48.0 2012: D+40.0 2008: D+40.4
Not yet ingested
- Civics
- —
Market trends
- HPI YoY
- ▼ -884.62%
- Current HPI
- 368.0775
- Rent YoY
- ▲ 0.35%
- Metro
- Los Angeles-Long Beach-Anaheim, CA
- State GDP YoY
- ▲ 3.21%
- F500 in state
- 116
Industry mix (Fortune 500 HQ in CA)
| Industry | F500 HQs | Revenue |
|---|---|---|
| Technology | 27 | $1,492B |
|
||
| Financial Services | 3 | $174B |
|
||
| Retail | 3 | $44B |
|
||
| Insurance | 3 | $26B |
|
||
| Media / Entertainment | 2 | $115B |
|
||
| Pharmaceuticals / Biotech | 2 | $62B |
|
||
Price history
-16.4% since first listed24 events — show timeline
- 2026-01-31 Price Changed $117,000 CRMLS
- 2026-01-03 Listed $129,999 CRMLS
- 2025-12-01 Listing Removed — CRMLS
- 2025-11-13 Price Changed $127,000 CRMLS
- 2025-11-12 Price Changed $127,950 CRMLS
- 2025-10-01 Price Changed $129,950 CRMLS
- 2025-06-18 Listed $139,500 CRMLS
- 2024-05-31 Listing Removed — CRMLS
- 2024-02-17 Relisted — CRMLS
- 2024-02-06 Price Changed $143,000 CRMLS
- 2023-11-10 Relisted — CRMLS
- 2023-10-06 Relisted — CRMLS
- 2023-07-07 Pending — CRMLS
- 2023-06-13 Price Changed $157,500 CRMLS
- 2023-05-09 Listed $169,500 CRMLS
- 2022-05-25 Sold (MLS) $135,000 CRMLS
- 2022-05-12 Pending — CRMLS
- 2022-05-02 Relisted — CRMLS
- 2022-04-22 Pending — CRMLS
- 2022-04-15 Pending — CRMLS
- 2022-04-09 Relisted — CRMLS
- 2022-03-23 Relisted — CRMLS
- 2022-03-16 Pending — CRMLS
- 2022-02-09 Listed $139,950 CRMLS
Property tax history
+6.4%/yrLatest (2025): $785 · +6.4% YoY. Source: county tax records.
Cash-flow waterfall
monthlySold comps — $/sqft
last 12 mo · ≤1 miLoading sold comps…