435 E 65th St Unit 6E · New York, NY
Flood risk 4/10 · Minor
- FEMA flood zone
- X (unshaded)
- Chance of flooding over 30 yrs
- 0.24%
- Est. flood insurance / yr
- $507 – $1,088
Fire risk 1/10 · Minimal
- Est. fire insurance / yr
- $691 – $1,283
Heat risk 6/10 · Moderate
- Hot days now (above 99°F)
- 7 days/yr
- Hot days in 30 yrs
- 15 days/yr
Wind risk 6/10 · Moderate
- Chance of severe wind over 30 yrs
- 27.0%
Air-quality risk 4/10 · Minor
- Unhealthy air days now
- 5 days/yr
- Unhealthy air days in 30 yrs
- 6 days/yr
Risk factors via First Street. Map © Google.
Why this score? — see what drove the D+ grade
The composite is a weighted blend of 9 inputs, each scored 0–100. Each bar is that input's sub-score; the figure is the points it added to the 100-point composite (weight × sub-score).
- Appreciation +7.9/10.0
- Cash flow +7.5/30.0
- ARV discount +7.5/15.0
- 1% rule +5.8/10.0
- Rent growth +5.0/5.0
- Schools +5.0/10.0
- Livability +3.8/5.0
- Condition / age +3.8/5.0
- DSCR +1.6/10.0
$549,000
🖨 Deal sheet (PDF) 📄 Offer letter ✓ Due diligence
Listing remarks
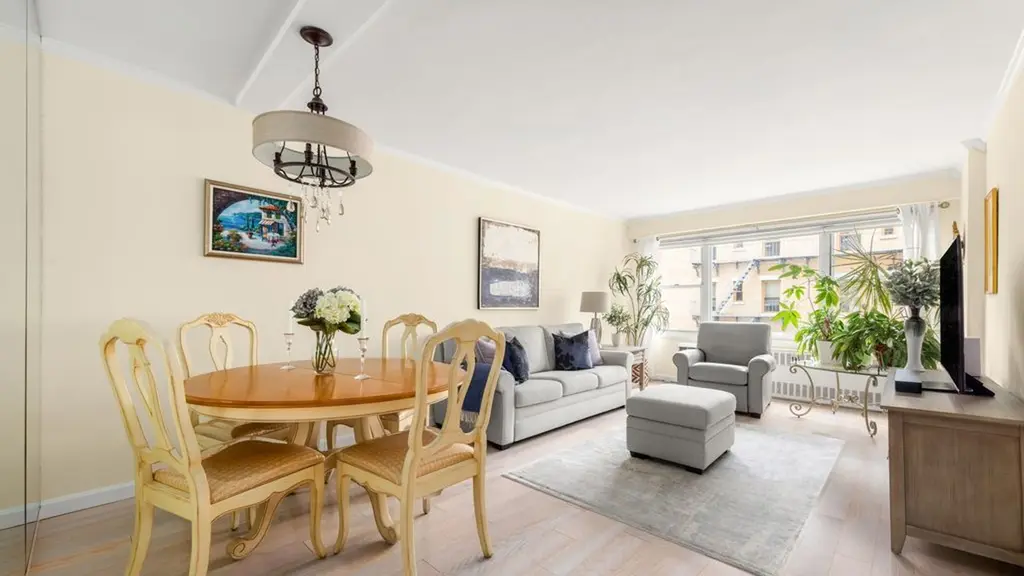
Welcome to Residence 6E at 435 East 65th Street-a beautifully updated, south-facing one-bedroom in a full-service Lenox Hill cooperative. Large windows flood the home with natural light throughout the day. The layout is spacious and efficient, featuring a generously sized living and dining area ideal for both everyday living and entertaining. The dining area is enhanced by a beam ceiling with integrated lighting, adding brightness while preserving ceiling height. The king-sized bedroom is exceptionally spacious, easily accommodating additional furniture-a rare feature at this price point. Multiple oversized closets provide excellent storage throughout. The kitchen is outfitted with stainl
Key facts
- Large windows
- Integrated lighting
- Beam ceiling
Tags
Property features AI
Finance
- Other: Building contains 119 total units; Pets allowed in building
- HOA & community: Monthly association fee of $1,572
Exterior
- Parking: Has garage
- Utilities: Has view
- Home design: High-rise building with 13 stories; Entry level listed as 6
- Construction: Building amenities include storage and bike storage
- Exterior features: Building courtyard; Building roof deck
Interior
- Bedrooms: Entry level is 6
- Bathrooms: 1 full bathroom
- Interior features: Total of 3 rooms; Basement described as 'Other'; Building has storage and bike storage; Has a view
- Laundry & utility: Laundry located in building basement; Washer and dryer allowed
Neighborhood map
What this means for you Summary
Snapshot
- This is a 1-bed/1.0-bath condo listed at $549k. Condition is rated good.
Deal economics
- At list price, monthly cash flow is $-680 ($-8k/yr) — negative.
- To cash-flow at today's rent, offer at most $451k (17.9% below list).
- Meets the 1% rule at list price ($6k rent vs $549k).
- Recommended offer: $451k (17.9% below list) — sets the bar for cash-flow.
- Cap rate 4.8% vs local median 2.6% in New York — top-decile yield for the area; either an underpriced asset or a hidden risk that comps aren't pricing in. Stress-test before assuming the spread holds.
Location & tenants
- Location reads 75/100 on livability (#268 in NY, #4,188 nationally) — a middle-class / working-renter tenant base. Strengths: amenities A+, commute A+, health & safety A; Watch: crime F, cost of living F.
- Zoned schools: Elm Tree Elementary School (math 27% / reading 52%, grade F, #1,444 of 2,108 statewide, top 71%, 806 students, 94% FRL); Mark Twain Is 239 For The Gifted And Talented (math 90% / reading 96%, grade A+, #6 of 729 statewide, top 1%, 1,207 students, 44% FRL); Midwood High School (math 94% / reading 96%, grade A+, #83 of 1,100 statewide, top 8%, 4,062 students, 73% FRL).
- Market conditions: Rents rising fast (+11.6%/yr); 344 active listings in the ZIP; 40 comparable units currently listed for rent nearby; rentals at typical pace (median 17d on market — plan ~3-4 weeks tenant-placement turnaround); high-income renter base; 4,467 units permitted in New York County in 2024 (4,463 in 5+ unit buildings).
- At $5,931/mo this rent would consume 46% of the median local household income ($155k/yr) (locally 2355% of renters already pay >50% of income on rent) — very limited rent-growth headroom before tenants either downsize or default.
Forward outlook
- In year one you build about $36k of equity ($4k loan paydown + $32k appreciation (5.8% local appreciation)).
- New York County population projected at +21% by 2050 — long-run rental-demand tailwind backs the buy-and-hold thesis.
- By year 2, paydown + projected appreciation supports a ~$57k cash-out refi (75% LTV) — recoverable capital for the next deal without selling this one.
Negotiation context
- It's been on market 46 days — a 3% lower offer ($533k) is reasonable based on typical stale-listing flexibility.
- 3 sale attempts since 2y ago with the ask held roughly flat each time — persistent listings suggest the price (not the market) is what's stuck; bring a comps-based counter.
Risks & watch-outs
- Watch-outs: HOA is 27% of rent.
- Climate carrying-cost: major wind risk, 27% chance of damaging wind over 30y; extreme-heat days projected 7→15/yr by 2055 (HVAC capex compounding) — expect insurance premiums to compound above CPI over the hold.
Questions for the listing agent
- What do current leases actually rent for vs. the listed asking? Can we see a recent rent roll and the last 12 months of T-12 income?
- It's been on market 46 days. Have you received any prior offers? Is the seller open to a 18% concession, seller financing, or rate buy-down credit?
- Built in 1963 — when were the roof, HVAC, electrical panel, plumbing, and water heater last replaced?
- What does the HOA fee cover, when was the last increase, and are there any pending special assessments or reserve-fund shortfalls?
- Any open or pending special assessments — roof, HVAC, plumbing, elevator, façade? What's the per-unit balance and payoff schedule, and is the seller paying it off at close or rolling it to the buyer?
- Is there a deadline driving the sale (1031 exchange, divorce, estate, relocation)? That informs how much negotiation room exists.
- Schools are B-rated — typically a magnet for longer-tenancy family renters. What's the average tenant stay here, and is there a school-zone premium baked into asking?
- Crime grade is F in this area — have there been break-ins, vandalism, or insurance claims at this property in the last 3 years? What carrier currently insures it and at what premium?
- The area grade is low — what's the realistic commute time and amenity access for the typical tenant pool here? Any planned neighborhood developments (good or bad) we should know about?
- What's the average days-on-market for RENTAL listings here right now (not sales)? A rising rental-DOM trend means longer vacancies and softer asking-rent achievability than the comps imply.
- What's the recent tenant-quality profile in this submarket — average credit score on applications, eviction rate, late-payment / NSF rate, and stable-employment percentage? A property-management company in the area should have these aggregated.
- How much new apartment / multifamily construction is in the pipeline within 1–3 miles? Heavy new supply (>2% of stock underway) typically softens rents 12–24 months out; light construction supports rent growth.
Investment metrics
- 1% rule
- 1.08% ✓
- Cap rate
- 4.81%
- Cash-on-cash
- -5.31%
- DSCR
- 0.76
- GRM
- 7.7
CMA / ARV
No comps found within radius.
Projected returns pro-forma
5.79% appreciation · 8.0% rent growth · sell at horizon
- IRR
- 13.4%
- Equity multiple
- 1.92×
- Total profit
- $140,828
- Equity at exit
- $337,929
- IRR
- 16.4%
- Equity multiple
- 4.45×
- Total profit
- $529,885
- Equity at exit
- $606,701
Cash invested: $153,720 (down + closing). Projections, not guarantees.
Landlord ↔ Tenant lean methodology
- Overall (CITY)
- 0 Strongly Tenant-Friendly
- State New York
- 15 Strongly Tenant-Friendly · D+10
- County
- — inherits STATE
- City New York
- 0 Strongly Tenant-Friendly · D+34
ZIP-level market 10065
- Home prices YoY
- 3.1%
- Rents YoY
- 11.6%
- Active inventory
- 344
- Price-to-rent
- 7.7×
Monthly cashflow live
- Estimated rent
- $5,931 high interval (Pro) →
- Mortgage (P&I)
- −$2,879
- Tax est. 1.5%
- −$686 /mo · $8,235/yr
- Insurance
- −$229
- HOA
- −$1,572
- Vacancy / Maint / Mgmt
- −$1,246
- Net cashflow
- $-680
Break-even live
Sensitivity live
| Price | -10% $-301 | -5% $-490 | +0% $-680 | +5% $-870 | +10% $-1,060 |
|---|---|---|---|---|---|
| Rent | -10% $-1,149 | -5% $-914 | +0% $-680 | +5% $-446 | +10% $-212 |
| Rate | -1.0pp $-404 | -0.5pp $-541 | base $-680 | +0.5pp $-822 | +1.0pp $-967 |
UW: 25.0% down · 7.5% · 30yr · 1.5% tax · 5.0% vac · 8.0% maint · 8.0% mgmt
Financing live
Cash to close
- Down payment
- $137,250
- Closing costs
- $16,470
- Reserves months
- —
- Total cash needed
- —
Loan-product check · same deal, 3 products live
Conventional
25% down · 7.5% · 30yr
- Down + closing
- —
- Monthly P&I
- —
- Monthly cashflow
- —
- DSCR
- —
- Eligible?
- —
Personal DTI + credit; lowest rate.
DSCR
20% down · 8.5% · 30yr
- Down + closing
- —
- Monthly P&I
- —
- Monthly cashflow
- —
- DSCR
- —
- Eligible?
- —
No personal income docs; deal must DSCR.
Hard money
10% down · 12.0% · 12mo
- Down + closing
- —
- Monthly P&I
- —
- Monthly cashflow
- —
- DSCR
- —
- Eligible?
- —
Short-term bridge; refi at stabilization.
Rent comps 40 comps
| Address | Beds | Baths | Sqft | Rent | $/sqft | DOM | Units | Dist |
|---|---|---|---|---|---|---|---|---|
| 400 E 66th St Unit 1016404P New York, NY | 1.0–2.0 | 1.0–2.0 | 791 | $10,597 | $13.40 | 5d | 2 | 0.10mi |
| 360 E 65th St #1283 New York, NY | 1.0–3.0 | 1.0–2.0 | 1059 | $4,840 | $4.57 | 5d | 3 | 0.13mi |
| 360 E 65th St New York, NY | 2.0–3.0 | 2.0–2.5 | — | $7,295 | — | 26d | 5 | 0.14mi |
| 411 E 68th St Unit 1021976P New York, NY | 2.0 | 1.0 | 893 | $6,792 | $7.61 | 24d | 1 | 0.16mi |
| 1270 1st Ave Unit 3B New York, NY | 2.0 | 1.0 | — | $4,995 | — | 1d | 1 | 0.16mi |
| 1270 1st Ave New York, NY | 2.0 | 1.0 | — | $4,995 | — | 0d | 1 | 0.16mi |
| 406 E 63rd St Unit 14 New York, NY | 2.0 | 1.0 | — | $6,000 | — | 21d | 1 | 0.17mi |
| 403 E 62nd St Unit 14C New York, NY | 1.0 | 1.0 | 650 | $4,900 | $7.54 | 24d | 1 | 0.19mi |
| 403 E 69th St #1518 New York, NY | 1.0–3.0 | 1.0 | 745 | $3,990 | $5.36 | 26d | 3 | 0.20mi |
| 1288 1st Ave Unit 4A New York, NY | 2.0 | 1.0 | — | $4,500 | — | 12d | 1 | 0.21mi |
| 1290 1st Ave #1499 New York, NY | 2.0 | 1.0 | 671 | $6,100 | $9.09 | 4d | 2 | 0.21mi |
| 332 E 63rd St Unit 3K New York, NY | 2.0 | 1.0 | — | $6,000 | — | 7d | 1 | 0.23mi |
| 1293 1st Ave New York, NY | 2.0 | 1.0 | — | $4,595 | — | 13d | 1 | 0.23mi |
| 1293 1st Ave New York, NY | 2.0 | 1.0 | — | $4,795 | — | 0d | 1 | 0.23mi |
| 301 E 66th St Unit 14I New York, NY | 1.0 | 1.0 | — | $6,000 | — | 26d | 1 | 0.23mi |
| 301 E 66th St Unit 10H New York, NY | 1.0 | 1.0 | — | $6,200 | — | 4d | 1 | 0.24mi |
| 304 E 65th St Unit 11C New York, NY | 1.0 | 1.0 | 770 | $5,450 | $7.08 | 17d | 1 | 0.24mi |
| 420 E 61st St Unit 30A New York, NY | — | 1.0 | — | $4,500 | — | 12d | 1 | 0.25mi |
| 420 E 61st St Unit 32F New York, NY | 1.0 | 1.5 | — | $6,500 | — | 26d | 1 | 0.25mi |
| 420 E 61st St Unit 1330815P New York, NY | 2.0–3.0 | 2.0–3.0 | 1490 | $11,424 | $7.67 | 1d | 2 | 0.25mi |
| 301 E 63rd St New York, NY | 2.0 | 1.0 | 975 | $6,650 | $6.82 | 6d | 1 | 0.27mi |
| 1107 1st Ave Unit 1328954P New York, NY | 1.0 | 1.0 | — | $4,968 | — | 17d | 1 | 0.28mi |
| 300 E 69th St Unit 1294661P New York, NY | 2.0 | 1.0 | 839 | $6,870 | $8.19 | 22d | 1 | 0.29mi |
| 1310 2nd Ave Unit 1224958P New York, NY | 1.0–2.0 | 1.0 | 699 | $5,450 | $7.80 | 3d | 2 | 0.29mi |
| 405 E 71st St Unit 18F New York, NY | 1.0 | 1.0 | — | $5,100 | — | 21d | 1 | 0.29mi |
| 405 E 71st St Unit 7A New York, NY | 1.0 | 1.0 | — | $5,500 | — | 21d | 1 | 0.29mi |
| 220 E 65th St New York, NY | 1.0 | 1.0 | — | $6,200 | — | 1d | 1 | 0.31mi |
| 220 E 65th St New York, NY | 1.0 | 1.0 | 700 | $5,950 | $8.50 | 4d | 1 | 0.31mi |
| 220 E 65th St Unit PHA New York, NY | 1.0 | 1.0 | — | $5,700 | — | 1d | 1 | 0.31mi |
| 515 E 72nd St Unit 17D New York, NY | 1.0 | 1.0 | 687 | $5,500 | $8.01 | 26d | 1 | 0.34mi |
| 225 E 63rd St #1675 New York, NY | 1.0 | 1.0 | 627 | $5,230 | $8.34 | 26d | 2 | 0.34mi |
| 525 E 72nd St Unit 6I New York, NY | 2.0 | 2.0 | — | $6,500 | — | 26d | 1 | 0.35mi |
| 233 E 70th St Unit 3S New York, NY | 2.0 | 1.0 | — | $6,200 | — | 26d | 1 | 0.36mi |
| 220 E 63rd St #567 New York, NY | 1.0 | 1.0 | 800 | $6,460 | $8.07 | 22d | 1 | 0.36mi |
| 425 Main St Unit 4F New York, NY | 2.0 | 2.0 | — | $6,250 | — | 26d | 1 | 0.37mi |
| 252 E 61st St #638 New York, NY | 1.0 | 1.0 | 666 | $5,530 | $8.30 | 3d | 2 | 0.37mi |
| 345 E 72nd St New York, NY | 2.0 | 1.0 | — | $5,395 | — | 26d | 1 | 0.37mi |
| 200 E 69th St New York, NY | 2.0 | 2.5 | — | $20,000 | — | 26d | 1 | 0.38mi |
| 200 E 69th St New York, NY | 2.0–3.0 | 2.5–3.5 | 1958 | $19,950 | $10.19 | 4d | 2 | 0.38mi |
| 525 E 72nd St Unit 22J New York, NY | 1.0 | 1.0 | — | $6,100 | — | 26d | 1 | 0.39mi |
HOA detail condo
- Monthly dues
- $1,572 · $18,864/yr
- Assessments
- None detected in remarks — confirm with the listing agent.
Listing history 17 events
-
2026-06-18days on market $549,000 Active 46 DOM
-
2026-06-17days on market $549,000 Active 45 DOM
-
2026-06-16days on market $549,000 Active 44 DOM
-
2026-06-15days on market $549,000 Active 43 DOM
-
2026-06-13days on market $549,000 Active 41 DOM
-
2026-06-10days on market $549,000 Active 37 DOM
-
2026-06-08days on market $549,000 Active 36 DOM
-
2026-06-08days on market $549,000 Active 35 DOM
-
2026-06-04days on market $549,000 Active 32 DOM
-
2026-06-03days on market $549,000 Active 31 DOM
-
2026-06-01days on market $549,000 Active 29 DOM
-
2026-05-31days on market $549,000 Active 28 DOM
-
2026-05-03$549,000 Active
-
2024-12-12historical $3,400
-
2024-12-11$3,400
-
2024-11-09historical $3,100
-
2024-11-08$3,100
ⓘ Source: listings_history table (triggers on properties + properties_extension) + one-shot
backfill from property_details.listing_events for pre-trigger history.
Climate risk First Street
- Flood 4/10 Moderate FEMA zone X (unshaded) · 24% chance over 30 yrs
- Wildfire 1/10 Low
- Heat 6/10 Major 7 d/yr ≥99°F today · 15 d/yr by 30 yrs out
- Wind 6/10 Major 27% chance of damaging wind over 30 yrs
- Air quality 4/10 Moderate 5 unhealthy d/yr today · 6 by 30 yrs out
Nearby sold comps map
Loading sold comps map…
Walkable amenities ~0.75 mi
Loading nearby amenities…
Taxation est. · year 1
- Rental income
- $71,178
- − Mortgage interest
- −$30,753
- − Property taxes
- −$8,235
- − Insurance
- −$2,745
- − Repairs & maintenance
- −$5,694
- − Management
- −$5,694
- − HOA
- −$18,864
- − Depreciation
- −$15,971
- Taxable loss
- −$16,778
- Est. tax savings @ 24.0%
- +$4,027
- After-tax cash flow
- $-4,135/yr
For passive investors: Depreciation is non-cash, so a rental often shows a tax loss while cash-flowing — sheltering income. Rental losses are passive: they offset passive income freely, and up to $25,000/yr can offset ordinary (W-2) income if you actively participate and your MAGI is under $100k (phasing out to $0 by $150k); unused losses carry forward. On sale, claimed depreciation is recaptured at up to 25%, and gains may owe capital-gains tax (a 1031 exchange can defer both). Figures are a year-1 estimate at your 24.0% rate — not tax advice; consult a CPA.
Condition & rehab AI · 7 photos
This one-bedroom apartment is in good condition with a good layout and ample natural light. It has a good kitchen and bathroom, and the interior walls and flooring are in good condition. The property has potential for further value increases through exterior painting and landscaping, as well as kitchen and bathroom updates.
Value-add opportunities
- Both Painting the exterior — Enhances curb appeal and property value.
- Both Landscaping the front yard — Improves curb appeal and enhances property value.
- Resale Updating the kitchen backsplash — Modernizes the kitchen and adds value.
- Resale Upgrading the bathroom fixtures — Enhances the bathroom's aesthetic and functionality.
Renovation cost estimate screening
Value-add ROI direction
- Both Painting the exterior — Enhances curb appeal and property value. ↑
- Both Landscaping the front yard — Improves curb appeal and enhances property value. ↑
- Resale Updating the kitchen backsplash — Modernizes the kitchen and adds value. ↑
- Resale Upgrading the bathroom fixtures — Enhances the bathroom's aesthetic and functionality. ↑
ⓘ Cost ranges are severity-bucket heuristics (US national rule-of-thumb). Get contractor quotes + a written scope before underwriting a rehab budget.
Schools (NCES district)
No district data.
Livability — New York
- Score
- 75/100
- State rank
- #268
- US rank
- #4188
Category grades
Schools grade is shown separately in the Schools card above.
Census & demographics
- Census place
- New York, NY
- County
- New York County · 1,599,927 people
- City population
- 7,731,280
- Metro
- New York-Newark-Jersey City, NY-NJ-PA
- Population (ZIP)
- 30,808
- Household income
- $155,331
- Rent vs Own
- Severe rent burden
- 2355.0
Population outlook (New York County) Hauer SSP2
- Today (2025)
- 1,825,725 people
- By 2030
- 1,904,611 · +4.3%
- By 2040
- 2,052,719 · +12.4%
- By 2050
- 2,206,601 · +20.9%
- By 2075
- 2,509,427 · +37.4%
- By 2100
- 2,702,933 · +48.0%
Race, ethnicity, and origin ACS 2023
- Neighborhood character
- Predominantly White (71%)
- Race & ethnicity
- White 71% Asian 13% Hispanic / Latino 10% Two or more races 6% Black 2%
- Hispanic origin (detail)
- Mexican 2% Dominican 1% Salvadoran 2%
- Common ancestry
- Scotch-Irish 6% Romanian 5% Lithuanian 3%
- Foreign-born
- 28% · Canada, China, Dominican Republic
- Languages at home
- 70% English-only · Spanish 8% Other Indo-European 6% Other Asian/Pacific 3%
Political lean MEDSL · New York
- 2024 margin
- Solid D (+64.8) · D 82.4% · R 17.6%
- 2008→2024 swing
- -7.4pp toward R · 2008: 72.2pp · 2024: 64.8pp
- All cycles
- 2024: D+64.8 2020: D+74.5 2016: D+77.2 2012: D+69.6 2008: D+72.2
Not yet ingested
- Civics
- —
Market trends
- HPI YoY
- ▲ 5.79%
- Current HPI
- 194.3314
- Rent YoY
- ▲ 11.63%
- Metro
- New York-Newark-Jersey City, NY-NJ-PA
- State GDP YoY
- ▲ 2.60%
- F500 in state
- 92
Industry mix (Fortune 500 HQ in NY)
| Industry | F500 HQs | Revenue |
|---|---|---|
| Financial Services | 10 | $950B |
|
||
| Consumer Goods | 9 | $162B |
|
||
| Insurance | 4 | $225B |
|
||
| Telecommunications | 2 | $144B |
|
||
| Pharmaceuticals | 2 | $112B |
|
||
| Media / Entertainment | 2 | $69B |
|
||
Price history
+17609.7% since first listed5 events — show timeline
- 2026-05-03 Listed $549,000 RLS at REBNY
- 2024-12-12 Rental Removed $3,400 REALTYMX
- 2024-12-11 Listed for Rent $3,400 REALTYMX
- 2024-11-09 Rental Removed $3,100 REALTYMX
- 2024-11-08 Listed for Rent $3,100 REALTYMX
Cash-flow waterfall
monthlySold comps — $/sqft
last 12 mo · ≤1 miLoading sold comps…