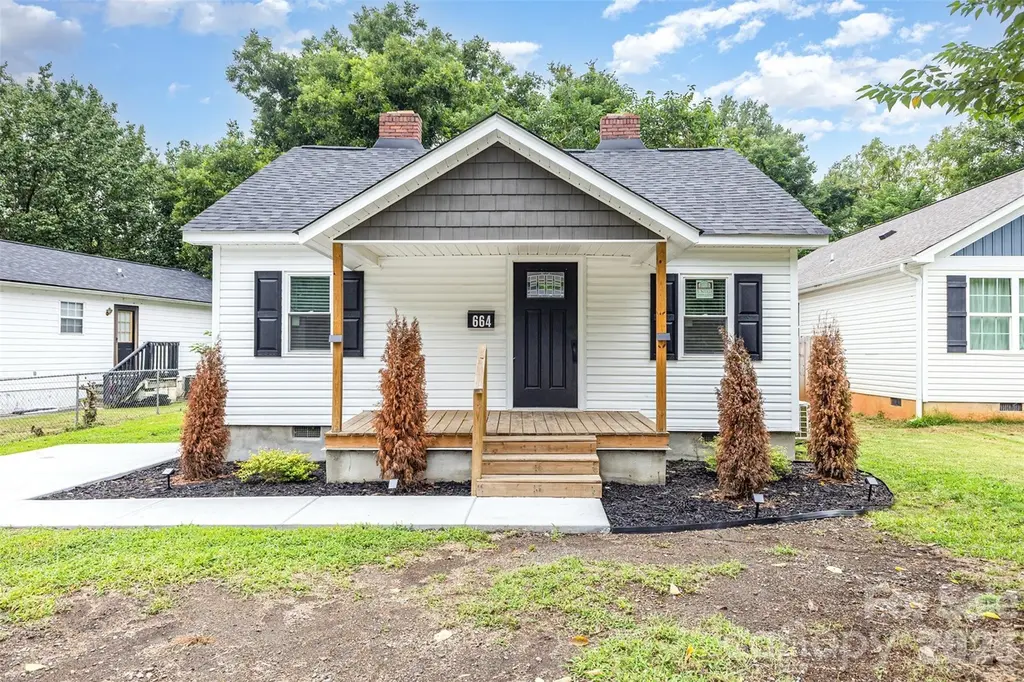
664 Simpson St · Rock Hill, SC
Flood risk 1/10 · Minimal
- FEMA flood zone
- X (unshaded)
- Chance of flooding over 30 yrs
- 0.0%
- Est. flood insurance / yr
- $507 – $1,088
Fire risk 3/10 · Minor
- Est. fire insurance / yr
- $783 – $1,453
Heat risk 6/10 · Moderate
- Hot days now (above 105°F)
- 7 days/yr
- Hot days in 30 yrs
- 16 days/yr
Wind risk 6/10 · Moderate
- Chance of severe wind over 30 yrs
- 27.0%
Air-quality risk 3/10 · Minor
- Unhealthy air days now
- 2 days/yr
- Unhealthy air days in 30 yrs
- 3 days/yr
Risk factors via First Street. Map © Google.
Why this score? — see what drove the D- grade
The composite is a weighted blend of 9 inputs, each scored 0–100. Each bar is that input's sub-score; the figure is the points it added to the 100-point composite (weight × sub-score).
- Cash flow +12.0/30.0
- ARV discount +5.7/15.0
- Rent growth +3.9/5.0
- 1% rule +3.5/10.0
- DSCR +3.5/10.0
- Schools +3.5/10.0
- Livability +3.5/5.0
- Condition / age +2.5/5.0
- Appreciation +0.0/10.0
$179,000
🖨 Deal sheet 📄 Offer letter ✓ Due diligence
Listing remarks
Move-in-ready ranch minutes from downtown Rock Hill, featuring a private, wooded lot and a peaceful backyard setting. Inside, you’ll find a functional layout with LVP flooring throughout and an upgraded kitchen featuring modern countertops and a brand-new refrigerator. Fresh neutral paint adds a clean, modern touch. Major updates in 2025 include new vinyl siding and windows, a new roof with a 25-year warranty, new HVAC, new water heater, and a new LG washer/dryer set—all providing style, efficiency, and peace of mind. Perfect for first-time buyers, investors, or anyone looking to downsize, this home offers easy access to shopping, dining, and major commuter routes. Don’t m
Key facts
- 7,405 sq ft lot
- Built 1950
- Listed 77 days
Property features AI
Finance
- Other: Lot on publicly maintained paved concrete road (0.17 acre)
- HOA & community: No HOA
Exterior
- Parking: Driveway; 1 open parking space
- Utilities: City water; Public sewer
- Home design: Single-family residence; One level; Site-built construction; Slab foundation
- Construction: Vinyl exterior
- Exterior features: Covered front porch
Interior
- Kitchen: Electric range; Refrigerator
- Bedrooms: 2 bedrooms (both on the main level)
- Flooring: Vinyl flooring
- Bathrooms: 1 full bathroom (main level)
- Heating & cooling: Ductless heating (electric); Ductless cooling
- Interior features: Open floorplan; 6 total rooms
- Laundry & utility: Washer/Dryer included; Laundry closet
Neighborhood map
What this means for you Summary
Snapshot
- This is a 2-bed/1.0-bath single-family listed at $179k.
Deal economics
- At list price, monthly cash flow is $-44 ($-522/yr) — negative.
- To cash-flow at today's rent, offer at most $171k (4.3% below list).
- To meet the 1% rule (rent ≥ 1% of price), the offer needs to be $152k (15.3% below list).
- Recommended offer: $152k (15.3% below list) — sets the bar for 1% rule.
- Cap rate 6.0% vs local median 3.4% in Rock Hill — top-decile yield for the area; either an underpriced asset or a hidden risk that comps aren't pricing in. Stress-test before assuming the spread holds.
Location & tenants
- Location reads 70/100 on livability (#62 in SC) — a middle-class / working-renter tenant base. Strengths: cost of living A+, housing A+, health & safety A+; Watch: employment D+, crime D-, amenities D-.
- York 03 (urban): math 36% / reading 47% proficiency, ranked #32 of 80 in SC (top 40%) — families likely to look elsewhere, expect single-tenant / working-renter base with shorter leases.
- Zoned schools: Sunset Park Center For Accelerated Studies (math 47% / reading 42%, grade F, #226 of 597 statewide, top 40%, 491 students, 100% FRL); Northwestern High (math 35% / reading 84%, grade C+, #110 of 196 statewide, top 58%, 1,774 students, 52% FRL) — zoned schools average 76% FRL vs 49% district-wide (26 pts higher); higher-poverty schools than district average — tighter screening recommended.
- Market conditions: Rents rising fast (+5.5%/yr); 348 active listings in the ZIP; 24 comparable units currently listed for rent nearby; rentals at typical pace (median 15d on market — plan ~3-4 weeks tenant-placement turnaround); 2,550 units permitted in York County in 2024 (350 in 5+ unit buildings).
Forward outlook
- Local home prices are declining (-3.0%/yr); year-one equity from $1k of loan paydown is wiped out by about $5k of value loss. Plan a longer hold.
- York County population projected at +44% by 2050 — long-run rental-demand tailwind backs the buy-and-hold thesis.
Negotiation context
- It's been on market 77 days — a 6% lower offer ($168k) is reasonable based on typical stale-listing flexibility.
- 2 sale attempts with the ask held roughly flat each time — persistent listings suggest the price (not the market) is what's stuck; bring a comps-based counter.
- Current owner paid $111k; list at $179k implies a 61% gain — meaningful room to come down on a strong offer.
Risks & watch-outs
- Watch-outs: built in 1950 — expect roof / HVAC / electrical / plumbing capex.
- Climate carrying-cost: major wind risk, 27% chance of damaging wind over 30y; extreme-heat days projected 7→16/yr by 2055 (HVAC capex compounding) — expect insurance premiums to compound above CPI over the hold.
Questions for the listing agent
- What do current leases actually rent for vs. the listed asking? Can we see a recent rent roll and the last 12 months of T-12 income?
- It's been on market 77 days. Have you received any prior offers? Is the seller open to a 15% concession, seller financing, or rate buy-down credit?
- Built in 1950 — when were the roof, HVAC, electrical panel, plumbing, and water heater last replaced?
- Why hasn't it sold? Are there any deal-killer items the seller is aware of (foundation, flood, title, zoning, code violations)?
- Is there a deadline driving the sale (1031 exchange, divorce, estate, relocation)? That informs how much negotiation room exists.
- Schools are D-rated, which usually means shorter tenancies and higher turnover. Who's the typical renter profile here, and what's been the actual vacancy rate?
- Crime grade is D in this area — have there been break-ins, vandalism, or insurance claims at this property in the last 3 years? What carrier currently insures it and at what premium?
- The area grade is low — what's the realistic commute time and amenity access for the typical tenant pool here? Any planned neighborhood developments (good or bad) we should know about?
- What's the average days-on-market for RENTAL listings here right now (not sales)? A rising rental-DOM trend means longer vacancies and softer asking-rent achievability than the comps imply.
- What's the recent tenant-quality profile in this submarket — average credit score on applications, eviction rate, late-payment / NSF rate, and stable-employment percentage? A property-management company in the area should have these aggregated.
- How much new for-sale + rental construction is in the pipeline within 1–3 miles? Heavy new supply typically softens prices + rents 12–24 months out; constrained supply supports both.
Investment metrics
- 1% rule
- 0.85% ✗
- Cap rate
- 6.00%
- Cash-on-cash
- -1.04%
- DSCR
- 0.95
- GRM
- 9.8
CMA / ARV
- ARV (on-the-fly)
- $172,156
- Comps found
- 12
Show comp detail 12 sales within ~0.75 mi
| Address | Dist | Beds/Ba | Sqft | Sold | Price | $/sf | Match |
|---|---|---|---|---|---|---|---|
| 206 Friedheim Rd | 0.16mi | 2/1.0 | 791 (+2%) | 1mo | $165,000 | $209 | 88 |
| 309 Orr Dr | 0.13mi | 2/1.0 | 794 (+3%) | 2mo | $70,000 | $88 | 88 |
| 358 Orr Dr | 0.21mi | 2/1.0 | 803 (+4%) | 2mo | $206,000 | $257 | 82 |
| 214 Orr Dr | 0.08mi | 2/1.0 | 864 (+12%) | 2mo | $120,000 | $139 | 74 |
| 329 Arnold St | 0.30mi | 3/1.0 (+1) | 786 (+2%) | 7mo | $160,000 | $204 | 72 |
| 66 Reynolds St | 0.44mi | 2/1.0 | 754 (-2%) | 6mo | $183,000 | $243 | 71 |
| 225 Baker St | 0.15mi | 2/1.0 | 853 (+10%) | 12mo | $195,000 | $229 | 66 |
| 339 Arnold St | 0.31mi | 2/1.0 | 715 (-7%) | 10mo | $180,000 | $252 | 65 |
| 420 Byars St | 0.34mi | 2/1.0 | 701 (-9%) | 8mo | $175,000 | $250 | 63 |
| 325 Orr Dr | 0.16mi | 2/1.0 | 870 (+13%) | 11mo | $164,900 | $190 | 62 |
| 457 Fewell St | 0.55mi | 3/2.0 (+1) | 824 (+7%) | 3mo | $183,500 | $223 | 51 |
| 459 Green St | 0.50mi | 2/1.0 | 887 (+15%) | 1mo | $195,000 | $220 | 51 |
Match score weights: distance 35% · size 25% · config 20% · recency 20%. Top-matched comps best support the ARV.
Projected returns pro-forma
-3.0% appreciation · 5.53% rent growth · sell at horizon
- IRR
- -15.2%
- Equity multiple
- 0.45×
- Total profit
- $-27,795
- Equity at exit
- $26,689
- IRR
- -2.8%
- Equity multiple
- 0.79×
- Total profit
- $-10,566
- Equity at exit
- $15,477
Cash invested: $50,120 (down + closing). Projections, not guarantees.
Landlord ↔ Tenant lean methodology
- Overall (STATE)
- 90 Strongly Landlord-Friendly
- State South Carolina
- 90 Strongly Landlord-Friendly · R+6
- County
- — inherits STATE
- City
- — inherits STATE
ZIP-level market 29730
- Rents YoY
- 5.5%
- Active inventory
- 348
- Price-to-rent
- 9.8×
Monthly cashflow live
- Estimated rent
- $1,516 high interval (Pro) →
- Mortgage (P&I)
- −$939
- Tax from tax record
- −$228 /mo · $2,737/yr
- Insurance
- −$75
- HOA
- −$0
- Vacancy / Maint / Mgmt
- −$318
- Net cashflow
- $-44
Break-even live
UW: 25.0% down · 7.5% · 30yr · 1.5% tax · 5.0% vac · 8.0% maint · 8.0% mgmt
Financing live
Cash to close
- Down payment
- $44,750
- Closing costs
- $5,370
- Reserves months
- —
- Total cash needed
- —
Loan-product check · same deal, 3 products live
Conventional
25% down · 7.5% · 30yr
- Down + closing
- —
- Monthly P&I
- —
- Monthly cashflow
- —
- DSCR
- —
- Eligible?
- —
Personal DTI + credit; lowest rate.
DSCR
20% down · 8.5% · 30yr
- Down + closing
- —
- Monthly P&I
- —
- Monthly cashflow
- —
- DSCR
- —
- Eligible?
- —
No personal income docs; deal must DSCR.
Hard money
10% down · 12.0% · 12mo
- Down + closing
- —
- Monthly P&I
- —
- Monthly cashflow
- —
- DSCR
- —
- Eligible?
- —
Short-term bridge; refi at stabilization.
Rent comps 24 comps
| Address | Beds | Baths | Sqft | Rent | $/sqft | DOM | Units | Dist |
|---|---|---|---|---|---|---|---|---|
| 207 Friedheim Rd Rock Hill, SC | 3.0 | 1.0 | 1000 | $1,549 | $1.55 | 3d | 1 | 0.09mi |
| 316 Little St Rock Hill, SC | 2.0 | 1.0 | 725 | $1,150 | $1.59 | 22d | 1 | 0.46mi |
| 175 W Black St Rock Hill, SC | 1.0–2.0 | 1.0–2.0 | 1021 | $1,685 | $1.65 | 20d | 11 | 0.64mi |
| 175 W Black St Unit 211 Rock Hill, SC | 1.0 | 1.0 | 824 | $1,440 | $1.75 | 24d | 1 | 0.64mi |
| 234 Saluda St Rock Hill, SC | 1.0 | 1.0 | 528 | $950 | $1.80 | 15d | 1 | 0.74mi |
| 108 E Main St Rock Hill, SC | 1.0–2.0 | 1.0–2.0 | 779 | $1,893 | $2.43 | 2d | 7 | 0.74mi |
| 216 McFadden St Rock Hill, SC | 2.0 | 2.0 | 984 | $1,450 | $1.47 | 15d | 1 | 0.86mi |
| 117 E White St Rock Hill, SC | 2.0 | 1.0–2.0 | 797 | $2,065 | $2.59 | 4d | 33 | 0.88mi |
| 810 S York Ave Rock Hill, SC | 1.0–3.0 | 1.0 | 787 | $1,249 | $1.59 | 2d | 10 | 0.97mi |
| 371 Technology Center Way Rock Hill, SC | 1.0–2.0 | 1.0–2.0 | 832 | $2,155 | $2.59 | 3d | 37 | 1.01mi |
| 1547 Caprine CT Rock Hill, SC | 1.0–3.0 | 1.0–2.0 | 959 | $1,478 | $1.54 | 2d | 15 | 1.03mi |
| 130 Reid St Rock Hill, SC | 1.0 | 1.0 | 600 | $1,075 | $1.79 | 24d | 1 | 1.03mi |
| 130 Reid St Rock Hill, SC | 1.0 | 1.0 | 600 | $1,075 | $1.79 | 11d | 1 | 1.03mi |
| 116 S Spruce St Apt B Rock Hill, SC | 2.0 | 2.0 | 850 | $1,235 | $1.45 | 24d | 1 | 1.04mi |
| 116 S Spruce St Unit A Rock Hill, SC | 2.0 | 2.0 | 850 | $1,200 | $1.41 | 20d | 1 | 1.04mi |
| 378 Technology Center Way Rock Hill, SC | 1.0 | 1.0 | 622 | $1,720 | $2.77 | 3d | 7 | 1.09mi |
| 542 E Black St Rock Hill, SC | 2.0 | 1.0 | 850 | $1,595 | $1.88 | 4d | 1 | 1.13mi |
| 542 E Black St Rock Hill, SC | 2.0 | 1.0 | 850 | $1,595 | $1.88 | 22d | 1 | 1.13mi |
| 987 Pebble Rd Rock Hill, SC | 3.0 | 1.0 | 1044 | $1,295 | $1.24 | 24d | 1 | 1.20mi |
| 658 Arch Dr Rock Hill, SC | 3.0 | 1.0 | 985 | $1,700 | $1.73 | 4d | 1 | 1.21mi |
| 418 Pickens Ct Rock Hill, SC | 2.0 | 2.0 | 1060 | $1,800 | $1.70 | 24d | 1 | 1.24mi |
| 1128 Westover Cir Rock Hill, SC | 3.0 | 1.0 | 1119 | $1,495 | $1.34 | 24d | 1 | 1.33mi |
| 618 Union Ave Rock Hill, SC | 2.0 | 2.0 | 1050 | $1,475 | $1.40 | 16d | 1 | 1.36mi |
| 819 Chestnut St Rock Hill, SC | 3.0 | 1.0 | 1014 | $1,800 | $1.78 | 4d | 1 | 1.41mi |
Listing history 22 events
-
2026-06-18days on market $179,000 Active 77 DOM
-
2026-06-17days on market $179,000 Active 76 DOM
-
2026-06-16days on market $179,000 Active 75 DOM
-
2026-06-15days on market $179,000 Active 74 DOM
-
2026-06-13days on market $179,000 Active 72 DOM
-
2026-06-09days on market $179,000 Active 68 DOM
-
2026-06-08days on market $179,000 Active 67 DOM
-
2026-06-07days on market $179,000 Active 66 DOM
-
2026-06-04days on market $179,000 Active 63 DOM
-
2026-06-03days on market $179,000 Active 62 DOM
-
2026-06-02days on market $179,000 Active 61 DOM
-
2026-06-01days on market $179,000 Active 60 DOM
-
2026-05-31days on market $179,000 Active 59 DOM
-
2026-04-02$179,000 Active
-
2026-01-02price $179,000
-
2025-12-23price $184,000
-
2025-12-09price $185,000
-
2025-11-18price $189,000
-
2025-10-26price $192,500
-
2025-10-06price $195,000
-
2025-08-22$199,000 Active
-
2025-06-30soldstatus $111,000
ⓘ Source: listings_history table (triggers on properties + properties_extension) + one-shot
backfill from property_details.listing_events for pre-trigger history.
Tax reassessment forecast SC · Resets to sale price
- Current annual tax
- $2,737 · $228/mo
- Projected year-2 tax
- $2,737 · $228/mo
- Expected delta
- $0/yr ($0/mo · 0.0%)
ⓘ Screening estimate from a state-policy table — verify with the county assessor before closing.
Climate risk First Street
- Flood 1/10 Low FEMA zone X (unshaded) · 0% chance over 30 yrs
- Wildfire 3/10 Moderate
- Heat 6/10 Major 7 d/yr ≥105°F today · 16 d/yr by 30 yrs out
- Wind 6/10 Major 27% chance of damaging wind over 30 yrs
- Air quality 3/10 Moderate 2 unhealthy d/yr today · 3 by 30 yrs out
Nearby sold comps map
Loading sold comps map…
Walkable amenities ~0.75 mi
Loading nearby amenities…
Taxation est. · year 1
- Rental income
- $18,195
- − Mortgage interest
- −$10,027
- − Property taxes
- −$2,737
- − Insurance
- −$895
- − Repairs & maintenance
- −$1,456
- − Management
- −$1,456
- − Depreciation
- −$5,207
- Taxable loss
- −$3,582
- Est. tax savings @ 24.0%
- +$860
- After-tax cash flow
- $337/yr
For passive investors: Depreciation is non-cash, so a rental often shows a tax loss while cash-flowing — sheltering income. Rental losses are passive: they offset passive income freely, and up to $25,000/yr can offset ordinary (W-2) income if you actively participate and your MAGI is under $100k (phasing out to $0 by $150k); unused losses carry forward. On sale, claimed depreciation is recaptured at up to 25%, and gains may owe capital-gains tax (a 1031 exchange can defer both). Figures are a year-1 estimate at your 24.0% rate — not tax advice; consult a CPA.
Schools (NCES district)
- District
- York 03
- NCES district ID
- 4503870
- Math proficiency
- 36% ▼ -8.00%
- Reading proficiency
- 47% ▲ 3.00%
- Median HH income
- $47,570
- Composite
- 35.46/100
- National rank
- #4928
- State rank
- #32 of 80 in SC
Livability — Rock Hill
- Score
- 70/100
- State rank
- #62
- US rank
- #7573
Category grades
Schools grade is shown separately in the Schools card above.
Census & demographics
- Census place
- Rock Hill, SC
- County
- York County · 281,758 people
- City population
- 115,874
- Metro
- Charlotte-Concord-Gastonia, NC-SC
- Population (ZIP)
- 58,199
- Household income
- $68,543
- Rent vs Own
- Severe rent burden
- 1869.0
Population outlook (York County) Hauer SSP2
- Today (2025)
- 307,757 people
- By 2030
- 335,979 · +9.2%
- By 2040
- 391,378 · +27.2%
- By 2050
- 443,234 · +44.0%
- By 2075
- 557,102 · +81.0%
- By 2100
- 625,837 · +103.4%
Race, ethnicity, and origin ACS 2023
- Neighborhood character
- Diverse neighborhood (Simpson 0.59)
- Race & ethnicity
- White 51% Black 39% Hispanic / Latino 4% Two or more races 4% Native American 2% Asian 1%
- Common ancestry
- Serbian 2% Slovak 2% Lithuanian 1%
- Foreign-born
- 4% · Canada, Vietnam, China
- Languages at home
- 95% English-only · Spanish 3%
Political lean MEDSL · York
- 2024 margin
- R (+19.1) · D 39.7% · R 58.8% · Other 1.5%
- 2008→2024 swing
- -1.4pp toward R · 2008: -17.7pp · 2024: -19.1pp
- All cycles
- 2024: R+19.1 2020: R+16.5 2016: R+22.1 2012: R+20.5 2008: R+17.7
Not yet ingested
- Civics
- —
Market trends
- HPI YoY
- ▼ -285.91%
- Current HPI
- 268.2609
- Rent YoY
- ▲ 5.53%
- Metro
- Charlotte-Concord-Gastonia, NC-SC
- State GDP YoY
- ▲ 4.51%
- F500 in state
- 2
Industry mix (Fortune 500 HQ in SC)
| Industry | F500 HQs | Revenue |
|---|---|---|
| Packaging | 1 | $7B |
|
||
Price history
+61.3% since first listed9 events — show timeline
- 2026-04-02 Listed $179,000 CANOPYMLS as Distributed by MLS Grid
- 2026-01-02 Price Changed $179,000 CANOPYMLS as Distributed by MLS Grid
- 2025-12-23 Price Changed $184,000 CANOPYMLS as Distributed by MLS Grid
- 2025-12-09 Price Changed $185,000 CANOPYMLS as Distributed by MLS Grid
- 2025-11-18 Price Changed $189,000 CANOPYMLS as Distributed by MLS Grid
- 2025-10-26 Price Changed $192,500 CANOPYMLS as Distributed by MLS Grid
- 2025-10-06 Price Changed $195,000 CANOPYMLS as Distributed by MLS Grid
- 2025-08-22 Listed $199,000 CANOPYMLS as Distributed by MLS Grid
- 2025-06-30 Sold (Public Records) $111,000 Public Records
Property tax history
+22.2%/yrLatest (2025): $2,737 · +778.5% YoY. Source: county tax records.
Cash-flow waterfall
monthlySold comps — $/sqft
last 12 mo · ≤1 miLoading sold comps…