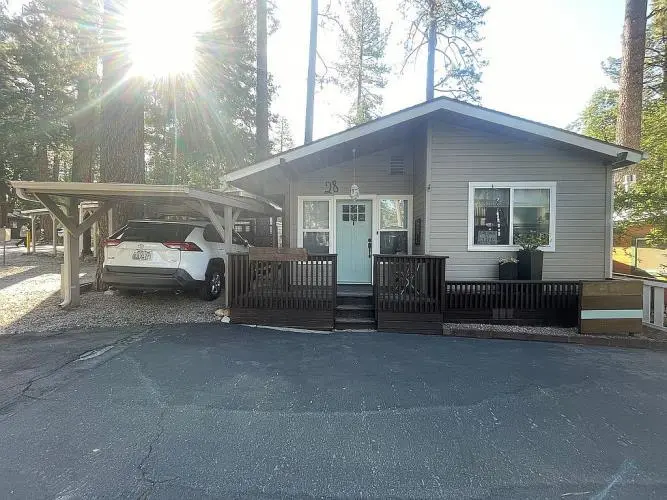
25955 California 243 Spc 28 · Idyllwild-Pine Cove, CA
Flood risk 8/10 · Major
- FEMA flood zone
- X (unshaded)
- Chance of flooding over 30 yrs
- 0.99%
- Est. flood insurance / yr
- $507 – $1,088
Fire risk 8/10 · Major
- Est. fire insurance / yr
- $659 – $1,223
Heat risk 3/10 · Minor
- Hot days now (above 87°F)
- 8 days/yr
- Hot days in 30 yrs
- 22 days/yr
Wind risk 1/10 · Minimal
- Chance of severe wind over 30 yrs
- —
Air-quality risk 6/10 · Moderate
- Unhealthy air days now
- 9 days/yr
- Unhealthy air days in 30 yrs
- 12 days/yr
Risk factors via First Street. Map © Google.
Why this score? — see what drove the C+ grade
The composite is a weighted blend of 9 inputs, each scored 0–100. Each bar is that input's sub-score; the figure is the points it added to the 100-point composite (weight × sub-score).
- Cash flow +30.0/30.0
- DSCR +10.0/10.0
- 1% rule +9.9/10.0
- Condition / age +3.8/5.0
- Rent growth +2.5/5.0
- Schools +2.5/10.0
- Livability +2.5/5.0
- ARV discount +1.4/15.0
- Appreciation +0.0/10.0
$120,000
🖨 Deal sheet 📄 Offer letter ✓ Due diligence
Listing remarks
Eclectic transformed trailer to modernized mountain cabin. Located in 58- unit Idyllwild Trailer Park (centered in town close to stores, restaurants, entertainment, services) with Clubhouse, Laundry & amp; Shower Room, and year-round social activities. Large living area adjacent to newly built exterior deck. Upgraded plumbing, lighting, interior and exterior paint in 2017. Hook up for personalized laundry equipment. Efficient centrally-located propane stove heats entire home. Newer microwave and refrigerator. Fully furnished.
Key facts
- Exterior paint
- Upgraded lighting
- Upgraded plumbing
Tags
Neighborhood map
What this means for you Summary
Snapshot
- This is a 2-bed/1.5-bath manufactured listed at $120k. Condition is rated good.
Deal economics
- At list price, monthly cash flow is $514 ($6k/yr) — positive.
- The deal already cash-flows at list — no discount required.
- Meets the 1% rule at list price ($2k rent vs $120k).
- Cap rate 12.1% vs local median 2.9% in Idyllwild-Pine Cove — top-decile yield for the area; either an underpriced asset or a hidden risk that comps aren't pricing in. Stress-test before assuming the spread holds.
Location & tenants
- Location reads: area grade C — affects rentability + tenant quality, not the cash-flow math above.
- Hemet Unified (suburban): math 19% / reading 41% proficiency, ranked #360 of 517 in CA (top 70%) — families likely to look elsewhere, expect single-tenant / working-renter base with shorter leases; 66% free/reduced lunch — lower-income household profile, screen leases tightly.
- Market conditions: 183 active listings in the ZIP; 14 comparable units currently listed for rent nearby; rentals lingering (median 44d on market — plan ~5-8 weeks vacancy on turnover, expect pricing pressure); 79% of comp listings sitting > 30 days — soft ceiling on asking rent; 9,195 units permitted in Riverside County in 2024 (1,512 in 5+ unit buildings).
Forward outlook
- Local home prices are declining (-3.0%/yr); year-one equity from $830 of loan paydown is wiped out by about $4k of value loss. Plan a longer hold.
- Riverside County population projected at +22% by 2050 — long-run rental-demand tailwind backs the buy-and-hold thesis.
- At projected returns (-3.0% appreciation + 3.0% rent growth), your $34k cash investment doubles in ~7 years — after that, you're playing with house money.
Negotiation context
- Only 9 days on market — expect competitive offers; lowballing is unlikely to land.
Risks & watch-outs
- Watch-outs: flood insurance adds $66/mo.
- Climate carrying-cost: severe flood risk; severe wildfire risk — expect insurance premiums to compound above CPI over the hold.
Questions for the listing agent
- What's the actual annual flood-insurance premium (NFIP or private), and is the property in a SFHA with mandatory coverage?
- Is there a deadline driving the sale (1031 exchange, divorce, estate, relocation)? That informs how much negotiation room exists.
- What's the average days-on-market for RENTAL listings here right now (not sales)? A rising rental-DOM trend means longer vacancies and softer asking-rent achievability than the comps imply.
- What's the recent tenant-quality profile in this submarket — average credit score on applications, eviction rate, late-payment / NSF rate, and stable-employment percentage? A property-management company in the area should have these aggregated.
- How much new for-sale + rental construction is in the pipeline within 1–3 miles? Heavy new supply typically softens prices + rents 12–24 months out; constrained supply supports both.
Investment metrics
- 1% rule
- 1.49% ✓
- Cap rate
- 12.10%
- Cash-on-cash
- 20.72%
- DSCR
- 1.92
- GRM
- 5.6
CMA / ARV
- ARV (on-the-fly)
- $105,640
- Comps found
- 2
Show comp detail 2 sales within ~0.75 mi
| Address | Dist | Beds/Ba | Sqft | Sold | Price | $/sf | Match |
|---|---|---|---|---|---|---|---|
| 25955 Hwy 243 #25 | 0.00mi | 2/1.0 | 720 (-5%) | 2mo | $87,000 | $121 | 88 |
| 25955 Highway 243 #18 | 0.01mi | 2/1.0 | 720 (-5%) | 5mo | $99,850 | $139 | 85 |
Match score weights: distance 35% · size 25% · config 20% · recency 20%. Top-matched comps best support the ARV.
Projected returns pro-forma
-3.0% appreciation · 3.0% rent growth · sell at horizon
- IRR
- 10.1%
- Equity multiple
- 1.40×
- Total profit
- $13,348
- Equity at exit
- $17,892
- IRR
- 19.2%
- Equity multiple
- 2.61×
- Total profit
- $54,038
- Equity at exit
- $10,375
Cash invested: $33,600 (down + closing). Projections, not guarantees.
Landlord ↔ Tenant lean methodology
- Overall (STATE)
- 18 Strongly Tenant-Friendly
- State California
- 18 Strongly Tenant-Friendly · D+13
- County
- — inherits STATE
- City
- — inherits STATE
ZIP-level market 92549
- Home prices YoY
- -25.8%
- Active inventory
- 183
- Price-to-rent
- 5.6×
Monthly cashflow live
- Estimated rent
- $1,784 high interval (Pro) →
- Mortgage (P&I)
- −$629
- Tax est. 1.5%
- −$150 /mo · $1,800/yr
- Insurance
- −$50
- Flood insurance flood zone
- −$66 /mo · $798/yr
- HOA
- −$0
- Vacancy / Maint / Mgmt
- −$375
- Net cashflow
- $514
Break-even live
UW: 25.0% down · 7.5% · 30yr · 1.5% tax · 5.0% vac · 8.0% maint · 8.0% mgmt
Financing live
Cash to close
- Down payment
- $30,000
- Closing costs
- $3,600
- Reserves months
- —
- Total cash needed
- —
Loan-product check · same deal, 3 products live
Conventional
25% down · 7.5% · 30yr
- Down + closing
- —
- Monthly P&I
- —
- Monthly cashflow
- —
- DSCR
- —
- Eligible?
- —
Personal DTI + credit; lowest rate.
DSCR
20% down · 8.5% · 30yr
- Down + closing
- —
- Monthly P&I
- —
- Monthly cashflow
- —
- DSCR
- —
- Eligible?
- —
No personal income docs; deal must DSCR.
Hard money
10% down · 12.0% · 12mo
- Down + closing
- —
- Monthly P&I
- —
- Monthly cashflow
- —
- DSCR
- —
- Eligible?
- —
Short-term bridge; refi at stabilization.
Rent comps 14 comps
| Address | Beds | Baths | Sqft | Rent | $/sqft | DOM | Units | Dist |
|---|---|---|---|---|---|---|---|---|
| 54100 Pine Crest Ave Idyllwild, CA | 1.0 | 1.0 | 600 | $1,450 | $2.42 | 43d | 1 | 0.10mi |
| 54045 Pine Crest Ave Unit NA Idyllwild-Pine Cove, CA | 1.0 | 1.0 | 609 | $1,300 | $2.13 | 19d | 1 | 0.17mi |
| 54042 Pine Crest Ave Idyllwild, CA | 1.0 | 1.0 | 529 | $1,199 | $2.27 | 43d | 1 | 0.20mi |
| 54365 Pine Crest Ave Unit 6 Idyllwild-Pine Cove, CA | 2.0 | 2.0 | 1100 | $1,900 | $1.73 | 4d | 1 | 0.23mi |
| 25165 Cedar St Unit A Idyllwild-Pine Cove, CA | 2.0 | 2.0 | 800 | $2,000 | $2.50 | 43d | 1 | 0.23mi |
| 25873 Cedar St Idyllwild-Pine Cove, CA | 2.0 | 2.0 | 990 | $1,995 | $2.02 | 44d | 1 | 0.27mi |
| 54095 S Circle Dr Idyllwild, CA | 2.0 | 2.0 | 1100 | $2,800 | $2.55 | 1d | 1 | 0.36mi |
| 25679 Alderwood St Idyllwild, CA | 3.0 | 2.0 | 900 | $2,400 | $2.67 | 43d | 1 | 0.38mi |
| 26500 California 243 Unit G Idyllwild-Pine Cove, CA | 1.0 | 1.0 | 600 | $1,250 | $2.08 | 43d | 1 | 0.41mi |
| 54374 Valley-View Unit Upstairs Idyllwild-Pine Cove, CA | 1.0 | 1.0 | 750 | $1,600 | $2.13 | 43d | 1 | 0.57mi |
| 54059 Montgomery St Idyllwild, CA | 3.0 | 2.0 | 1027 | $2,350 | $2.29 | 43d | 1 | 0.62mi |
| 54991 Pine Crest Ave Idyllwild-Pine Cove, CA | 1.0 | 1.0 | 800 | $1,800 | $2.25 | 43d | 1 | 0.81mi |
| 53390 Circle View Dr Idyllwild-Pine Cove, CA | 2.0 | 1.0 | 816 | $2,200 | $2.70 | 43d | 1 | 1.17mi |
| 52640 Marian View Dr Idyllwild-Pine Cove, CA | 1.0 | 1.0 | 648 | $1,500 | $2.31 | 43d | 1 | 1.48mi |
Listing history 7 events
-
2026-06-18days on market $120,000 Active 9 DOM
-
2026-06-17days on market $120,000 Active 8 DOM
-
2026-06-16days on market $120,000 Active 7 DOM
-
2026-06-15days on market $120,000 Active 6 DOM
-
2026-06-13days on market $120,000 Active 4 DOM
-
2026-06-10remarks 531-char remark
-
2026-06-10$120,000 Active 1 DOM
ⓘ Source: listings_history table (triggers on properties + properties_extension) + one-shot
backfill from property_details.listing_events for pre-trigger history.
Climate risk First Street
- Flood 8/10 Severe FEMA zone X (unshaded) · 99% chance over 30 yrs
- Wildfire 8/10 Severe
- Heat 3/10 Moderate 8 d/yr ≥87°F today · 22 d/yr by 30 yrs out
- Wind 1/10 Low
- Air quality 6/10 Major 9 unhealthy d/yr today · 12 by 30 yrs out
Nearby sold comps map
Loading sold comps map…
Walkable amenities ~0.75 mi
Loading nearby amenities…
Taxation est. · year 1
- Rental income
- $21,411
- − Mortgage interest
- −$6,722
- − Property taxes
- −$1,800
- − Insurance
- −$1,398
- − Repairs & maintenance
- −$1,713
- − Management
- −$1,713
- − Depreciation
- −$3,491
- Taxable income
- $4,575
- Est. tax owed @ 24.0%
- −$1,098
- After-tax cash flow
- $5,068/yr
For passive investors: Depreciation is non-cash, so a rental often shows a tax loss while cash-flowing — sheltering income. Rental losses are passive: they offset passive income freely, and up to $25,000/yr can offset ordinary (W-2) income if you actively participate and your MAGI is under $100k (phasing out to $0 by $150k); unused losses carry forward. On sale, claimed depreciation is recaptured at up to 25%, and gains may owe capital-gains tax (a 1031 exchange can defer both). Figures are a year-1 estimate at your 24.0% rate — not tax advice; consult a CPA.
Condition & rehab AI · 10 photos
This property is in good condition with cosmetic updates needed to enhance its resale and rental value. The kitchen and exterior trim could benefit from fresh paint, and landscaping improvements would significantly boost curb appeal.
Repairs flagged
- Minor Kitchen Countertops — Worn appearance suggests minor repair needed.
- Minor Kitchen Backsplash — Worn appearance suggests minor repair needed.
Value-add opportunities
- Resale Paint kitchen cabinets — Fresh paint can make the kitchen appear more modern and appealing.
- Resale Replace worn kitchen countertops — New countertops can significantly improve the kitchen's appearance and functionality.
- Resale Upgrade kitchen backsplash — A new backsplash can add a fresh look and improve the kitchen's functionality.
- Both Landscaping improvements — Enhanced landscaping can improve curb appeal and add value to the property.
- Rental HVAC system maintenance — A clean and efficient HVAC system is crucial for tenant satisfaction and can reduce utility costs.
Renovation cost estimate screening
| Repair item | Severity | Est. cost |
|---|---|---|
| Kitchen Countertops · Worn appearance suggests minor repair needed. | Minor | $500–3,000 |
| Kitchen Backsplash · Worn appearance suggests minor repair needed. | Minor | $500–3,000 |
| Total estimated repair cost · 2 items | $1,000–6,000 |
Value-add ROI direction
- Resale Paint kitchen cabinets — Fresh paint can make the kitchen appear more modern and appealing. ↑
- Resale Replace worn kitchen countertops — New countertops can significantly improve the kitchen's appearance and functionality. ↑
- Resale Upgrade kitchen backsplash — A new backsplash can add a fresh look and improve the kitchen's functionality. ↑
- Both Landscaping improvements — Enhanced landscaping can improve curb appeal and add value to the property. ↑
- Rental HVAC system maintenance — A clean and efficient HVAC system is crucial for tenant satisfaction and can reduce utility costs. ↑
ⓘ Cost ranges are severity-bucket heuristics (US national rule-of-thumb). Get contractor quotes + a written scope before underwriting a rehab budget.
Schools (NCES district)
- District
- Hemet Unified
- NCES district ID
- 0616920
- Math proficiency
- 19% ▼ -3.00%
- Reading proficiency
- 41% ▲ 4.00%
- Median HH income
- $39,962
- Composite
- 25.16/100
- National rank
- #7517
- State rank
- #360 of 517 in CA
Livability — Idyllwild-Pine Cove
No livability data for this city. (Only ~50 U.S. cities are tracked.)
Census & demographics
- Census place
- Idyllwild-Pine Cove, CA
- County
- Riverside County · 2,287,001 people
- Metro
- Riverside-San Bernardino-Ontario, CA
- Population (ZIP)
- 4,016
- Household income
- $73,750
- Rent vs Own
- Severe rent burden
- 156.0
Population outlook (Riverside County) Hauer SSP2
- Today (2025)
- 2,664,475 people
- By 2030
- 2,802,692 · +5.2%
- By 2040
- 3,050,904 · +14.5%
- By 2050
- 3,256,783 · +22.2%
- By 2075
- 3,655,058 · +37.2%
- By 2100
- 3,766,594 · +41.4%
Race, ethnicity, and origin ACS 2023
- Neighborhood character
- Diverse neighborhood (Simpson 0.61)
- Race & ethnicity
- White 57% Hispanic / Latino 24% Asian 9% Two or more races 8% Native American 2%
- Hispanic origin (detail)
- Mexican 13%
- Common ancestry
- Slovak 4% Italian 2% Romanian 2%
- Foreign-born
- 20% · Canada, China, Vietnam
- Languages at home
- 79% English-only · Spanish 14% Tagalog/Filipino 2% Other Indo-European 2%
Political lean MEDSL · Riverside
- 2024 margin
- Toss-up / Even · D 48.0% · R 49.3% · Other 2.6%
- 2008→2024 swing
- -3.6pp toward R · 2008: 2.3pp · 2024: -1.3pp
- All cycles
- 2024: R+1.3 2020: D+8.0 2016: D+4.3 2012: R+0.4 2008: D+2.3
Not yet ingested
- Civics
- —
Market trends
- HPI YoY
- ▼ -100.32%
- Current HPI
- 287.8582
- Rent YoY
- —
- Metro
- Riverside-San Bernardino-Ontario, CA
- State GDP YoY
- ▲ 3.21%
- F500 in state
- 116
Industry mix (Fortune 500 HQ in CA)
| Industry | F500 HQs | Revenue |
|---|---|---|
| Technology | 27 | $1,492B |
|
||
| Financial Services | 3 | $174B |
|
||
| Retail | 3 | $44B |
|
||
| Insurance | 3 | $26B |
|
||
| Media / Entertainment | 2 | $115B |
|
||
| Pharmaceuticals / Biotech | 2 | $62B |
|
||
Price history
1 event — show timeline
- 2026-06-05 Listed $120,000 Fizber.com
Cash-flow waterfall
monthlySold comps — $/sqft
last 12 mo · ≤1 miLoading sold comps…