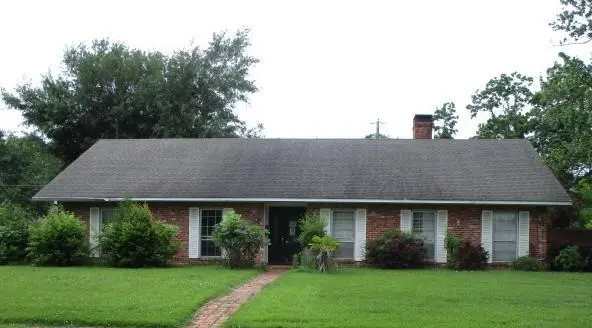
508 Post Oak Blvd · Alexandria, LA
Flood risk 1/10 · Minimal
- FEMA flood zone
- X (shaded)
- Chance of flooding over 30 yrs
- 0.0%
- Est. flood insurance / yr
- $507 – $1,088
Fire risk 1/10 · Minimal
- Est. fire insurance / yr
- $1,269 – $2,357
Heat risk 8/10 · Major
- Hot days now (above 111°F)
- 7 days/yr
- Hot days in 30 yrs
- 19 days/yr
Wind risk 8/10 · Major
- Chance of severe wind over 30 yrs
- 97.0%
Air-quality risk 2/10 · Minimal
- Unhealthy air days now
- 1 days/yr
- Unhealthy air days in 30 yrs
- 1 days/yr
Risk factors via First Street. Map © Google.
Why this score? — see what drove the C grade
The composite is a weighted blend of 9 inputs, each scored 0–100. Each bar is that input's sub-score; the figure is the points it added to the 100-point composite (weight × sub-score).
- Cash flow +18.8/30.0
- ARV discount +15.0/15.0
- DSCR +5.9/10.0
- 1% rule +5.5/10.0
- Livability +3.2/5.0
- Schools +3.1/10.0
- Rent growth +2.5/5.0
- Condition / age +2.5/5.0
- Appreciation +0.0/10.0
$145,000
🖨 Deal sheet 📄 Offer letter ✓ Due diligence
Listing remarks MLS
LOCATION! LOCATION! LOCATION!!! You won't want to miss this BEAUTIFUL spacious home conveniently located in the heart of Alexandria!!! This home sits in a great manicured neighborhood not to mention is zoned for some of the best schools! It is listed below market value due to the fact that it could use a little TLC, maybe some fresh paint in some areas and possibly new laminate floors in other areas etc. However, prior to the renters, this home was recently updated with ceramic floors, ceramic accent walls in the bathrooms, new plumbing fixtures, granite counter tops, new kitchen cabinets and more! Ladies you will definitely need to check out the massive master bedroom closet and dressing area!!! It is every girls dream! The 1 bed 1 bath mother in law quarters has a kitchenette and small sitting area. This home is a MUST SEE! and WONT LAST LONG! SO CALL TODAY AND LETS GO TAKE A LOOK!!!
Key facts
- Nice size lot
- Kitchenette
- Spacious home
Tags
Property features AI
Finance
- Other: Property located near Heyman Lane, Tanglewood Blvd, Sweetbriar, Cottonwood and Postoak (bounding streets include Cottonwood, Postoak and Hwy 28 W)
Exterior
- Parking: Attached carport
- Home design: Single-family residence
- Construction: Composition roof
- Exterior features: Partial privacy fence
Interior
- Kitchen: Dishwasher; Microwave
- Bedrooms: 2 bedrooms
- Bathrooms: 2 full bathrooms; 1 half bathroom
- Heating & cooling: Central heating (natural gas); Central air conditioning
- Interior features: Living room; Dining room; Bedroom 1; Bedroom 2; Wood-burning fireplace
Neighborhood map
What this means for you Summary
Snapshot
- This is a 3-bed/2.0-bath single-family listed at $145k.
Deal economics
- At list price, monthly cash flow is $146 ($2k/yr) — positive.
- The deal already cash-flows at list — no discount required.
- Meets the 1% rule at list price ($2k rent vs $145k).
- Cap rate 7.5% vs local median 4.9% in Alexandria — top-decile yield for the area; either an underpriced asset or a hidden risk that comps aren't pricing in. Stress-test before assuming the spread holds.
Location & tenants
- Location reads 64/100 on livability (#160 in LA) — a middle-class / working-renter tenant base. Strengths: cost of living A+, housing A+, health & safety A+; Watch: crime F, amenities F, commute F.
- Rapides Parish (urban): math 29% / reading 44% proficiency, ranked #31 of 98 in LA (top 32%) — families likely to look elsewhere, expect single-tenant / working-renter base with shorter leases; 64% free/reduced lunch — lower-income household profile, screen leases tightly.
- Market conditions: 151 active listings in the ZIP; 2 comparable units currently listed for rent nearby; 239 units permitted in Rapides Parish in 2024 (0 in 5+ unit buildings).
Forward outlook
- Local home prices are declining (-3.0%/yr); year-one equity from $1k of loan paydown is wiped out by about $4k of value loss. Plan a longer hold.
- Rapides County population projected to shrink 6% by 2050 — rents likely to lag national; underwrite the cash flow, not the appreciation.
Negotiation context
- Only 14 days on market — expect competitive offers; lowballing is unlikely to land.
- 6 sale attempts since 19y ago with the ask held roughly flat each time — persistent listings suggest the price (not the market) is what's stuck; bring a comps-based counter.
Risks & watch-outs
- Climate carrying-cost: severe wind risk, 97% chance of damaging wind over 30y; extreme-heat days projected 7→19/yr by 2055 (HVAC capex compounding) — expect insurance premiums to compound above CPI over the hold.
Questions for the listing agent
- Built in 1971 — when were the roof, HVAC, electrical panel, plumbing, and water heater last replaced?
- Is there a deadline driving the sale (1031 exchange, divorce, estate, relocation)? That informs how much negotiation room exists.
- Crime grade is F in this area — have there been break-ins, vandalism, or insurance claims at this property in the last 3 years? What carrier currently insures it and at what premium?
- What's the average days-on-market for RENTAL listings here right now (not sales)? A rising rental-DOM trend means longer vacancies and softer asking-rent achievability than the comps imply.
- What's the recent tenant-quality profile in this submarket — average credit score on applications, eviction rate, late-payment / NSF rate, and stable-employment percentage? A property-management company in the area should have these aggregated.
- How much new for-sale + rental construction is in the pipeline within 1–3 miles? Heavy new supply typically softens prices + rents 12–24 months out; constrained supply supports both.
Investment metrics
- 1% rule
- 1.05% ✓
- Cap rate
- 7.50%
- Cash-on-cash
- 4.31%
- DSCR
- 1.19
- GRM
- 8.0
CMA / ARV
- ARV (median comp)
- $212,901
- List price
- $145,000
- Delta
- -31.89%
- Verdict
- UNDERPRICED
- Comps
- 20 within 1.0 mi
Show comp detail 5 sales within ~0.75 mi
| Address | Dist | Beds/Ba | Sqft | Sold | Price | $/sf | Match |
|---|---|---|---|---|---|---|---|
| 403 Ridgewood Blvd | 0.07mi | 4/2.5 (+1) | 2,253 (-4%) | 1mo | $265,000 | $118 | 83 |
| 1255 Lancaster Dr | 0.68mi | 3/2.5 | 2,500 (+7%) | 1mo | $280,000 | $112 | 54 |
| 501 Idlewood Dr | 0.34mi | 3/2.5 | 2,147 (-8%) | 16mo | $205,000 | $95 | 54 |
| 4003 Leon Dr | 0.29mi | 4/2.0 (+1) | 2,000 (-15%) | 4mo | $252,000 | $126 | 53 |
| 3107 Elliott St | 0.59mi | 3/2.0 | 2,071 (-12%) | 3mo | $232,000 | $112 | 51 |
Match score weights: distance 35% · size 25% · config 20% · recency 20%. Top-matched comps best support the ARV.
Projected returns pro-forma
-3.0% appreciation · 3.0% rent growth · sell at horizon
- IRR
- -9.5%
- Equity multiple
- 0.65×
- Total profit
- $-14,160
- Equity at exit
- $21,620
- IRR
- -0.1%
- Equity multiple
- 1.00×
- Total profit
- $-156
- Equity at exit
- $12,537
Cash invested: $40,600 (down + closing). Projections, not guarantees.
Landlord ↔ Tenant lean methodology
- Overall (STATE)
- 90 Strongly Landlord-Friendly
- State Louisiana
- 90 Strongly Landlord-Friendly · R+12
- County
- — inherits STATE
- City
- — inherits STATE
ZIP-level market 71301
- Home prices YoY
- -23.0%
- Active inventory
- 151
- Price-to-rent
- 8.0×
Monthly cashflow live
- Estimated rent
- $1,518 medium interval (Pro) →
- Mortgage (P&I)
- −$760
- Tax from tax record
- −$233 /mo · $2,794/yr
- Insurance
- −$60
- HOA
- −$0
- Vacancy / Maint / Mgmt
- −$319
- Net cashflow
- $146
Break-even live
UW: 25.0% down · 7.5% · 30yr · 1.5% tax · 5.0% vac · 8.0% maint · 8.0% mgmt
Financing live
Cash to close
- Down payment
- $36,250
- Closing costs
- $4,350
- Reserves months
- —
- Total cash needed
- —
Loan-product check · same deal, 3 products live
Conventional
25% down · 7.5% · 30yr
- Down + closing
- —
- Monthly P&I
- —
- Monthly cashflow
- —
- DSCR
- —
- Eligible?
- —
Personal DTI + credit; lowest rate.
DSCR
20% down · 8.5% · 30yr
- Down + closing
- —
- Monthly P&I
- —
- Monthly cashflow
- —
- DSCR
- —
- Eligible?
- —
No personal income docs; deal must DSCR.
Hard money
10% down · 12.0% · 12mo
- Down + closing
- —
- Monthly P&I
- —
- Monthly cashflow
- —
- DSCR
- —
- Eligible?
- —
Short-term bridge; refi at stabilization.
Rent comps 2 comps
| Address | Beds | Baths | Sqft | Rent | $/sqft | DOM | Units | Dist |
|---|---|---|---|---|---|---|---|---|
| 1003 Cinderella Ct Alexandria, LA | 2.0 | 2.0 | 1940 | $1,500 | $0.77 | 43d | 1 | 0.27mi |
| 5006 Sarah St Alexandria, LA | 3.0 | 1.5 | 1832 | $1,600 | $0.87 | 43d | 1 | 1.14mi |
Listing history 10 events
-
2026-05-15status Pending 472-char remark
-
2026-04-28$145,000 Active 472-char remark
-
2021-11-18soldstatus $229,000
-
2021-05-03$229,000 898-char remark
Show marketing remark (898 chars)
LOCATION! LOCATION! LOCATION!!! You won't want to miss this BEAUTIFUL spacious home conveniently located in the heart of Alexandria!!! This home sits in a great manicured neighborhood not to mention is zoned for some of the best schools! It is listed below market value due to the fact that it could use a little TLC, maybe some fresh paint in some areas and possibly new laminate floors in other areas etc. However, prior to the renters, this home was recently updated with ceramic floors, ceramic accent walls in the bathrooms, new plumbing fixtures, granite counter tops, new kitchen cabinets and more! Ladies you will definitely need to check out the massive master bedroom closet and dressing area!!! It is every girls dream! The 1 bed 1 bath mother in law quarters has a kitchenette and small sitting area. This home is a MUST SEE! and WONT LAST LONG! SO CALL TODAY AND LETS GO TAKE A LOOK!!!
-
2019-04-28$239,900
-
2012-08-02soldstatus $188,000
-
2012-02-14$199,000
-
2008-08-12soldstatus $185,000
-
2008-07-07$189,000
-
2007-04-15$179,000
ⓘ Source: listings_history table (triggers on properties + properties_extension) + one-shot
backfill from property_details.listing_events for pre-trigger history.
Tax reassessment forecast LA · Resets to sale price
- Current annual tax
- $2,794 · $233/mo
- Projected year-2 tax
- $2,794 · $233/mo
- Expected delta
- $0/yr ($0/mo · 0.0%)
ⓘ Screening estimate from a state-policy table — verify with the county assessor before closing.
Climate risk First Street
- Flood 1/10 Low FEMA zone X (shaded) · 0% chance over 30 yrs
- Wildfire 1/10 Low
- Heat 8/10 Severe 7 d/yr ≥111°F today · 19 d/yr by 30 yrs out
- Wind 8/10 Severe 97% chance of damaging wind over 30 yrs
- Air quality 2/10 Low 1 unhealthy d/yr today · 1 by 30 yrs out
Nearby sold comps map
Loading sold comps map…
Walkable amenities ~0.75 mi
Loading nearby amenities…
Taxation est. · year 1
- Rental income
- $18,218
- − Mortgage interest
- −$8,122
- − Property taxes
- −$2,794
- − Insurance
- −$725
- − Repairs & maintenance
- −$1,457
- − Management
- −$1,457
- − Depreciation
- −$4,218
- Taxable loss
- −$556
- Est. tax savings @ 24.0%
- +$133
- After-tax cash flow
- $1,882/yr
For passive investors: Depreciation is non-cash, so a rental often shows a tax loss while cash-flowing — sheltering income. Rental losses are passive: they offset passive income freely, and up to $25,000/yr can offset ordinary (W-2) income if you actively participate and your MAGI is under $100k (phasing out to $0 by $150k); unused losses carry forward. On sale, claimed depreciation is recaptured at up to 25%, and gains may owe capital-gains tax (a 1031 exchange can defer both). Figures are a year-1 estimate at your 24.0% rate — not tax advice; consult a CPA.
Schools (NCES district)
- District
- Rapides Parish
- NCES district ID
- 2201290
- Math proficiency
- 29% ▼ -34.00%
- Reading proficiency
- 44% ▼ -29.00%
- Median HH income
- $41,057
- Composite
- 30.68/100
- National rank
- #6179
- State rank
- #31 of 98 in LA
Livability — Alexandria
- Score
- 64/100
- State rank
- #160
- US rank
- #13698
Category grades
Schools grade is shown separately in the Schools card above.
Census & demographics
- Census place
- Alexandria, LA
- City population
- 25,138
- Population (ZIP)
- 17,266
Population outlook (Rapides County) Hauer SSP2
- Today (2025)
- 133,047 people
- By 2030
- 132,333 · -0.5%
- By 2040
- 129,355 · -2.8%
- By 2050
- 124,535 · -6.4%
- By 2075
- 110,338 · -17.1%
- By 2100
- 88,641 · -33.4%
Race, ethnicity, and origin ACS 2023
- Neighborhood character
- Diverse neighborhood (Simpson 0.58)
- Race & ethnicity
- Black 53% White 36% Hispanic / Latino 4% Two or more races 3% Asian 2%
- Common ancestry
- Lithuanian 5% Portuguese 1% Hispanic 1%
- Foreign-born
- 6% · Canada, Vietnam
- Languages at home
- 93% English-only · Spanish 3% Other Asian/Pacific 2% French/Haitian/Cajun 1%
Political lean MEDSL · Rapides
- 2024 margin
- Solid R (+36.8) · D 31.0% · R 67.7% · Other 1.3%
- 2008→2024 swing
- -8.1pp toward R · 2008: -28.7pp · 2024: -36.8pp
- All cycles
- 2024: R+36.8 2020: R+32.1 2016: R+32.5 2012: R+29.6 2008: R+28.7
Not yet ingested
- Civics
- —
Market trends
- HPI YoY
- ▼ -55.38%
- Current HPI
- 184.9889
- Rent YoY
- —
- Metro
- —
- State GDP YoY
- ▲ 3.29%
- F500 in state
- 10
Industry mix (Fortune 500 HQ in LA)
| Industry | F500 HQs | Revenue |
|---|---|---|
| Telecommunications | 2 | $23B |
|
||
| Utilities | 1 | $12B |
|
||
| Wholesale / Distribution | 1 | $5B |
|
||
| Advertising | 1 | $2B |
|
||
Price history
-19.0% since first listed10 events — show timeline
- 2026-05-15 Pending — AcadianaMLS
- 2026-04-28 Listed $145,000 AcadianaMLS
- 2021-11-18 Sold (Public Records) $229,000 Public Records
- 2021-05-03 Listed $229,000 AcadianaMLS
- 2019-04-28 Listed $239,900 AcadianaMLS
- 2012-08-02 Sold (Public Records) $188,000 Public Records
- 2012-02-14 Listed $199,000 AcadianaMLS
- 2008-08-12 Sold (Public Records) $185,000 Public Records
- 2008-07-07 Listed $189,000 AcadianaMLS
- 2007-04-15 Listed $179,000 AcadianaMLS
Property tax history
+1.5%/yrLatest (2025): $2,794 · -1.0% YoY. Source: county tax records.
Cash-flow waterfall
monthlySold comps — $/sqft
last 12 mo · ≤1 miLoading sold comps…