 Duplex
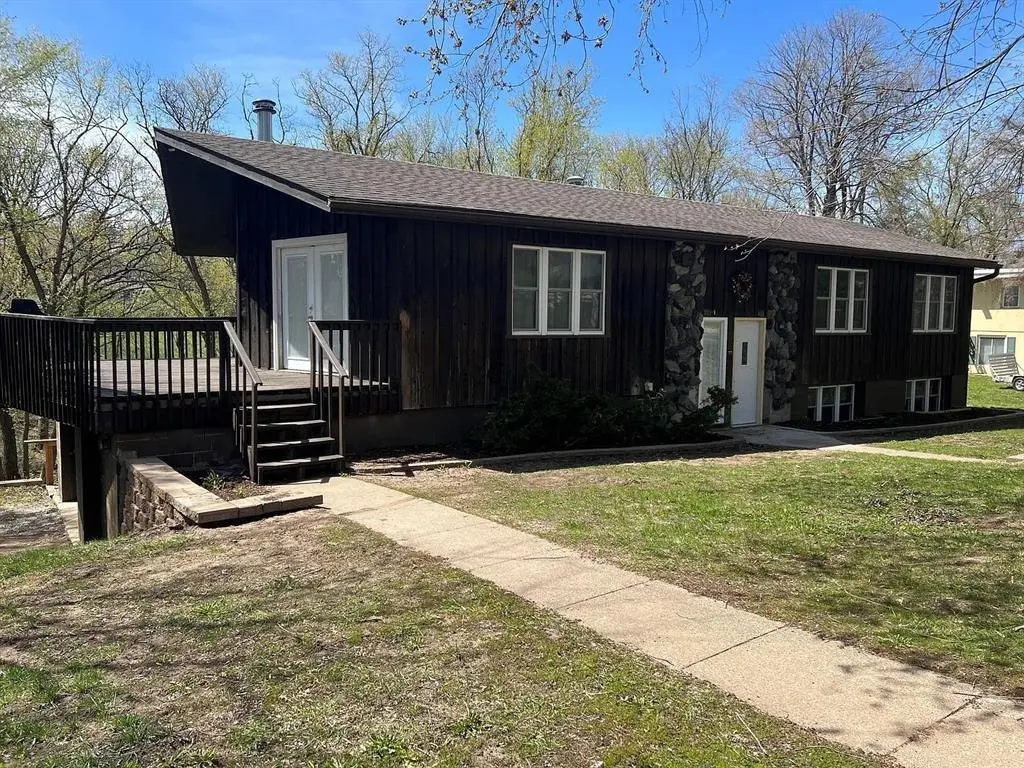
253 Tower Heights Ct Unit 1&2 · Prescott, WI
Flood risk 1/10 · Minimal
- FEMA flood zone
- X (unshaded)
- Chance of flooding over 30 yrs
- 0.0%
- Est. flood insurance / yr
- $473 – $860
Fire risk 1/10 · Minimal
- Est. fire insurance / yr
- $636 – $1,182
Heat risk 2/10 · Minimal
- Hot days now (above 100°F)
- 7 days/yr
- Hot days in 30 yrs
- 14 days/yr
Wind risk 2/10 · Minimal
- Chance of severe wind over 30 yrs
- —
Air-quality risk 2/10 · Minimal
- Unhealthy air days now
- 1 days/yr
- Unhealthy air days in 30 yrs
- 1 days/yr
Risk factors via First Street. Map © Google.
Why this score? — see what drove the D grade
The composite is a weighted blend of 9 inputs, each scored 0–100. Each bar is that input's sub-score; the figure is the points it added to the 100-point composite (weight × sub-score).
- Cash flow +14.5/30.0
- ARV discount +7.5/15.0
- Schools +4.5/10.0
- DSCR +4.4/10.0
- 1% rule +4.0/10.0
- Condition / age +3.8/5.0
- Livability +3.7/5.0
- Rent growth +2.5/5.0
- Appreciation +0.0/10.0
$349,900
🖨 Deal sheet (PDF) 📄 Offer letter ✓ Due diligence
Multi-family units
County records classify this as Multi-Family (2-4 Unit). Listing-text estimate: 2 units. confirmed
Listing remarks
Great Investment Opportunity for a cash flowing Duplex! This Duplex Home offers a warm, inviting presence and peaceful wooded surroundings!! Each Unit is currently occupied and has been recently updated; separately metered for Utilities and features 3 Bedrooms/1 Bath, Kitchen; Laundry along with spacious Decks that runs the length of the Duplex. Two Car Attached Garage w/ ample storage & parking. New landscaping & regrading, sewer line & lift station and Lower Level legal egress window to add 3rd Bedroom. Set among mature trees with Ravine running through this large City Lot at end of road! Schedule your Showing Today!!
Key facts
- Duplex home
- New landscaping
- Recently updated
Tags
Property features AI
Exterior
- Utilities: Municipal water; Municipal sewer
- Home design: Duplex (multi-family); Estimated finished area between 2,001 and 2,500 sq ft; Finished above grade and below grade living space included
- Construction: Block foundation (basement); Wood construction
- Exterior features: Wood exterior; Deck; Lot approximately 0.77 acres; Zoned residential
Interior
- Kitchen: Range/oven; Refrigerator
- Bedrooms: Unit 1: 3 bedrooms; Unit 2: 3 bedrooms
- Bathrooms: Unit 1: 1 full bathroom; Unit 2: 1 full bathroom
- Heating & cooling: Forced air heat; Central air; Natural gas heat
- Interior features: Circuit breakers; Finished walk-out basement with block construction
- Laundry & utility: Washer; Dryer
Neighborhood map
What this means for you Summary
Snapshot
- This is a 2 × 3-bed/1.0-bath units multifamily listed at $350k. Condition is rated good.
Deal economics
- At list price, monthly cash flow is $78 ($940/yr) — positive. Per door: $39/mo.
- The deal already cash-flows at list — no discount required.
- To meet the 1% rule (rent ≥ 1% of price), the offer needs to be $316k (9.7% below list).
- Recommended offer: $316k (9.7% below list) — sets the bar for 1% rule.
- Cap rate 6.6% vs local median 2.3% in Prescott — top-decile yield for the area; either an underpriced asset or a hidden risk that comps aren't pricing in. Stress-test before assuming the spread holds.
Location & tenants
- Location reads 74/100 on livability (#168 in WI, #4,459 nationally) — a middle-class / working-renter tenant base. Strengths: crime A+, cost of living A+, housing A+; Watch: amenities F, commute F, health & safety D-.
- Prescott School District (town): math 48% / reading 51% proficiency, ranked #47 of 342 in WI (top 14%) — families likely to look elsewhere, expect single-tenant / working-renter base with shorter leases; only 15% free/reduced lunch — higher-income household profile.
- Zoned schools: Malone Elementary (math 67% / reading 56%, grade B, #95 of 1,041 statewide, top 9%, 460 students, 21% FRL); Prescott Middle (math 35% / reading 47%, grade F, #139 of 383 statewide, top 37%, 275 students, 20% FRL); Prescott High (math 42% / reading 52%, grade D-, #50 of 483 statewide, top 11%, 430 students, 14% FRL) — zoned schools at 18% FRL track the district average.
- Market conditions: 42 active listings in the ZIP; 191 units permitted in Pierce County in 2024 (0 in 5+ unit buildings).
Forward outlook
- Local home prices are declining (-3.0%/yr); year-one equity from $2k of loan paydown is wiped out by about $10k of value loss. Plan a longer hold.
- Pierce County population projected at -16% by 2050 — secular population decline; favor cash flow + early exit over multi-decade hold.
Negotiation context
- It's been on market 62 days — a 6% lower offer ($329k) is reasonable based on typical stale-listing flexibility.
Questions for the listing agent
- It's been on market 62 days. Have you received any prior offers? Is the seller open to a 10% concession, seller financing, or rate buy-down credit?
- Can we see the unit-by-unit rent roll, current vacancy, and any below-market leases? What's the average tenancy length?
- What capital expenditures (roof, boiler, parking lot, exteriors) have been made in the last 5 years, and what's planned in the next 2?
- Built in 1975 — when were the roof, HVAC, electrical panel, plumbing, and water heater last replaced?
- Why hasn't it sold? Are there any deal-killer items the seller is aware of (foundation, flood, title, zoning, code violations)?
- Is there a deadline driving the sale (1031 exchange, divorce, estate, relocation)? That informs how much negotiation room exists.
- Schools are A-rated — typically a magnet for longer-tenancy family renters. What's the average tenant stay here, and is there a school-zone premium baked into asking?
- The area grade is low — what's the realistic commute time and amenity access for the typical tenant pool here? Any planned neighborhood developments (good or bad) we should know about?
- What's the average days-on-market for RENTAL listings here right now (not sales)? A rising rental-DOM trend means longer vacancies and softer asking-rent achievability than the comps imply.
- What's the recent tenant-quality profile in this submarket — average credit score on applications, eviction rate, late-payment / NSF rate, and stable-employment percentage? A property-management company in the area should have these aggregated.
- How much new apartment / multifamily construction is in the pipeline within 1–3 miles? Heavy new supply (>2% of stock underway) typically softens rents 12–24 months out; light construction supports rent growth.
Investment metrics
- 1% rule
- 0.90% ✗
- Cap rate
- 6.56%
- Cash-on-cash
- 0.96%
- DSCR
- 1.04
- GRM
- 9.2
CMA / ARV
No comps found within radius.
Projected returns pro-forma
-3.0% appreciation · 3.0% rent growth · sell at horizon
- IRR
- -14.8%
- Equity multiple
- 0.47×
- Total profit
- $-51,663
- Equity at exit
- $52,171
- IRR
- -6.1%
- Equity multiple
- 0.61×
- Total profit
- $-38,370
- Equity at exit
- $30,253
Cash invested: $97,972 (down + closing). Projections, not guarantees.
Landlord ↔ Tenant lean methodology
- Overall (STATE)
- 73 Landlord-Friendly
- State Wisconsin
- 73 Landlord-Friendly · R+2
- County
- — inherits STATE
- City
- — inherits STATE
ZIP-level market 54021
- Active inventory
- 42
- Price-to-rent
- 18.5×
Monthly cashflow live
- Estimated rent
- $3,160 medium interval (Pro) →
- Mortgage (P&I)
- −$1,835
- Tax est. 1.5%
- −$437 /mo · $5,248/yr
- Insurance
- −$146
- HOA
- −$0
- Vacancy / Maint / Mgmt
- −$664
- Net cashflow
- $78
Break-even live
Sensitivity live
| Price | -10% $320 | -5% $199 | +0% $78 | +5% $-43 | +10% $-163 |
|---|---|---|---|---|---|
| Rent | -10% $-171 | -5% $-47 | +0% $78 | +5% $203 | +10% $328 |
| Rate | -1.0pp $255 | -0.5pp $167 | base $78 | +0.5pp $-12 | +1.0pp $-105 |
2-unit breakdown (identical units grouped — click to expand)
| Units | Beds | Baths | Est. rent |
|---|---|---|---|
| 2× units | 3 | 1 | $3,160 |
| #1 | 3 | 1 | $1,580 |
| #2 | 3 | 1 | $1,580 |
| Total (2 units) | $3,160 | ||
UW: 25.0% down · 7.5% · 30yr · 1.5% tax · 5.0% vac · 8.0% maint · 8.0% mgmt
Financing live
Cash to close
- Down payment
- $87,475
- Closing costs
- $10,497
- Reserves months
- —
- Total cash needed
- —
Loan-product check · same deal, 3 products live
Conventional
25% down · 7.5% · 30yr
- Down + closing
- —
- Monthly P&I
- —
- Monthly cashflow
- —
- DSCR
- —
- Eligible?
- —
Personal DTI + credit; lowest rate.
DSCR
20% down · 8.5% · 30yr
- Down + closing
- —
- Monthly P&I
- —
- Monthly cashflow
- —
- DSCR
- —
- Eligible?
- —
No personal income docs; deal must DSCR.
Hard money
10% down · 12.0% · 12mo
- Down + closing
- —
- Monthly P&I
- —
- Monthly cashflow
- —
- DSCR
- —
- Eligible?
- —
Short-term bridge; refi at stabilization.
Listing history 7 events
-
2026-06-02statusdays on market $349,900 Pending 62 DOM
-
2026-06-01days on market $349,900 Contingent 61 DOM
-
2026-05-31days on market $349,900 Contingent 60 DOM
-
2026-05-11historical Contingent
-
2026-04-27price $349,900
-
2026-04-16price $360,000
-
2026-04-01$375,000 Active
ⓘ Source: listings_history table (triggers on properties + properties_extension) + one-shot
backfill from property_details.listing_events for pre-trigger history.
Climate risk First Street
- Flood 1/10 Low FEMA zone X (unshaded) · 0% chance over 30 yrs
- Wildfire 1/10 Low
- Heat 2/10 Low 7 d/yr ≥100°F today · 14 d/yr by 30 yrs out
- Wind 2/10 Low
- Air quality 2/10 Low 1 unhealthy d/yr today · 1 by 30 yrs out
Nearby sold comps map
Loading sold comps map…
Walkable amenities ~0.75 mi
Loading nearby amenities…
Taxation est. · year 1
- Rental income
- $37,920
- − Mortgage interest
- −$19,600
- − Property taxes
- −$5,248
- − Insurance
- −$1,750
- − Repairs & maintenance
- −$3,034
- − Management
- −$3,034
- − Depreciation
- −$10,179
- Taxable loss
- −$4,924
- Est. tax savings @ 24.0%
- +$1,182
- After-tax cash flow
- $2,122/yr
For passive investors: Depreciation is non-cash, so a rental often shows a tax loss while cash-flowing — sheltering income. Rental losses are passive: they offset passive income freely, and up to $25,000/yr can offset ordinary (W-2) income if you actively participate and your MAGI is under $100k (phasing out to $0 by $150k); unused losses carry forward. On sale, claimed depreciation is recaptured at up to 25%, and gains may owe capital-gains tax (a 1031 exchange can defer both). Figures are a year-1 estimate at your 24.0% rate — not tax advice; consult a CPA.
Condition & rehab AI · 13 photos
This well-maintained, recently updated duplex offers a good investment opportunity with a good condition score and minimal repairs needed.
Value-add opportunities
- Both Painting exterior and interior — Enhances curb appeal and interior aesthetics
- Both Landscaping and grading — Improves curb appeal and adds value
- Both New flooring in bathrooms — Enhances aesthetics and functionality
Renovation cost estimate screening
Value-add ROI direction
- Both Painting exterior and interior — Enhances curb appeal and interior aesthetics ↑
- Both Landscaping and grading — Improves curb appeal and adds value ↑
- Both New flooring in bathrooms — Enhances aesthetics and functionality ↑
ⓘ Cost ranges are severity-bucket heuristics (US national rule-of-thumb). Get contractor quotes + a written scope before underwriting a rehab budget.
Schools (NCES district)
- District
- Prescott School District
- NCES district ID
- 5512240
- Math proficiency
- 48% ▼ -7.00%
- Reading proficiency
- 51% ▼ -4.00%
- Median HH income
- $79,628
- Composite
- 45.2/100
- National rank
- #2673
- State rank
- #47 of 342 in WI
Livability — Prescott
- Score
- 74/100
- State rank
- #168
- US rank
- #4459
Category grades
Schools grade is shown separately in the Schools card above.
Census & demographics
- Census place
- Prescott, WI
- Population (ZIP)
- 7,341
Population outlook (Pierce County) Hauer SSP2
- Today (2025)
- 41,245 people
- By 2030
- 40,340 · -2.2%
- By 2040
- 37,649 · -8.7%
- By 2050
- 34,595 · -16.1%
- By 2075
- 29,067 · -29.5%
- By 2100
- 25,183 · -38.9%
Race, ethnicity, and origin ACS 2023
- Neighborhood character
- Predominantly White (88%)
- Race & ethnicity
- White 88% Two or more races 6% Hispanic / Latino 4% Asian 2%
- Common ancestry
- Portuguese 11% Romanian 3% Scottish 2%
- Foreign-born
- 2% · China
- Languages at home
- 99% English-only · Other Asian/Pacific 1%
Political lean MEDSL · Pierce
- 2024 margin
- R (+16.8) · D 40.2% · R 56.9% · Other 2.9%
- 2008→2024 swing
- -25.8pp toward R · 2008: 9.0pp · 2024: -16.8pp
- All cycles
- 2024: R+16.8 2020: R+12.9 2016: R+13.7 2012: R+0.8 2008: D+9.0
Not yet ingested
- Civics
- —
Market trends
- HPI YoY
- ▼ -117.38%
- Current HPI
- 208.9714
- Rent YoY
- —
- Metro
- —
- State GDP YoY
- ▲ 2.10%
- F500 in state
- 20
Industry mix (Fortune 500 HQ in WI)
| Industry | F500 HQs | Revenue |
|---|---|---|
| Industrial Machinery | 4 | $23B |
|
||
| Industrial Technology | 2 | $36B |
|
||
| Insurance | 1 | $36B |
|
||
| Professional Services | 1 | $19B |
|
||
| Utilities | 1 | $9B |
|
||
| Consumer Goods | 1 | $3B |
|
||
Price history
-6.7% since first listed4 events — show timeline
- 2026-05-11 Contingent — RANWW
- 2026-04-27 Price Changed $349,900 RANWW
- 2026-04-16 Price Changed $360,000 RANWW
- 2026-04-01 Listed $375,000 RANWW
Cash-flow waterfall
monthlySold comps — $/sqft
last 12 mo · ≤1 miLoading sold comps…