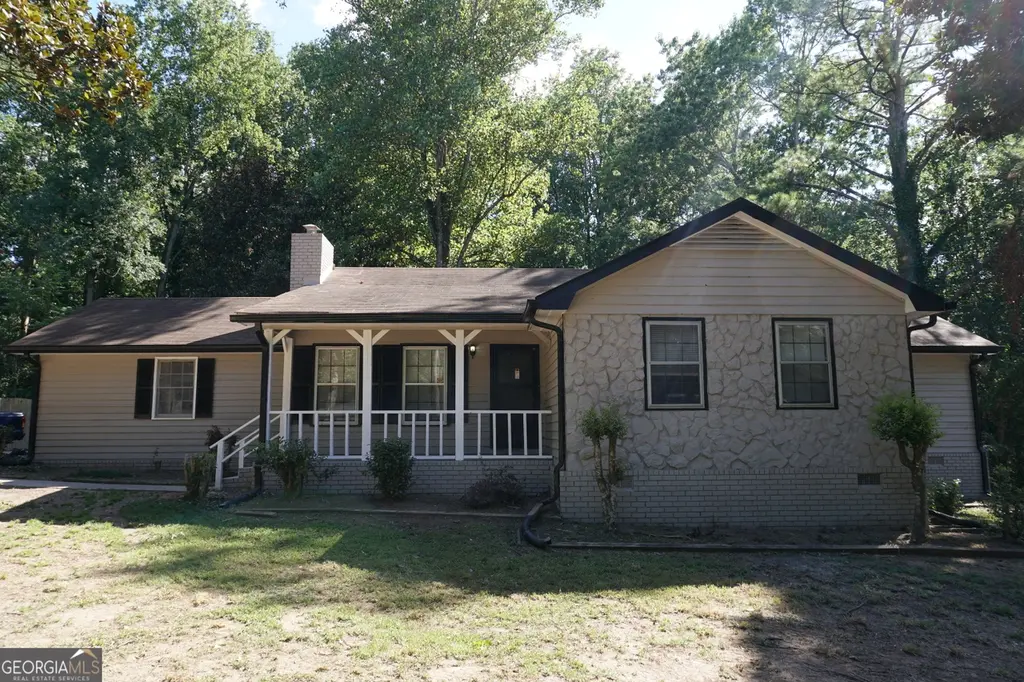
9243 Seminole Rd · Jonesboro, GA
Flood risk 1/10 · Minimal
- FEMA flood zone
- X (unshaded)
- Chance of flooding over 30 yrs
- 0.0%
- Est. flood insurance / yr
- $507 – $1,088
Fire risk 3/10 · Minor
- Est. fire insurance / yr
- $963 – $1,789
Heat risk 5/10 · Moderate
- Hot days now (above 105°F)
- 7 days/yr
- Hot days in 30 yrs
- 17 days/yr
Wind risk 6/10 · Moderate
- Chance of severe wind over 30 yrs
- 27.0%
Air-quality risk 4/10 · Minor
- Unhealthy air days now
- 5 days/yr
- Unhealthy air days in 30 yrs
- 6 days/yr
Risk factors via First Street. Map © Google.
Why this score? — see what drove the D grade
The composite is a weighted blend of 9 inputs, each scored 0–100. Each bar is that input's sub-score; the figure is the points it added to the 100-point composite (weight × sub-score).
- ARV discount +13.0/15.0
- Cash flow +11.4/30.0
- Livability +3.6/5.0
- DSCR +3.4/10.0
- 1% rule +3.1/10.0
- Rent growth +3.0/5.0
- Condition / age +2.5/5.0
- Schools +1.3/10.0
- Appreciation +0.0/10.0
$279,810
🖨 Deal sheet (PDF) 📄 Offer letter ✓ Due diligence
Listing remarks MLS
Must see! Priced to Sell. Recently updated. Spacious ranch in sought after Thornton Estates subd with no HOA. This move-in ready home has an open concept floor plan with good size level lot. New interior paint with updated kitchen with ss appliances and granite countertop. Good size deck and sunroom overlook private backyard that is fenced in. Large owner's suite with double vanities. Nice size secondary bedrooms. New luxury flooring (LVP) throughout the whole house. Ample parking with side entry carport. Convenient and close to almost everything! Investor owned - No disclosure (owner never lived here). Pls schedule with ShowingTime to show. Buyer and/or Buyer's Agent to Verify All information.
Key facts
- Private backyard
- Fenced in
- Luxury flooring
Tags
Neighborhood map
What this means for you Summary
Snapshot
- This is a 4-bed/2.0-bath single-family listed at $280k.
Deal economics
- At list price, monthly cash flow is $-95 ($-1k/yr) — negative.
- To cash-flow at today's rent, offer at most $263k (6.0% below list).
- To meet the 1% rule (rent ≥ 1% of price), the offer needs to be $227k (18.9% below list).
- Recommended offer: $227k (18.9% below list) — sets the bar for 1% rule.
Location & tenants
- Location reads 72/100 on livability (#63 in GA) — a middle-class / working-renter tenant base. Strengths: cost of living A+, housing A-; Watch: crime C-, employment D, commute F.
- Clayton County (suburban): math 11% / reading 20% proficiency, ranked #155 of 174 in GA (top 89%) — low school quality limits family demand, transient renter base, plan for 1-2y turnover; 78% free/reduced lunch — lower-income household profile, screen leases tightly.
- Zoned schools: Suder Elementary School (math 15% / reading 5%, grade F, #1,076 of 1,228 statewide, top 89%, 631 students, 90% FRL); M. D. Roberts Middle School (math 22% / reading 37%, grade F, #249 of 470 statewide, top 55%, 852 students, 90% FRL); Jonesboro High School (math 12% / reading 17%, grade F, #315 of 424 statewide, top 76%, 1,535 students, 91% FRL).
- Market conditions: Rents rising (+2.1%/yr); 275 active listings in the ZIP; 9 comparable units currently listed for rent nearby; rentals at typical pace (median 21d on market — plan ~3-4 weeks tenant-placement turnaround); 865 units permitted in Clayton County in 2024 (448 in 5+ unit buildings).
- This rent runs 41% of the median local income ($67k/yr) — at the standard rent-burdened threshold; future hikes will face affordability resistance.
Forward outlook
- Local home prices are declining (-3.0%/yr); year-one equity from $2k of loan paydown is wiped out by about $8k of value loss. Plan a longer hold.
- Clayton County population projected at +29% by 2050 — long-run rental-demand tailwind backs the buy-and-hold thesis.
Negotiation context
- It's been on market 137 days — a 12% lower offer ($246k) is reasonable based on typical stale-listing flexibility.
- 3 sale attempts with the ask held roughly flat each time — persistent listings suggest the price (not the market) is what's stuck; bring a comps-based counter.
- Current owner paid $97k; list at $280k implies a 188% gain — meaningful room to come down on a strong offer.
Risks & watch-outs
- Climate carrying-cost: major wind risk, 27% chance of damaging wind over 30y; extreme-heat days projected 7→17/yr by 2055 (HVAC capex compounding) — expect insurance premiums to compound above CPI over the hold.
Questions for the listing agent
- What do current leases actually rent for vs. the listed asking? Can we see a recent rent roll and the last 12 months of T-12 income?
- It's been on market 137 days. Have you received any prior offers? Is the seller open to a 19% concession, seller financing, or rate buy-down credit?
- Built in 1977 — when were the roof, HVAC, electrical panel, plumbing, and water heater last replaced?
- Why hasn't it sold? Are there any deal-killer items the seller is aware of (foundation, flood, title, zoning, code violations)?
- Is there a deadline driving the sale (1031 exchange, divorce, estate, relocation)? That informs how much negotiation room exists.
- Schools are F-rated, which usually means shorter tenancies and higher turnover. Who's the typical renter profile here, and what's been the actual vacancy rate?
- The area grade is low — what's the realistic commute time and amenity access for the typical tenant pool here? Any planned neighborhood developments (good or bad) we should know about?
- What's the average days-on-market for RENTAL listings here right now (not sales)? A rising rental-DOM trend means longer vacancies and softer asking-rent achievability than the comps imply.
- What's the recent tenant-quality profile in this submarket — average credit score on applications, eviction rate, late-payment / NSF rate, and stable-employment percentage? A property-management company in the area should have these aggregated.
- How much new for-sale + rental construction is in the pipeline within 1–3 miles? Heavy new supply typically softens prices + rents 12–24 months out; constrained supply supports both.
Investment metrics
- 1% rule
- 0.81% ✗
- Cap rate
- 5.88%
- Cash-on-cash
- -1.46%
- DSCR
- 0.94
- GRM
- 10.3
CMA / ARV
- ARV (median comp)
- $318,592
- List price
- $279,810
- Delta
- -12.17%
- Verdict
- UNDERPRICED
- Comps
- 20 within 1.0 mi
Show comp detail 12 sales within ~0.75 mi
| Address | Dist | Beds/Ba | Sqft | Sold | Price | $/sf | Match |
|---|---|---|---|---|---|---|---|
| 9183 Snipe Ln | 0.36mi | 4/2.5 | 2,053 (-2%) | 1mo | $281,000 | $137 | 78 |
| 9123 Thornton Blvd | 0.25mi | 4/2.0 | 2,120 (+2%) | 15mo | $316,500 | $149 | 74 |
| 9176 Chickasaw Ct | 0.44mi | 3/2.5 (-1) | 2,031 (-3%) | 1mo | $280,000 | $138 | 68 |
| 9214 Brave Ct | 0.23mi | 3/2.0 (-1) | 2,197 (+5%) | 13mo | $272,000 | $124 | 65 |
| 2106 Fair Ridge Ct | 0.59mi | 4/2.5 | 2,024 (-3%) | 6mo | $312,000 | $154 | 61 |
| 1783 Cheyenne Trl | 0.36mi | 4/3.5 | 1,958 (-6%) | 8mo | $350,000 | $179 | 60 |
| 2135 Fairlane Ct | 0.73mi | 4/2.5 | 2,016 (-3%) | 8mo | $260,000 | $129 | 51 |
| 1747 Deer Crossing Cir | 0.45mi | 4/3.0 | 1,917 (-8%) | 14mo | $299,500 | $156 | 50 |
| 9492 Deer Crossing Trce | 0.63mi | 4/2.5 | 2,284 (+10%) | 5mo | $243,000 | $106 | 48 |
| 1664 Pinto Trl | 0.46mi | 5/3.0 (+1) | 2,380 (+14%) | 3mo | $327,000 | $137 | 44 |
| 9272 Fairgreen Ct | 0.68mi | 3/2.5 (-1) | 2,211 (+6%) | 14mo | $336,500 | $152 | 39 |
| 2088 Noah's Ark Rd | 0.66mi | 3/2.0 (-1) | 1,802 (-14%) | 12mo | $456,000 | $253 | 31 |
Match score weights: distance 35% · size 25% · config 20% · recency 20%. Top-matched comps best support the ARV.
Projected returns pro-forma
-3.0% appreciation · 2.15% rent growth · sell at horizon
- IRR
- -19.6%
- Equity multiple
- 0.32×
- Total profit
- $-53,326
- Equity at exit
- $41,721
- IRR
- -14.3%
- Equity multiple
- 0.21×
- Total profit
- $-61,985
- Equity at exit
- $24,193
Cash invested: $78,347 (down + closing). Projections, not guarantees.
Landlord ↔ Tenant lean methodology
- Overall (STATE)
- 90 Strongly Landlord-Friendly
- State Georgia
- 90 Strongly Landlord-Friendly · R+3
- County
- — inherits STATE
- City
- — inherits STATE
ZIP-level market 30236
- Rents YoY
- 2.1%
- Active inventory
- 275
- Price-to-rent
- 10.3×
Monthly cashflow live
- Estimated rent
- $2,270 high interval (Pro) →
- Mortgage (P&I)
- −$1,467
- Tax from tax record
- −$304 /mo · $3,653/yr
- Insurance
- −$117
- HOA
- −$0
- Vacancy / Maint / Mgmt
- −$477
- Net cashflow
- $-95
Break-even live
Sensitivity live
| Price | -10% $63 | -5% $-16 | +0% $-95 | +5% $-174 | +10% $-254 |
|---|---|---|---|---|---|
| Rent | -10% $-275 | -5% $-185 | +0% $-95 | +5% $-6 | +10% $84 |
| Rate | -1.0pp $46 | -0.5pp $-24 | base $-95 | +0.5pp $-168 | +1.0pp $-242 |
UW: 25.0% down · 7.5% · 30yr · 1.5% tax · 5.0% vac · 8.0% maint · 8.0% mgmt
Financing live
Cash to close
- Down payment
- $69,952
- Closing costs
- $8,394
- Reserves months
- —
- Total cash needed
- —
Loan-product check · same deal, 3 products live
Conventional
25% down · 7.5% · 30yr
- Down + closing
- —
- Monthly P&I
- —
- Monthly cashflow
- —
- DSCR
- —
- Eligible?
- —
Personal DTI + credit; lowest rate.
DSCR
20% down · 8.5% · 30yr
- Down + closing
- —
- Monthly P&I
- —
- Monthly cashflow
- —
- DSCR
- —
- Eligible?
- —
No personal income docs; deal must DSCR.
Hard money
10% down · 12.0% · 12mo
- Down + closing
- —
- Monthly P&I
- —
- Monthly cashflow
- —
- DSCR
- —
- Eligible?
- —
Short-term bridge; refi at stabilization.
Rent comps 9 comps
| Address | Beds | Baths | Sqft | Rent | $/sqft | DOM | Units | Dist |
|---|---|---|---|---|---|---|---|---|
| 9412 Waters Edge Dr Jonesboro, GA | 4.0 | 3.0 | 2712 | $2,550 | $0.94 | 7d | 1 | 0.27mi |
| 9177 Chickasaw Ct Jonesboro, GA | 3.0 | 2.5 | 2131 | $1,925 | $0.90 | 0d | 1 | 0.46mi |
| 1659 Deer Crossing Way Jonesboro, GA | 3.0 | 2.5 | 2582 | $2,176 | $0.84 | 7d | 1 | 0.56mi |
| 9362 Deer Crossing Lk Jonesboro, GA | 4.0 | 3.5 | 2576 | $2,535 | $0.98 | 45d | 1 | 0.58mi |
| 8671 Twin Oaks Dr Jonesboro, GA | 4.0 | 2.0 | 2068 | $3,250 | $1.57 | 45d | 1 | 1.06mi |
| 8691 Twin Oaks Dr Jonesboro, GA | 3.0 | 2.0 | 1752 | $1,790 | $1.02 | 20d | 1 | 1.07mi |
| 1320 Silverstone Trl Jonesboro, GA | 3.0 | 2.0 | 1954 | $2,045 | $1.05 | 18d | 1 | 1.21mi |
| 9570 Briar Creek Ln Jonesboro, GA | 3.0 | 2.0 | 1820 | $1,795 | $0.99 | 26d | 1 | 1.33mi |
| 9376 Carnes Crossing Cir Jonesboro, GA | 4.0 | 2.5 | 2284 | $2,525 | $1.11 | 21d | 1 | 1.38mi |
Listing history 27 events
-
2026-06-21days on market $279,810 Active 137 DOM
-
2026-06-18days on market $279,810 Active 134 DOM
-
2026-06-17days on market $279,810 Active 133 DOM
-
2026-06-16days on market $279,810 Active 132 DOM
-
2026-06-15days on market $279,810 Active 131 DOM
-
2026-06-13days on market $279,810 Active 129 DOM
-
2026-06-09days on market $279,810 Active 125 DOM
-
2026-06-08days on market $279,810 Active 124 DOM
-
2026-06-07days on market $279,810 Active 123 DOM
-
2026-06-04days on market $279,810 Active 120 DOM
-
2026-06-03days on market $279,810 Active 119 DOM
-
2026-06-02days on market $279,810 Active 118 DOM
-
2026-06-01days on market $279,810 Active 117 DOM
-
2026-05-31days on market $279,810 Active 116 DOM
-
2026-02-04$279,900 New 703-char remark
Show marketing remark (703 chars)
Must see! Priced to Sell. Recently updated. Spacious ranch in sought after Thornton Estates subd with no HOA. This move-in ready home has an open concept floor plan with good size level lot. New interior paint with updated kitchen with ss appliances and granite countertop. Good size deck and sunroom overlook private backyard that is fenced in. Large owner's suite with double vanities. Nice size secondary bedrooms. New luxury flooring (LVP) throughout the whole house. Ample parking with side entry carport. Convenient and close to almost everything! Investor owned - No disclosure (owner never lived here). Pls schedule with ShowingTime to show. Buyer and/or Buyer's Agent to Verify All information.
-
2026-01-22historical
-
2025-12-09price $285,900
-
2025-11-19price $289,900
-
2025-10-15$294,900 New
-
2025-09-15price $319,500
-
2025-09-15historical
-
2025-09-12price $309,960
-
2025-09-03price $315,900
-
2025-08-21price $319,500
-
2025-08-13price $324,900
-
2025-07-25$329,400 New
-
1989-10-20soldstatus $97,000
ⓘ Source: listings_history table (triggers on properties + properties_extension) + one-shot
backfill from property_details.listing_events for pre-trigger history.
Tax reassessment forecast GA · Resets to sale price
- Current annual tax
- $3,653 · $304/mo
- Projected year-2 tax
- $3,653 · $304/mo
- Expected delta
- $0/yr ($0/mo · 0.0%)
ⓘ Screening estimate from a state-policy table — verify with the county assessor before closing.
Climate risk First Street
- Flood 1/10 Low FEMA zone X (unshaded) · 0% chance over 30 yrs
- Wildfire 3/10 Moderate
- Heat 5/10 Major 7 d/yr ≥105°F today · 17 d/yr by 30 yrs out
- Wind 6/10 Major 27% chance of damaging wind over 30 yrs
- Air quality 4/10 Moderate 5 unhealthy d/yr today · 6 by 30 yrs out
Nearby sold comps map
Loading sold comps map…
Walkable amenities ~0.75 mi
Loading nearby amenities…
Taxation est. · year 1
- Rental income
- $27,238
- − Mortgage interest
- −$15,674
- − Property taxes
- −$3,653
- − Insurance
- −$1,399
- − Repairs & maintenance
- −$2,179
- − Management
- −$2,179
- − Depreciation
- −$8,140
- Taxable loss
- −$5,986
- Est. tax savings @ 24.0%
- +$1,437
- After-tax cash flow
- $294/yr
For passive investors: Depreciation is non-cash, so a rental often shows a tax loss while cash-flowing — sheltering income. Rental losses are passive: they offset passive income freely, and up to $25,000/yr can offset ordinary (W-2) income if you actively participate and your MAGI is under $100k (phasing out to $0 by $150k); unused losses carry forward. On sale, claimed depreciation is recaptured at up to 25%, and gains may owe capital-gains tax (a 1031 exchange can defer both). Figures are a year-1 estimate at your 24.0% rate — not tax advice; consult a CPA.
Schools (NCES district)
- District
- Clayton County
- NCES district ID
- 1301230
- Math proficiency
- 11% ▼ -13.00%
- Reading proficiency
- 20% ▼ -9.00%
- Median HH income
- $42,266
- Composite
- 13.41/100
- National rank
- #9527
- State rank
- #155 of 174 in GA
Livability — Jonesboro
- Score
- 72/100
- State rank
- #63
- US rank
- #6030
Category grades
Schools grade is shown separately in the Schools card above.
Census & demographics
- County
- Clayton County · 230,153 people
- City population
- 93,280
- Metro
- Atlanta-Sandy Springs-Alpharetta, GA
- Population (ZIP)
- 50,089
- Household income
- $66,973
- Rent vs Own
- Severe rent burden
- 2024.0
Population outlook (Clayton County) Hauer SSP2
- Today (2025)
- 310,777 people
- By 2030
- 329,762 · +6.1%
- By 2040
- 368,052 · +18.4%
- By 2050
- 401,196 · +29.1%
- By 2075
- 472,488 · +52.0%
- By 2100
- 500,446 · +61.0%
Race, ethnicity, and origin ACS 2023
- Neighborhood character
- Diverse neighborhood (Simpson 0.56)
- Race & ethnicity
- Black 64% White 14% Hispanic / Latino 11% Two or more races 8% Asian 5%
- Hispanic origin (detail)
- Mexican 6% Puerto Rican 1%
- Common ancestry
- Slovak 1% Italian 1% Hispanic 1%
- Foreign-born
- 13% · Canada, Vietnam, China
- Languages at home
- 81% English-only · Spanish 10% Vietnamese 3% French/Haitian/Cajun 2%
Political lean MEDSL · Clayton
- 2024 margin
- Solid D (+69.2) · D 84.3% · R 15.1%
- 2008→2024 swing
- +2.8pp toward D · 2008: 66.4pp · 2024: 69.2pp
- All cycles
- 2024: D+69.2 2020: D+70.9 2016: D+71.9 2012: D+70.1 2008: D+66.4
Not yet ingested
- Civics
- —
Market trends
- HPI YoY
- ▼ -137.02%
- Current HPI
- 204.1778
- Rent YoY
- ▲ 2.15%
- Metro
- Atlanta-Sandy Springs-Alpharetta, GA
- State GDP YoY
- ▲ 2.66%
- F500 in state
- 28
Industry mix (Fortune 500 HQ in GA)
| Industry | F500 HQs | Revenue |
|---|---|---|
| Paper / Packaging | 2 | $29B |
|
||
| Retail | 1 | $160B |
|
||
| Transportation / Logistics | 1 | $91B |
|
||
| Airlines | 1 | $62B |
|
||
| Consumer Goods | 1 | $47B |
|
||
| Utilities | 1 | $25B |
|
||
Price history
+188.6% since first listed13 events — show timeline
- 2026-02-04 Listed $279,900 GAMLS
- 2026-01-22 Listing Removed — GAMLS
- 2025-12-09 Price Changed $285,900 GAMLS
- 2025-11-19 Price Changed $289,900 GAMLS
- 2025-10-15 Listed $294,900 GAMLS
- 2025-09-15 Listing Removed — GAMLS
- 2025-09-15 Price Changed $319,500 GAMLS
- 2025-09-12 Price Changed $309,960 GAMLS
- 2025-09-03 Price Changed $315,900 GAMLS
- 2025-08-21 Price Changed $319,500 GAMLS
- 2025-08-13 Price Changed $324,900 GAMLS
- 2025-07-25 Listed $329,400 GAMLS
- 1989-10-20 Sold (Public Records) $97,000 Public Records
Property tax history
+13.8%/yrLatest (2025): $3,653 · +125.4% YoY. Source: county tax records.
Cash-flow waterfall
monthlySold comps — $/sqft
last 12 mo · ≤1 miLoading sold comps…