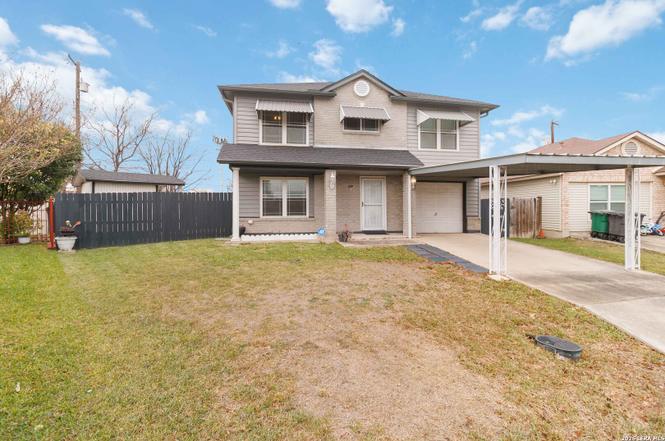
423 Rosa Verde · San Antonio, TX
Flood risk 1/10 · Minimal
- FEMA flood zone
- X (unshaded)
- Chance of flooding over 30 yrs
- 0.0%
- Est. flood insurance / yr
- $507 – $1,088
Fire risk 1/10 · Minimal
- Est. fire insurance / yr
- $1,222 – $2,270
Heat risk 8/10 · Major
- Hot days now (above 108°F)
- 7 days/yr
- Hot days in 30 yrs
- 22 days/yr
Wind risk 8/10 · Major
- Chance of severe wind over 30 yrs
- 80.0%
Air-quality risk 2/10 · Minimal
- Unhealthy air days now
- 1 days/yr
- Unhealthy air days in 30 yrs
- 2 days/yr
Risk factors via First Street. Map © Google.
Why this score? — see what drove the C+ grade
The composite is a weighted blend of 9 inputs, each scored 0–100. Each bar is that input's sub-score; the figure is the points it added to the 100-point composite (weight × sub-score).
- Cash flow +16.0/30.0
- ARV discount +15.0/15.0
- Appreciation +10.0/10.0
- 1% rule +5.3/10.0
- DSCR +5.0/10.0
- Rent growth +4.4/5.0
- Livability +4.0/5.0
- Condition / age +2.5/5.0
- Schools +1.4/10.0
$205,000
🖨 Deal sheet (PDF) 📄 Offer letter ✓ Due diligence
Listing remarks
Welcome to 423 Rosa Verde - your contemporary retreat in the heart of San Antonio! This charming two-story home features 4 bedrooms, 2.5 baths, and 1,552 sq. ft. on a quiet cul-de-sac lot. Enjoy a bright and functional layout with an eat-in kitchen, walk-in pantry, and indoor utility room. The spacious backyard includes chain-link fencing, a storage shed, and a 1-car garage plus carport. Recent upgrades include a new roof with a transferable warranty, adding peace of mind and lasting value. Situated just minutes from downtown San Antonio, you'll love being close to all the excitement of Fiesta, local festivals, riverwalk dining, and year-round city events. Experience the best of downtown l
Key facts
- Cul-de-sac lot
- Utility room
- Spacious backyard
Tags
Property features AI
Finance
- Financial info: Down payment resource available
- HOA & community: Subdivision: VISTA VERDE
Exterior
- Parking: 1-car garage; Rear entry parking
- Utilities: Gas service by CPS; Electricity by CPS; Water by SAWS; City sewer
- Home design: Pre-owned property; Approximate age 32 years
- Construction: Siding exterior (aluminum and vinyl); Composition roof; Slab foundation
- Exterior features: Chain link fence; Storm doors; Cul-de-sac/Dead end location; Paved streets and curbs
Interior
- Kitchen: Eat-in kitchen; Stove/Range; Refrigerator; Dishwasher; Walk-in pantry; Kitchen dimensions: 9 x 9; Solid countertops
- Bedrooms: Master bedroom is split, on the upper level, has a ceiling fan and a full bath; Bedroom 2: 11 x 9; Bedroom 3: 8 x 13; Bedroom 4: 8 x 10; Master bedroom dimensions: 10 x 17
- Flooring: Carpeting; Vinyl flooring
- Bathrooms: 2 full baths and 1 half bath; Master bath with separate tub and shower; Master bath dimensions: 10 x 9
- Heating & cooling: Central heating (electric); Central air conditioning
- Interior features: Ceiling fans; Smoke alarm; Electric water heater; Solid countertops; City garbage service; 1 living area; Eat-in kitchen; Walk-in pantry; Utility room inside; Laundry in closet; Walk-in closets; Attic with pull-down stairs
- Laundry & utility: Washer connection; Dryer connection; Laundry located in closet; Utility room inside
Neighborhood map
What this means for you Summary
Snapshot
- This is a 3-bed/2.5-bath single-family listed at $205k.
Deal economics
- At list price, monthly cash flow is $103 ($1k/yr) — positive.
- The deal already cash-flows at list — no discount required.
- Meets the 1% rule at list price ($2k rent vs $205k).
- Recommended offer: $199k (3.0% below list) — sets the bar for market timing.
- Cap rate 6.9% vs local median 3.8% in San Antonio — top-decile yield for the area; either an underpriced asset or a hidden risk that comps aren't pricing in. Stress-test before assuming the spread holds.
Location & tenants
- Location reads 80/100 on livability (#31 in TX, #1,616 nationally) — a professional / high-income tenant draw. Strengths: amenities A+, commute A+, cost of living A+; Watch: crime F.
- San Antonio ISD (urban): math 12% / reading 22% proficiency, ranked #805 of 826 in TX (top 98%) — low school quality limits family demand, transient renter base, plan for 1-2y turnover; 80% free/reduced lunch — lower-income household profile, screen leases tightly.
- Zoned schools: J T Brackenridge El (math 3% / reading 12%, grade F, #4,301 of 4,322 statewide, top 100%, 525 students, 98% FRL); Tafolla Middle (math 6% / reading 16%, grade F, #1,634 of 1,662 statewide, top 99%, 697 students, 97% FRL); Lanier H S (math 9% / reading 15%, grade F, #1,554 of 1,632 statewide, top 95%, 1,547 students, 97% FRL) — zoned schools average 97% FRL vs 80% district-wide (18 pts higher); higher-poverty schools than district average — tighter screening recommended.
- Market conditions: Rents rising fast (+7.7%/yr); 164 active listings in the ZIP; 40 comparable units currently listed for rent nearby; rentals at typical pace (median 26d on market — plan ~3-4 weeks tenant-placement turnaround); lower-income renter base — watch delinquency; 8,308 units permitted in Bexar County in 2024 (2,506 in 5+ unit buildings).
- At $2,108/mo this rent would consume 78% of the median local household income ($32k/yr) (locally 2789% of renters already pay >50% of income on rent) — very limited rent-growth headroom before tenants either downsize or default.
Forward outlook
- In year one you build about $22k of equity ($1k loan paydown + $20k appreciation (10.0% local appreciation)).
- Bexar County population projected at +50% by 2050 — long-run rental-demand tailwind backs the buy-and-hold thesis.
- At projected returns (10.0% appreciation + 7.7% rent growth), your $57k cash investment doubles in ~3 years — after that, you're playing with house money.
- By year 2, paydown + projected appreciation supports a ~$35k cash-out refi (75% LTV) — recoverable capital for the next deal without selling this one.
Negotiation context
- It's been on market 57 days — a 3% lower offer ($199k) is reasonable based on typical stale-listing flexibility.
- 2 sale attempts with the ask held roughly flat each time — persistent listings suggest the price (not the market) is what's stuck; bring a comps-based counter.
Risks & watch-outs
- Climate carrying-cost: severe wind risk, 80% chance of damaging wind over 30y; extreme-heat days projected 7→22/yr by 2055 (HVAC capex compounding) — expect insurance premiums to compound above CPI over the hold.
Questions for the listing agent
- It's been on market 57 days. Have you received any prior offers? Is the seller open to a 3% concession, seller financing, or rate buy-down credit?
- Is there a deadline driving the sale (1031 exchange, divorce, estate, relocation)? That informs how much negotiation room exists.
- Crime grade is F in this area — have there been break-ins, vandalism, or insurance claims at this property in the last 3 years? What carrier currently insures it and at what premium?
- What's the average days-on-market for RENTAL listings here right now (not sales)? A rising rental-DOM trend means longer vacancies and softer asking-rent achievability than the comps imply.
- What's the recent tenant-quality profile in this submarket — average credit score on applications, eviction rate, late-payment / NSF rate, and stable-employment percentage? A property-management company in the area should have these aggregated.
- How much new for-sale + rental construction is in the pipeline within 1–3 miles? Heavy new supply typically softens prices + rents 12–24 months out; constrained supply supports both.
Investment metrics
- 1% rule
- 1.03% ✓
- Cap rate
- 6.90%
- Cash-on-cash
- 2.15%
- DSCR
- 1.10
- GRM
- 8.1
CMA / ARV
- ARV (on-the-fly)
- $277,808
- Comps found
- 11
Show comp detail 11 sales within ~0.75 mi
| Address | Dist | Beds/Ba | Sqft | Sold | Price | $/sf | Match |
|---|---|---|---|---|---|---|---|
| 423 Rosa Verde | 0.00mi | 4/2.5 (+1) | 1,552 (0%) | 1mo | $205,000 | $132 | 94 |
| 203 Rehmann | 0.61mi | 3/2.0 | 1,448 (-7%) | 7mo | $430,000 | $297 | 53 |
| 3618 Palmwood Ter | 0.67mi | 3/2.5 | 1,676 (+8%) | 8mo | $248,190 | $148 | 48 |
| 3614 Palmwood Ter | 0.67mi | 4/2.0 (+1) | 1,632 (+5%) | 6mo | $257,190 | $158 | 48 |
| 3610 Palmwood Ter | 0.67mi | 4/2.0 (+1) | 1,632 (+5%) | 9mo | $251,900 | $154 | 46 |
| 3626 Palmwood Ter | 0.67mi | 3/2.5 | 1,667 (+7%) | 15mo | $303,275 | $182 | 44 |
| 910 S Main Ave | 0.55mi | 2/2.0 (-1) | 1,472 (-5%) | 19mo | $350,000 | $238 | 44 |
| 215 Nathan | 0.48mi | 3/2.0 | 1,426 (-8%) | 23mo | $525,000 | $368 | 43 |
| 116 Rehmann St | 0.67mi | 2/2.0 (-1) | 1,336 (-14%) | 0mo | $270,000 | $202 | 38 |
| 314 W Cevallos St | 0.53mi | 3/2.0 | 1,764 (+14%) | 17mo | $225,000 | $128 | 36 |
| 238 Keller St | 0.62mi | 2/1.5 (-1) | 1,340 (-14%) | 6mo | $240,000 | $179 | 35 |
Match score weights: distance 35% · size 25% · config 20% · recency 20%. Top-matched comps best support the ARV.
Projected returns pro-forma
10.0% appreciation · 7.73% rent growth · sell at horizon
- IRR
- 27.8%
- Equity multiple
- 3.24×
- Total profit
- $128,840
- Equity at exit
- $184,680
- IRR
- 25.8%
- Equity multiple
- 7.97×
- Total profit
- $400,253
- Equity at exit
- $398,270
Cash invested: $57,400 (down + closing). Projections, not guarantees.
Landlord ↔ Tenant lean methodology
- Overall (STATE)
- 87 Strongly Landlord-Friendly
- State Texas
- 87 Strongly Landlord-Friendly · R+5
- County
- — inherits STATE
- City
- — inherits STATE
ZIP-level market 78207
- Home prices YoY
- 15.2%
- Rents YoY
- 7.7%
- Active inventory
- 164
- Price-to-rent
- 8.1×
Monthly cashflow live
- Estimated rent
- $2,108 high interval (Pro) →
- Mortgage (P&I)
- −$1,075
- Tax from tax record
- −$401 /mo · $4,817/yr
- Insurance
- −$85
- HOA
- −$0
- Vacancy / Maint / Mgmt
- −$443
- Net cashflow
- $103
Break-even live
Sensitivity live
| Price | -10% $219 | -5% $161 | +0% $103 | +5% $45 | +10% $-13 |
|---|---|---|---|---|---|
| Rent | -10% $-63 | -5% $20 | +0% $103 | +5% $186 | +10% $270 |
| Rate | -1.0pp $206 | -0.5pp $155 | base $103 | +0.5pp $50 | +1.0pp $-4 |
UW: 25.0% down · 7.5% · 30yr · 1.5% tax · 5.0% vac · 8.0% maint · 8.0% mgmt
Financing live
Cash to close
- Down payment
- $51,250
- Closing costs
- $6,150
- Reserves months
- —
- Total cash needed
- —
Loan-product check · same deal, 3 products live
Conventional
25% down · 7.5% · 30yr
- Down + closing
- —
- Monthly P&I
- —
- Monthly cashflow
- —
- DSCR
- —
- Eligible?
- —
Personal DTI + credit; lowest rate.
DSCR
20% down · 8.5% · 30yr
- Down + closing
- —
- Monthly P&I
- —
- Monthly cashflow
- —
- DSCR
- —
- Eligible?
- —
No personal income docs; deal must DSCR.
Hard money
10% down · 12.0% · 12mo
- Down + closing
- —
- Monthly P&I
- —
- Monthly cashflow
- —
- DSCR
- —
- Eligible?
- —
Short-term bridge; refi at stabilization.
Rent comps 40 comps
| Address | Beds | Baths | Sqft | Rent | $/sqft | DOM | Units | Dist |
|---|---|---|---|---|---|---|---|---|
| 1011 S Frio St San Antonio, TX | 3.0 | 1.0–3.0 | 1121 | $2,195 | $1.96 | 0d | 31 | 0.11mi |
| 939 S Frio St Unit 3294 San Antonio, TX | 3.0 | 2.0 | 1737 | $2,269 | $1.31 | 0d | 1 | 0.14mi |
| 218 Tampico St San Antonio, TX | 2.0 | 1.0–2.0 | 808 | $1,645 | $2.03 | 0d | 29 | 0.42mi |
| 1102 El Paso St San Antonio, TX | 1.0–3.0 | 1.0–2.0 | 888 | $1,437 | $1.62 | 5d | 1 | 0.44mi |
| 614 Chihuahua St San Antonio, TX | 3.0 | 2.0 | 1082 | $1,400 | $1.29 | 45d | 1 | 0.52mi |
| 314 W Cevallos Unit 1363386P San Antonio, TX | 2.0 | 1.0 | 1969 | $4,264 | $2.17 | 14d | 1 | 0.53mi |
| 302 W Cevallos Unit 1 San Antonio, TX | 2.0 | 1.0 | 1132 | $1,550 | $1.37 | 25d | 1 | 0.55mi |
| 305 Keller St Unit NA San Antonio, TX | 3.0 | 2.0 | 1200 | $1,800 | $1.50 | 16d | 1 | 0.57mi |
| 308 Keller St San Antonio, TX | 3.0 | 2.0 | 1296 | $3,400 | $2.62 | 45d | 1 | 0.58mi |
| 110 S Laredo St San Antonio, TX | 2.0 | 1.0–2.0 | 888 | $4,930 | $5.55 | 0d | 85 | 0.65mi |
| 203 Nogalitos St #5 San Antonio, TX | 3.0 | 2.5 | 1872 | $3,100 | $1.66 | 25d | 1 | 0.66mi |
| 3610 Palmwood Ter San Antonio, TX | 4.0 | 2.0 | 1634 | $1,799 | $1.10 | 45d | 1 | 0.68mi |
| 215 E Cevallos San Antonio, TX | 2.0 | 1.0–3.0 | 913 | $2,660 | $2.91 | 0d | 22 | 0.70mi |
| 100 N Santa Rosa San Antonio, TX | 3.0 | 1.0–3.0 | 1299 | $3,845 | $2.96 | 0d | 37 | 0.70mi |
| 321 King William San Antonio, TX | 3.0 | 2.0 | 1530 | $3,700 | $2.42 | 25d | 1 | 0.73mi |
| 214 Dwyer Ave San Antonio, TX | 2.0 | 2.0 | 1062 | $1,570 | $1.48 | 45d | 1 | 0.74mi |
| 314 Maryland Unit 202 #202 San Antonio, TX | 2.0 | 2.5 | 1065 | $1,475 | $1.38 | 45d | 1 | 0.80mi |
| 215 Beauregard St Unit B San Antonio, TX | 2.0 | 1.0 | 1434 | $2,000 | $1.39 | 45d | 1 | 0.81mi |
| 302 E Cevallos St Unit 1 San Antonio, TX | 2.0 | 1.0 | 1132 | $1,550 | $1.37 | 25d | 1 | 0.83mi |
| 262 E Cevallos San Antonio, TX | 2.0 | 2.5 | 1354 | $2,055 | $1.52 | 45d | 1 | 0.83mi |
| 301 E Cevallos San Antonio, TX | 2.0 | 1.0–2.5 | 983 | $1,819 | $1.85 | 0d | 13 | 0.84mi |
| 610 W Market St Unit 2915 San Antonio, TX | 2.0 | 2.0 | 1497 | $3,800 | $2.54 | 25d | 1 | 0.85mi |
| 216 E Fest St San Antonio, TX | 3.0 | 3.0 | 1944 | $2,300 | $1.18 | 19d | 1 | 0.88mi |
| 415 Furnish Ave San Antonio, TX | 3.0 | 2.0 | 1670 | $1,995 | $1.19 | 19d | 1 | 0.89mi |
| 330 Clay St #28 San Antonio, TX | 3.0 | 2.5 | 1670 | $2,400 | $1.44 | 45d | 1 | 0.90mi |
| 330 Clay St #24 San Antonio, TX | 2.0 | 2.0 | 1424 | $2,395 | $1.68 | 14d | 1 | 0.90mi |
| 143 E Commerce St San Antonio, TX | 1.0–3.0 | 1.0–3.5 | 1442 | $9,885 | $6.85 | 0d | 15 | 0.91mi |
| 1820 W Houston St San Antonio, TX | 3.0 | 2.0 | 1132 | $2,300 | $2.03 | 45d | 1 | 0.91mi |
| 300 N Main Ave San Antonio, TX | 3.0 | 1.0–2.5 | 1153 | $10,437 | $9.05 | 0d | 98 | 0.95mi |
| 110 Dowdy St San Antonio, TX | 3.0 | 1.0 | 1120 | $1,395 | $1.25 | 25d | 1 | 1.02mi |
| 147 Saint Francis Ave San Antonio, TX | 3.0 | 2.0 | 1224 | $1,800 | $1.47 | 6d | 1 | 1.02mi |
| 222 E Houston St San Antonio, TX | 1.0–2.0 | 1.0–2.0 | 1187 | $2,350 | $1.98 | 22d | 1 | 1.04mi |
| 105 Forrest Ave San Antonio, TX | 3.0 | 3.0 | 2202 | $2,199 | $1.00 | 22d | 1 | 1.05mi |
| 111 Leigh St Unit 2 San Antonio, TX | 2.0 | 1.0 | 1137 | $1,200 | $1.06 | 45d | 1 | 1.10mi |
| 717 N Colorado St San Antonio, TX | 3.0 | 1.0 | 1100 | $1,199 | $1.09 | 45d | 1 | 1.12mi |
| 222 Losoya St Unit 202 San Antonio, TX | 2.0 | 2.0 | 2000 | $3,500 | $1.75 | 45d | 1 | 1.13mi |
| 222 Losoya St Unit 201 San Antonio, TX | 2.0 | 2.0 | 1750 | $2,500 | $1.43 | 45d | 1 | 1.13mi |
| 2246 W Houston St San Antonio, TX | 4.0 | 3.0 | 1654 | $2,100 | $1.27 | 12d | 1 | 1.14mi |
| 2120 Monterey St Unit 102 San Antonio, TX | 2.0 | 2.0 | 1220 | $1,450 | $1.19 | 13d | 1 | 1.15mi |
| 2120 Monterey St Unit 102 San Antonio, TX | 2.0 | 2.0 | 1220 | $1,490 | $1.22 | 45d | 1 | 1.15mi |
Listing history 7 events
-
2026-05-01status Pending
-
2026-04-24historical Active Option
-
2026-04-10status Back on Market
-
2026-02-27status Pending
-
2026-02-18historical Active Option
-
2026-01-22$205,000 New
-
1995-02-01soldstatus
ⓘ Source: listings_history table (triggers on properties + properties_extension) + one-shot
backfill from property_details.listing_events for pre-trigger history.
Tax reassessment forecast TX · Resets to sale price
- Current annual tax
- $4,817 · $401/mo
- Projected year-2 tax
- $4,817 · $401/mo
- Expected delta
- $0/yr ($0/mo · 0.0%)
ⓘ Screening estimate from a state-policy table — verify with the county assessor before closing.
Climate risk First Street
- Flood 1/10 Low FEMA zone X (unshaded) · 0% chance over 30 yrs
- Wildfire 1/10 Low
- Heat 8/10 Severe 7 d/yr ≥108°F today · 22 d/yr by 30 yrs out
- Wind 8/10 Severe 80% chance of damaging wind over 30 yrs
- Air quality 2/10 Low 1 unhealthy d/yr today · 2 by 30 yrs out
Nearby sold comps map
Loading sold comps map…
Walkable amenities ~0.75 mi
Loading nearby amenities…
Taxation est. · year 1
- Rental income
- $25,290
- − Mortgage interest
- −$11,483
- − Property taxes
- −$4,817
- − Insurance
- −$1,025
- − Repairs & maintenance
- −$2,023
- − Management
- −$2,023
- − Depreciation
- −$5,964
- Taxable loss
- −$2,045
- Est. tax savings @ 24.0%
- +$491
- After-tax cash flow
- $1,727/yr
For passive investors: Depreciation is non-cash, so a rental often shows a tax loss while cash-flowing — sheltering income. Rental losses are passive: they offset passive income freely, and up to $25,000/yr can offset ordinary (W-2) income if you actively participate and your MAGI is under $100k (phasing out to $0 by $150k); unused losses carry forward. On sale, claimed depreciation is recaptured at up to 25%, and gains may owe capital-gains tax (a 1031 exchange can defer both). Figures are a year-1 estimate at your 24.0% rate — not tax advice; consult a CPA.
Schools (NCES district)
- District
- San Antonio ISD
- NCES district ID
- 4838730
- Math proficiency
- 12% ▼ -21.00%
- Reading proficiency
- 22% ▼ -7.00%
- Median HH income
- $30,952
- Composite
- 13.57/100
- National rank
- #9512
- State rank
- #805 of 826 in TX
Livability — San Antonio
- Score
- 80/100
- State rank
- #31
- US rank
- #1616
Category grades
Schools grade is shown separately in the Schools card above.
Census & demographics
- Census place
- San Antonio, TX
- County
- Bexar County · 1,990,555 people
- City population
- 1,806,925
- Metro
- San Antonio-New Braunfels, TX
- Population (ZIP)
- 55,474
- Household income
- $32,472
- Rent vs Own
- Severe rent burden
- 2789.0
Population outlook (Bexar County) Hauer SSP2
- Today (2025)
- 2,336,851 people
- By 2030
- 2,560,728 · +9.6%
- By 2040
- 3,020,569 · +29.3%
- By 2050
- 3,493,522 · +49.5%
- By 2075
- 4,668,459 · +99.8%
- By 2100
- 5,533,242 · +136.8%
Race, ethnicity, and origin ACS 2023
- Neighborhood character
- Predominantly Hispanic (88%)
- Race & ethnicity
- Hispanic / Latino 88% Two or more races 41% White 6% Black 5% Native American 2%
- Hispanic origin (detail)
- Mexican 79%
- Foreign-born
- 19% · Canada
- Languages at home
- 39% English-only · Spanish 60%
Political lean MEDSL · Bexar
- 2024 margin
- Lean D (+9.8) · D 54.3% · R 44.6% · Other 1.1%
- 2008→2024 swing
- +4.2pp toward D · 2008: 5.6pp · 2024: 9.8pp
- All cycles
- 2024: D+9.8 2020: D+18.2 2016: D+13.5 2012: D+4.6 2008: D+5.6
Not yet ingested
- Civics
- —
Market trends
- HPI YoY
- ▲ 34.92%
- Current HPI
- 264.7559
- Rent YoY
- ▲ 7.73%
- Metro
- San Antonio-New Braunfels, TX
- State GDP YoY
- ▲ 3.95%
- F500 in state
- 110
Industry mix (Fortune 500 HQ in TX)
| Industry | F500 HQs | Revenue |
|---|---|---|
| Energy | 16 | $1,198B |
|
||
| Technology | 5 | $198B |
|
||
| Engineering / Construction | 4 | $72B |
|
||
| Energy Services | 3 | $60B |
|
||
| Utilities | 3 | $41B |
|
||
| Healthcare | 2 | $330B |
|
||
Price history
7 events — show timeline
- 2026-05-01 Pending — LERA
- 2026-04-24 Contingent — LERA
- 2026-04-10 Relisted — LERA
- 2026-02-27 Pending — LERA
- 2026-02-18 Contingent — LERA
- 2026-01-22 Listed $205,000 LERA
- 1995-02-01 Sold (Public Records) — Public Records
Property tax history
+4.6%/yrLatest (2025): $4,817 · +1.5% YoY. Source: county tax records.
Cash-flow waterfall
monthlySold comps — $/sqft
last 12 mo · ≤1 miLoading sold comps…