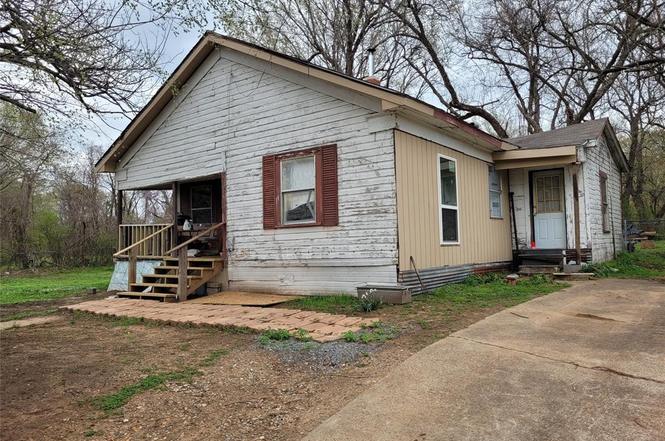
726 NE 6th · Paris, TX
Flood risk 1/10 · Minimal
- FEMA flood zone
- X (unshaded)
- Chance of flooding over 30 yrs
- 0.0%
- Est. flood insurance / yr
- $507 – $1,088
Fire risk 6/10 · Moderate
- Est. fire insurance / yr
- $1,222 – $2,270
Heat risk 7/10 · Major
- Hot days now (above 110°F)
- 7 days/yr
- Hot days in 30 yrs
- 20 days/yr
Wind risk 4/10 · Minor
- Chance of severe wind over 30 yrs
- 24.0%
Air-quality risk 2/10 · Minimal
- Unhealthy air days now
- 0 days/yr
- Unhealthy air days in 30 yrs
- 1 days/yr
Risk factors via First Street. Map © Google.
Why this score? — see what drove the B- grade
The composite is a weighted blend of 9 inputs, each scored 0–100. Each bar is that input's sub-score; the figure is the points it added to the 100-point composite (weight × sub-score).
- Cash flow +30.0/30.0
- 1% rule +10.0/10.0
- DSCR +10.0/10.0
- ARV discount +7.5/15.0
- Livability +3.1/5.0
- Schools +3.0/10.0
- Rent growth +2.5/5.0
- Condition / age +1.0/5.0
- Appreciation +0.0/10.0
$29,000
🖨 Deal sheet 📄 Offer letter ✓ Due diligence
Listing remarks
Looking for fixer upper, investment property? This one needs work but currently rented. Seller states motivated and price negotiable! Bring all offers!
Key facts
- Vacant lot
- Build second home
- Investment property
Tags
Property features AI
Finance
- Other: Property listed as single family residence; will not subdivide
- Financial info: Listing terms: Cash or Conventional
- HOA & community: No homeowners association
Exterior
- Parking: Driveway
- Utilities: City water with individual water meter; City sewer; Electricity connected; Phone available; Cable available; Asphalt streets and curbs
- Home design: Single-family residence (residential); Attached property; Built in 1950; One story
- Construction: Frame and wood construction; Block foundation; Asphalt roof
- Exterior features: Covered front porch; Additional covered porch(es); Chain-link fence around back yard; Few trees on the lot
Interior
- Kitchen: No appliances listed
- Bedrooms: 3 bedrooms (primary bedroom on main level)
- Bathrooms: 1 full bathroom
- Heating & cooling: Wood stove heating
- Interior features: Cable TV available; One living area and one dining area; Two total main rooms (listed room count: 2); One-level layout
- Laundry & utility: No laundry appliances listed
Neighborhood map
What this means for you Summary
Snapshot
- This is a 3-bed/1.0-bath single-family listed at $29k. Condition is rated poor.
Deal economics
- At list price, monthly cash flow is $715 ($9k/yr) — positive.
- The deal already cash-flows at list — no discount required.
- Meets the 1% rule at list price ($1k rent vs $29k).
- Recommended offer: $26k (9.0% below list) — sets the bar for market timing.
- Cap rate 35.9% vs local median 3.6% in Paris — top-decile yield for the area; either an underpriced asset or a hidden risk that comps aren't pricing in. Stress-test before assuming the spread holds.
Location & tenants
- Location reads 61/100 on livability (#984 in TX) — a middle-class / working-renter tenant base. Strengths: cost of living A+, housing A+; Watch: crime F, amenities F, commute F.
- Paris ISD (town): math 36% / reading 37% proficiency, ranked #521 of 826 in TX (top 63%) — families likely to look elsewhere, expect single-tenant / working-renter base with shorter leases; 70% free/reduced lunch — lower-income household profile, screen leases tightly.
- Zoned schools: Justiss El (math 27% / reading 32%, grade F, #2,525 of 4,322 statewide, top 62%, 552 students, 90% FRL) — zoned schools average 90% FRL vs 70% district-wide (20 pts higher); higher-poverty schools than district average — tighter screening recommended.
- Market conditions: 274 active listings in the ZIP; 3 comparable units currently listed for rent nearby; rentals lingering (median 44d on market — plan ~5-8 weeks vacancy on turnover, expect pricing pressure); 100% of comp listings sitting > 30 days — soft ceiling on asking rent; 119 units permitted in Lamar County in 2024 (71 in 5+ unit buildings).
Forward outlook
- Local home prices are declining (-3.0%/yr); year-one equity from $200 of loan paydown is wiped out by about $870 of value loss. Plan a longer hold.
- Lamar County population projected at -13% by 2050 — secular population decline; favor cash flow + early exit over multi-decade hold.
- At projected returns (-3.0% appreciation + 3.0% rent growth), your $8k cash investment doubles in ~2 years — after that, you're playing with house money.
Negotiation context
- It's been on market 100 days — a 9% lower offer ($26k) is reasonable based on typical stale-listing flexibility.
Risks & watch-outs
- Watch-outs: built in 1950 — expect roof / HVAC / electrical / plumbing capex.
- Climate carrying-cost: major wildfire risk; extreme-heat days projected 7→20/yr by 2055 (HVAC capex compounding) — expect insurance premiums to compound above CPI over the hold.
Questions for the listing agent
- It's been on market 100 days. Have you received any prior offers? Is the seller open to a 9% concession, seller financing, or rate buy-down credit?
- Have any recent inspections been done? Can we get a copy of the seller's disclosures and any deferred-maintenance estimates?
- Built in 1950 — when were the roof, HVAC, electrical panel, plumbing, and water heater last replaced?
- Why hasn't it sold? Are there any deal-killer items the seller is aware of (foundation, flood, title, zoning, code violations)?
- Is there a deadline driving the sale (1031 exchange, divorce, estate, relocation)? That informs how much negotiation room exists.
- Schools are D-rated, which usually means shorter tenancies and higher turnover. Who's the typical renter profile here, and what's been the actual vacancy rate?
- Crime grade is F in this area — have there been break-ins, vandalism, or insurance claims at this property in the last 3 years? What carrier currently insures it and at what premium?
- What's the average days-on-market for RENTAL listings here right now (not sales)? A rising rental-DOM trend means longer vacancies and softer asking-rent achievability than the comps imply.
- What's the recent tenant-quality profile in this submarket — average credit score on applications, eviction rate, late-payment / NSF rate, and stable-employment percentage? A property-management company in the area should have these aggregated.
- How much new for-sale + rental construction is in the pipeline within 1–3 miles? Heavy new supply typically softens prices + rents 12–24 months out; constrained supply supports both.
Investment metrics
- 1% rule
- 4.00% ✓
- Cap rate
- 35.88%
- Cash-on-cash
- 105.68%
- DSCR
- 5.70
- GRM
- 2.1
CMA / ARV
- ARV (on-the-fly)
- $92,480
- Comps found
- 10
Show comp detail 10 sales within ~0.75 mi
| Address | Dist | Beds/Ba | Sqft | Sold | Price | $/sf | Match |
|---|---|---|---|---|---|---|---|
| 370 NE 5th | 0.26mi | 2/1.0 (-1) | 1,120 (+3%) | 6mo | $45,000 | $40 | 73 |
| 236 2nd St NE | 0.42mi | 3/1.5 | 1,148 (+6%) | 7mo | $92,000 | $80 | 63 |
| 349 Fitzhugh Ave | 0.32mi | 2/1.0 (-1) | 1,140 (+5%) | 11mo | $52,000 | $46 | 63 |
| 1337 E Houston St | 0.68mi | 3/2.0 | 1,090 (+0%) | 3mo | $179,500 | $165 | 62 |
| 330 Pine Blf | 0.36mi | 2/1.0 (-1) | 1,008 (-7%) | 9mo | $65,900 | $65 | 59 |
| 336 14th St NE | 0.63mi | 2/1.0 (-1) | 1,120 (+3%) | 10mo | $149,990 | $134 | 52 |
| 1116 Belmont St | 0.36mi | 2/1.0 (-1) | 1,008 (-7%) | 17mo | $129,900 | $129 | 52 |
| 1240 E Hickory St | 0.63mi | 3/1.0 | 1,014 (-7%) | 10mo | $69,900 | $69 | 51 |
| 1025 17th St NE | 0.67mi | 2/1.0 (-1) | 1,116 (+3%) | 18mo | $99,000 | $89 | 45 |
| 1178 Grove St | 0.42mi | 2/1.0 (-1) | 936 (-14%) | 20mo | $79,997 | $85 | 36 |
Match score weights: distance 35% · size 25% · config 20% · recency 20%. Top-matched comps best support the ARV.
Projected returns pro-forma
-3.0% appreciation · 3.0% rent growth · sell at horizon
- IRR
- —
- Equity multiple
- 6.03×
- Total profit
- $40,861
- Equity at exit
- $4,324
- IRR
- —
- Equity multiple
- 12.61×
- Total profit
- $94,297
- Equity at exit
- $2,507
Cash invested: $8,120 (down + closing). Projections, not guarantees.
Landlord ↔ Tenant lean methodology
- Overall (STATE)
- 87 Strongly Landlord-Friendly
- State Texas
- 87 Strongly Landlord-Friendly · R+5
- County
- — inherits STATE
- City
- — inherits STATE
ZIP-level market 75460
- Active inventory
- 274
- Price-to-rent
- 2.1×
Monthly cashflow live
- Estimated rent
- $1,159 medium interval (Pro) →
- Mortgage (P&I)
- −$152
- Tax est. 1.5%
- −$36 /mo · $435/yr
- Insurance
- −$12
- HOA
- −$0
- Vacancy / Maint / Mgmt
- −$243
- Net cashflow
- $715
Break-even live
UW: 25.0% down · 7.5% · 30yr · 1.5% tax · 5.0% vac · 8.0% maint · 8.0% mgmt
Financing live
Cash to close
- Down payment
- $7,250
- Closing costs
- $870
- Reserves months
- —
- Total cash needed
- —
Loan-product check · same deal, 3 products live
Conventional
25% down · 7.5% · 30yr
- Down + closing
- —
- Monthly P&I
- —
- Monthly cashflow
- —
- DSCR
- —
- Eligible?
- —
Personal DTI + credit; lowest rate.
DSCR
20% down · 8.5% · 30yr
- Down + closing
- —
- Monthly P&I
- —
- Monthly cashflow
- —
- DSCR
- —
- Eligible?
- —
No personal income docs; deal must DSCR.
Hard money
10% down · 12.0% · 12mo
- Down + closing
- —
- Monthly P&I
- —
- Monthly cashflow
- —
- DSCR
- —
- Eligible?
- —
Short-term bridge; refi at stabilization.
Rent comps 3 comps
| Address | Beds | Baths | Sqft | Rent | $/sqft | DOM | Units | Dist |
|---|---|---|---|---|---|---|---|---|
| 649 E Price St Paris, TX | 2.0 | 1.0 | 900 | $1,100 | $1.22 | 43d | 1 | 0.41mi |
| 635 7th St SW Paris, TX | 1.0–4.0 | 1.0–2.0 | 903 | $1,250 | $1.38 | 43d | 16 | 0.77mi |
| 132 7th St SW Paris, TX | 2.0 | 1.0 | 800 | $900 | $1.12 | 43d | 1 | 0.95mi |
Listing history 19 events
-
2026-06-19days on market $29,000 Active 100 DOM
-
2026-06-18days on market $29,000 Active 99 DOM
-
2026-06-17days on market $29,000 Active 98 DOM
-
2026-06-16days on market $29,000 Active 97 DOM
-
2026-06-15days on market $29,000 Active 96 DOM
-
2026-06-14days on market $29,000 Active 94 DOM
-
2026-06-12days on market $29,000 Active 93 DOM
-
2026-06-09days on market $29,000 Active 90 DOM
-
2026-06-08days on market $29,000 Active 89 DOM
-
2026-06-07days on market $29,000 Active 88 DOM
-
2026-06-03days on market $29,000 Active 84 DOM
-
2026-06-02days on market $29,000 Active 83 DOM
-
2026-06-01days on market $29,000 Active 82 DOM
-
2026-05-31days on market $29,000 Active 81 DOM
-
2026-05-31days on market $29,000 Active 80 DOM
-
2026-05-04price $29,000
-
2026-04-05price $44,000
-
2026-03-23price $49,000
-
2026-03-09$61,000 Active
ⓘ Source: listings_history table (triggers on properties + properties_extension) + one-shot
backfill from property_details.listing_events for pre-trigger history.
Climate risk First Street
- Flood 1/10 Low FEMA zone X (unshaded) · 0% chance over 30 yrs
- Wildfire 6/10 Major
- Heat 7/10 Severe 7 d/yr ≥110°F today · 20 d/yr by 30 yrs out
- Wind 4/10 Moderate 24% chance of damaging wind over 30 yrs
- Air quality 2/10 Low 0 unhealthy d/yr today · 1 by 30 yrs out
Nearby sold comps map
Loading sold comps map…
Walkable amenities ~0.75 mi
Loading nearby amenities…
Taxation est. · year 1
- Rental income
- $13,906
- − Mortgage interest
- −$1,624
- − Property taxes
- −$435
- − Insurance
- −$145
- − Repairs & maintenance
- −$1,112
- − Management
- −$1,112
- − Depreciation
- −$844
- Taxable income
- $8,633
- Est. tax owed @ 24.0%
- −$2,072
- After-tax cash flow
- $6,509/yr
For passive investors: Depreciation is non-cash, so a rental often shows a tax loss while cash-flowing — sheltering income. Rental losses are passive: they offset passive income freely, and up to $25,000/yr can offset ordinary (W-2) income if you actively participate and your MAGI is under $100k (phasing out to $0 by $150k); unused losses carry forward. On sale, claimed depreciation is recaptured at up to 25%, and gains may owe capital-gains tax (a 1031 exchange can defer both). Figures are a year-1 estimate at your 24.0% rate — not tax advice; consult a CPA.
Condition & rehab AI · 13 photos
This fixer-upper requires extensive repairs and maintenance to bring it up to a livable condition. The exterior and interior need significant work, and the property is currently rented but in poor condition.
Repairs flagged
- Major exterior siding — Severe peeling and damage
- Major interior walls — Exposed insulation and peeling paint
- Major flooring — Damaged and uneven
Value-add opportunities
- Both Paint exterior — Enhances curb appeal and value
- Both Clean interior — Improves living conditions and value
Renovation cost estimate screening
| Repair item | Severity | Est. cost |
|---|---|---|
| exterior siding · Severe peeling and damage | Major | $15,000–50,000 |
| interior walls · Exposed insulation and peeling paint | Major | $15,000–50,000 |
| flooring · Damaged and uneven | Major | $15,000–50,000 |
| Total estimated repair cost · 3 items | $45,000–150,000 |
Value-add ROI direction
- Both Paint exterior — Enhances curb appeal and value ↑
- Both Clean interior — Improves living conditions and value ↑
ⓘ Cost ranges are severity-bucket heuristics (US national rule-of-thumb). Get contractor quotes + a written scope before underwriting a rehab budget.
Schools (NCES district)
- District
- Paris ISD
- NCES district ID
- 4834290
- Math proficiency
- 36% ▼ -11.00%
- Reading proficiency
- 37% ▼ -1.00%
- Median HH income
- $31,515
- Composite
- 29.83/100
- National rank
- #6419
- State rank
- #521 of 826 in TX
Livability — Paris
- Score
- 61/100
- State rank
- #984
- US rank
- #17535
Category grades
Schools grade is shown separately in the Schools card above.
Census & demographics
- Census place
- Paris, TX
- County
- Lamar County · 23,426 people
- City population
- 23,426
- Metro
- Paris, TX
- Population (ZIP)
- 23,426
- Household income
- $46,473
- Rent vs Own
- Severe rent burden
- 1355.0
Population outlook (Lamar County) Hauer SSP2
- Today (2025)
- 48,319 people
- By 2030
- 47,160 · -2.4%
- By 2040
- 44,621 · -7.7%
- By 2050
- 42,024 · -13.0%
- By 2075
- 36,577 · -24.3%
- By 2100
- 30,580 · -36.7%
Race, ethnicity, and origin ACS 2023
- Neighborhood character
- Diverse neighborhood (Simpson 0.60)
- Race & ethnicity
- White 58% Black 22% Hispanic / Latino 13% Two or more races 8%
- Hispanic origin (detail)
- Mexican 12%
- Common ancestry
- Lithuanian 1% Slovak 1% Italian 1%
- Foreign-born
- 3% · Canada, China
- Languages at home
- 92% English-only · Spanish 7%
Political lean MEDSL · Lamar
- 2024 margin
- Solid R (+61.0) · D 19.2% · R 80.3%
- 2008→2024 swing
- -19.1pp toward R · 2008: -42.0pp · 2024: -61.0pp
- All cycles
- 2024: R+61.0 2020: R+57.4 2016: R+59.2 2012: R+50.3 2008: R+42.0
Not yet ingested
- Civics
- —
Market trends
- HPI YoY
- ▼ -201.50%
- Current HPI
- 145.3511
- Rent YoY
- —
- Metro
- Paris, TX
- State GDP YoY
- ▲ 3.95%
- F500 in state
- 110
Industry mix (Fortune 500 HQ in TX)
| Industry | F500 HQs | Revenue |
|---|---|---|
| Energy | 16 | $1,198B |
|
||
| Technology | 5 | $198B |
|
||
| Engineering / Construction | 4 | $72B |
|
||
| Energy Services | 3 | $60B |
|
||
| Utilities | 3 | $41B |
|
||
| Healthcare | 2 | $330B |
|
||
Price history
-52.5% since first listed4 events — show timeline
- 2026-05-04 Price Changed $29,000 NTREIS
- 2026-04-05 Price Changed $44,000 NTREIS
- 2026-03-23 Price Changed $49,000 NTREIS
- 2026-03-09 Listed $61,000 NTREIS
Cash-flow waterfall
monthlySold comps — $/sqft
last 12 mo · ≤1 miLoading sold comps…