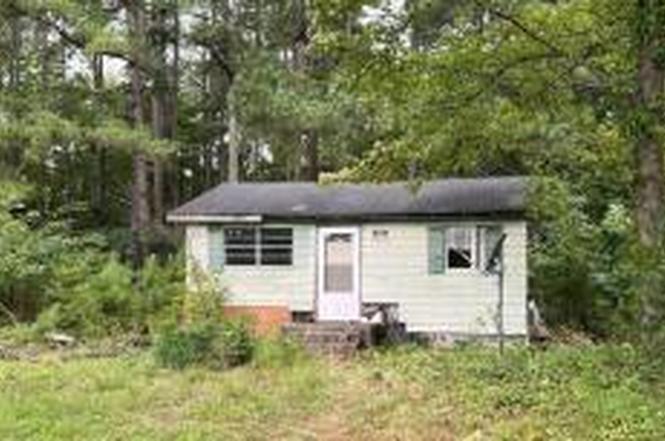
3541 Holden Acres Dr · Wendell, NC
Flood risk 1/10 · Minimal
- FEMA flood zone
- X (unshaded)
- Chance of flooding over 30 yrs
- 0.0%
- Est. flood insurance / yr
- $507 – $1,088
Fire risk 3/10 · Minor
- Est. fire insurance / yr
- $906 – $1,684
Heat risk 6/10 · Moderate
- Hot days now (above 105°F)
- 7 days/yr
- Hot days in 30 yrs
- 17 days/yr
Wind risk 6/10 · Moderate
- Chance of severe wind over 30 yrs
- 60.0%
Air-quality risk 3/10 · Minor
- Unhealthy air days now
- 2 days/yr
- Unhealthy air days in 30 yrs
- 3 days/yr
Risk factors via First Street. Map © Google.
Why this score? — see what drove the B grade
The composite is a weighted blend of 9 inputs, each scored 0–100. Each bar is that input's sub-score; the figure is the points it added to the 100-point composite (weight × sub-score).
- Cash flow +30.0/30.0
- 1% rule +10.0/10.0
- DSCR +10.0/10.0
- ARV discount +7.5/15.0
- Schools +4.9/10.0
- Livability +3.9/5.0
- Rent growth +3.4/5.0
- Condition / age +2.5/5.0
- Appreciation +0.0/10.0
$60,000
🖨 Deal sheet 📄 Offer letter ✓ Due diligence
Listing remarks
INCREDIBLE INVESTMENT OPPORTUNITY WITH UNLIMITED RETURN. COME UNLOCK AMAZING CASH FLOW POTENTIAL SAVING THOUSANDS IN INTEREST OR COME AND FREE UP CASH FOR REPAIRS AND ONLY PAY OFF LOAN ON THE RESALE. GREAT OPPORTUNITY FOR MINIMAL INITIAL INVESTMENT. PROPERTY NEEDS WORK & NEEDS NEW WELL & SEPTIC. COME BE GET THE BEST INVESTMENT IN WAKE COUNTY! PLEASE SEE AGENT REMARKS
Key facts
- 0.5 acre lot
- 2 parking spots
- Built 1970
Property features AI
Finance
- Other: Located in Wake County; Directions available: 264 East to Lizard Lick Rd (Exit 432) → Left on Lizard Lick Rd 1.2 miles → Left on Riley Rd 1.9 miles → Right on Edgemo nt Rd 1.6 miles → Left on Hodge Rd 0.3 miles → Right onto Holden Acres (road is unpaved)
- HOA & community: No homeowners association
Exterior
- Parking: 2 open parking spaces
- Utilities: Septic needed; No water source listed (see remarks)
- Home design: Site-built single-story home
- Construction: Wood siding; Foundation: see remarks; Roof: see remarks; One level
- Exterior features: Private maintained road access; 0.5-acre lot
Interior
- Bedrooms: 1 bedroom (main level)
- Flooring: Hardwood
- Bathrooms: 1 full bathroom
- Heating & cooling: No central cooling; Heating information: see remarks
- Interior features: Hardwood flooring
Neighborhood map
What this means for you Summary
Snapshot
- This is a 1-bed/1.0-bath single-family listed at $60k.
Deal economics
- At list price, monthly cash flow is $653 ($8k/yr) — positive.
- The deal already cash-flows at list — no discount required.
- Meets the 1% rule at list price ($1k rent vs $60k).
- Recommended offer: $53k (12.0% below list) — sets the bar for market timing.
- Cap rate 19.4% vs local median 3.7% in Wendell — top-decile yield for the area; either an underpriced asset or a hidden risk that comps aren't pricing in. Stress-test before assuming the spread holds.
Location & tenants
- Location reads 78/100 on livability (#25 in NC, #2,391 nationally) — a middle-class / working-renter tenant base. Strengths: housing A+, health & safety A+, crime A; Watch: amenities D, schools D-.
- Wake County Schools (suburban): math 52% / reading 60% proficiency, ranked #35 of 178 in NC (top 20%) — acceptable for families but not a draw, mixed tenant base, ~2y average lease.
- Market conditions: Rents rising (+3.4%/yr); 822 active listings in the ZIP; solid renter incomes; 15,249 units permitted in Wake County in 2024 (5,568 in 5+ unit buildings).
Forward outlook
- Local home prices are declining (-3.0%/yr); year-one equity from $415 of loan paydown is wiped out by about $2k of value loss. Plan a longer hold.
- Wake County population projected at +51% by 2050 — long-run rental-demand tailwind backs the buy-and-hold thesis.
- At projected returns (-3.0% appreciation + 3.4% rent growth), your $17k cash investment doubles in ~3 years — after that, you're playing with house money.
Negotiation context
- It's been on market 127 days — a 12% lower offer ($53k) is reasonable based on typical stale-listing flexibility.
- 5 sale attempts since 2y ago; this cycle's ask has dropped $5k (8%) from the opening price — seller is motivated, your offer sets the floor, not the list.
- Current owner paid $24k; list at $60k implies a 150% gain — meaningful room to come down on a strong offer.
Risks & watch-outs
- Climate carrying-cost: major wind risk, 60% chance of damaging wind over 30y; extreme-heat days projected 7→17/yr by 2055 (HVAC capex compounding) — expect insurance premiums to compound above CPI over the hold.
Questions for the listing agent
- It's been on market 127 days. Have you received any prior offers? Is the seller open to a 12% concession, seller financing, or rate buy-down credit?
- Built in 1970 — when were the roof, HVAC, electrical panel, plumbing, and water heater last replaced?
- Why hasn't it sold? Are there any deal-killer items the seller is aware of (foundation, flood, title, zoning, code violations)?
- Is there a deadline driving the sale (1031 exchange, divorce, estate, relocation)? That informs how much negotiation room exists.
- Schools are D-rated, which usually means shorter tenancies and higher turnover. Who's the typical renter profile here, and what's been the actual vacancy rate?
- What's the average days-on-market for RENTAL listings here right now (not sales)? A rising rental-DOM trend means longer vacancies and softer asking-rent achievability than the comps imply.
- What's the recent tenant-quality profile in this submarket — average credit score on applications, eviction rate, late-payment / NSF rate, and stable-employment percentage? A property-management company in the area should have these aggregated.
- How much new for-sale + rental construction is in the pipeline within 1–3 miles? Heavy new supply typically softens prices + rents 12–24 months out; constrained supply supports both.
Investment metrics
- 1% rule
- 2.14% ✓
- Cap rate
- 19.36%
- Cash-on-cash
- 46.67%
- DSCR
- 3.08
- GRM
- 3.9
CMA / ARV
No comps found within radius.
Projected returns pro-forma
-3.0% appreciation · 3.4% rent growth · sell at horizon
- IRR
- 44.4%
- Equity multiple
- 2.93×
- Total profit
- $32,398
- Equity at exit
- $8,946
- IRR
- 50.5%
- Equity multiple
- 5.99×
- Total profit
- $83,888
- Equity at exit
- $5,188
Cash invested: $16,800 (down + closing). Projections, not guarantees.
Landlord ↔ Tenant lean methodology
- Overall (STATE)
- 85 Strongly Landlord-Friendly
- State North Carolina
- 85 Strongly Landlord-Friendly · R+3
- County
- — inherits STATE
- City
- — inherits STATE
ZIP-level market 27591
- Home prices YoY
- -28.3%
- Rents YoY
- 3.4%
- Active inventory
- 822
- Price-to-rent
- 3.9×
Monthly cashflow live
- Estimated rent
- $1,284 medium interval (Pro) →
- Mortgage (P&I)
- −$315
- Tax from tax record
- −$21 /mo · $252/yr
- Insurance
- −$25
- HOA
- −$0
- Vacancy / Maint / Mgmt
- −$270
- Net cashflow
- $653
Break-even live
UW: 25.0% down · 7.5% · 30yr · 1.5% tax · 5.0% vac · 8.0% maint · 8.0% mgmt
Financing live
Cash to close
- Down payment
- $15,000
- Closing costs
- $1,800
- Reserves months
- —
- Total cash needed
- —
Loan-product check · same deal, 3 products live
Conventional
25% down · 7.5% · 30yr
- Down + closing
- —
- Monthly P&I
- —
- Monthly cashflow
- —
- DSCR
- —
- Eligible?
- —
Personal DTI + credit; lowest rate.
DSCR
20% down · 8.5% · 30yr
- Down + closing
- —
- Monthly P&I
- —
- Monthly cashflow
- —
- DSCR
- —
- Eligible?
- —
No personal income docs; deal must DSCR.
Hard money
10% down · 12.0% · 12mo
- Down + closing
- —
- Monthly P&I
- —
- Monthly cashflow
- —
- DSCR
- —
- Eligible?
- —
Short-term bridge; refi at stabilization.
Listing history 43 events
-
2026-06-18days on market $60,000 Active 127 DOM
-
2026-06-17days on market $60,000 Active 126 DOM
-
2026-06-16days on market $60,000 Active 125 DOM
-
2026-06-15days on market $60,000 Active 124 DOM
-
2026-06-13days on market $60,000 Active 122 DOM
-
2026-06-13days on market $60,000 Active 121 DOM
-
2026-06-09days on market $60,000 Active 118 DOM
-
2026-06-08days on market $60,000 Active 117 DOM
-
2026-06-07days on market $60,000 Active 116 DOM
-
2026-06-05days on market $60,000 Active 113 DOM
-
2026-06-03days on market $60,000 Active 112 DOM
-
2026-06-02days on market $60,000 Active 111 DOM
-
2026-06-01days on market $60,000 Active 110 DOM
-
2026-05-31days on market $60,000 Active 109 DOM
-
2026-04-29price $60,000
-
2026-04-10price $65,000
-
2026-03-13price $64,999
-
2026-02-11$65,000 Active
-
2026-02-10historical
-
2026-01-07price $64,999
-
2025-12-04price $65,000
-
2025-11-15price $74,899
-
2025-10-13price $74,900
-
2025-10-01$75,000 Active
-
2025-10-01historical
-
2025-09-02price $69,900
-
2025-08-12price $79,900
-
2025-08-05price $85,000
-
2025-07-23price $89,900
-
2025-07-03$99,900 Active
-
2025-07-01historical
-
2025-06-11price $99,900
-
2025-05-14price $109,900
-
2025-04-24price $114,900
-
2025-03-27$120,900 Active
-
2025-03-26historical
-
2025-02-04price $119,900
-
2025-01-16price $124,900
-
2024-12-04price $129,900
-
2024-11-13price $135,000
-
2024-11-01price $139,800
-
2024-09-20$139,900 Active
-
1997-08-15soldstatus $24,000
ⓘ Source: listings_history table (triggers on properties + properties_extension) + one-shot
backfill from property_details.listing_events for pre-trigger history.
Tax reassessment forecast NC · Resets to sale price
- Current annual tax
- $252 · $21/mo
- Projected year-2 tax
- $492 · $41/mo
- Expected delta
- +$240/yr (+$20/mo · 94.9%)
ⓘ Screening estimate from a state-policy table — verify with the county assessor before closing.
Climate risk First Street
- Flood 1/10 Low FEMA zone X (unshaded) · 0% chance over 30 yrs
- Wildfire 3/10 Moderate
- Heat 6/10 Major 7 d/yr ≥105°F today · 17 d/yr by 30 yrs out
- Wind 6/10 Major 60% chance of damaging wind over 30 yrs
- Air quality 3/10 Moderate 2 unhealthy d/yr today · 3 by 30 yrs out
Nearby sold comps map
Loading sold comps map…
Walkable amenities ~0.75 mi
Loading nearby amenities…
Taxation est. · year 1
- Rental income
- $15,404
- − Mortgage interest
- −$3,361
- − Property taxes
- −$252
- − Insurance
- −$300
- − Repairs & maintenance
- −$1,232
- − Management
- −$1,232
- − Depreciation
- −$1,745
- Taxable income
- $7,280
- Est. tax owed @ 24.0%
- −$1,747
- After-tax cash flow
- $6,094/yr
For passive investors: Depreciation is non-cash, so a rental often shows a tax loss while cash-flowing — sheltering income. Rental losses are passive: they offset passive income freely, and up to $25,000/yr can offset ordinary (W-2) income if you actively participate and your MAGI is under $100k (phasing out to $0 by $150k); unused losses carry forward. On sale, claimed depreciation is recaptured at up to 25%, and gains may owe capital-gains tax (a 1031 exchange can defer both). Figures are a year-1 estimate at your 24.0% rate — not tax advice; consult a CPA.
Schools (NCES district)
- District
- Wake County Schools
- NCES district ID
- 3704720
- Math proficiency
- 52% ▲ 2.00%
- Reading proficiency
- 60% ▲ 4.00%
- Median HH income
- $67,509
- Composite
- 49.41/100
- National rank
- #2010
- State rank
- #35 of 178 in NC
Livability — Wendell
- Score
- 78/100
- State rank
- #25
- US rank
- #2391
Category grades
Schools grade is shown separately in the Schools card above.
Census & demographics
- County
- Wake County · 1,216,256 people
- City population
- 29,838
- Metro
- Raleigh-Cary, NC
- Population (ZIP)
- 29,838
- Household income
- $85,224
- Rent vs Own
- Severe rent burden
- 369.0
Population outlook (Wake County) Hauer SSP2
- Today (2025)
- 1,293,152 people
- By 2030
- 1,428,223 · +10.4%
- By 2040
- 1,698,188 · +31.3%
- By 2050
- 1,955,807 · +51.2%
- By 2075
- 2,520,273 · +94.9%
- By 2100
- 2,893,335 · +123.7%
Race, ethnicity, and origin ACS 2023
- Neighborhood character
- Diverse neighborhood (Simpson 0.66)
- Race & ethnicity
- White 46% Hispanic / Latino 27% Black 22% Two or more races 11%
- Hispanic origin (detail)
- Mexican 14% Puerto Rican 4% Dominican 1%
- Common ancestry
- Slovak 2% Serbian 2% Lithuanian 1%
- Foreign-born
- 14% · Canada, Jamaica
- Languages at home
- 79% English-only · Spanish 18% Tagalog/Filipino 1%
Political lean MEDSL · Wake
- 2024 margin
- Strong D (+25.5) · D 61.9% · R 36.4% · Other 1.7%
- 2008→2024 swing
- +11.1pp toward D · 2008: 14.4pp · 2024: 25.5pp
- All cycles
- 2024: D+25.5 2020: D+26.4 2016: D+20.5 2012: D+10.2 2008: D+14.4
Not yet ingested
- Civics
- —
Market trends
- HPI YoY
- ▼ -92.20%
- Current HPI
- 233.2846
- Rent YoY
- ▲ 3.40%
- Metro
- Raleigh-Cary, NC
- State GDP YoY
- ▲ 3.28%
- F500 in state
- 26
Industry mix (Fortune 500 HQ in NC)
| Industry | F500 HQs | Revenue |
|---|---|---|
| Financial Services | 2 | $213B |
|
||
| Retail | 2 | $95B |
|
||
| Industrial Conglomerate | 1 | $38B |
|
||
| Metals / Steel | 1 | $35B |
|
||
| Utilities | 1 | $30B |
|
||
| Industrial Machinery | 1 | $19B |
|
||
Price history
+150.0% since first listed29 events — show timeline
- 2026-04-29 Price Changed $60,000 TMLS
- 2026-04-10 Price Changed $65,000 TMLS
- 2026-03-13 Price Changed $64,999 TMLS
- 2026-02-11 Listed $65,000 TMLS
- 2026-02-10 Listing Removed — TMLS
- 2026-01-07 Price Changed $64,999 TMLS
- 2025-12-04 Price Changed $65,000 TMLS
- 2025-11-15 Price Changed $74,899 TMLS
- 2025-10-13 Price Changed $74,900 TMLS
- 2025-10-01 Listing Removed — TMLS
- 2025-10-01 Listed $75,000 TMLS
- 2025-09-02 Price Changed $69,900 TMLS
- 2025-08-12 Price Changed $79,900 TMLS
- 2025-08-05 Price Changed $85,000 TMLS
- 2025-07-23 Price Changed $89,900 TMLS
- 2025-07-03 Listed $99,900 TMLS
- 2025-07-01 Listing Removed — TMLS
- 2025-06-11 Price Changed $99,900 TMLS
- 2025-05-14 Price Changed $109,900 TMLS
- 2025-04-24 Price Changed $114,900 TMLS
- 2025-03-27 Listed $120,900 TMLS
- 2025-03-26 Listing Removed — TMLS
- 2025-02-04 Price Changed $119,900 TMLS
- 2025-01-16 Price Changed $124,900 TMLS
- 2024-12-04 Price Changed $129,900 TMLS
- 2024-11-13 Price Changed $135,000 TMLS
- 2024-11-01 Price Changed $139,800 TMLS
- 2024-09-20 Listed $139,900 TMLS
- 1997-08-15 Sold (Public Records) $24,000 Public Records
Property tax history
-1.7%/yrLatest (2025): $252 · +2.8% YoY. Source: county tax records.
Cash-flow waterfall
monthlySold comps — $/sqft
last 12 mo · ≤1 miLoading sold comps…