 🏗️ New Construction
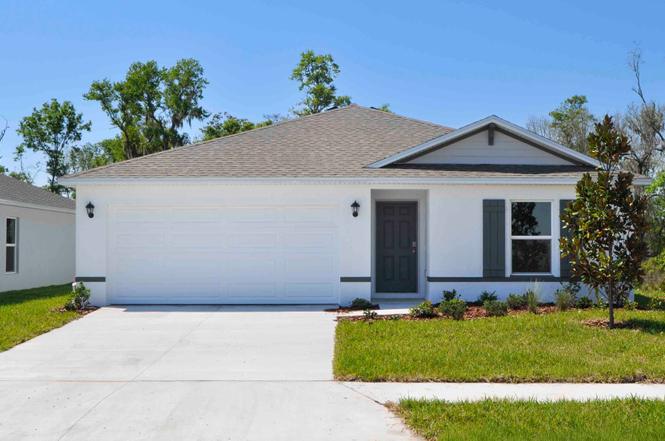
Archer II Plan · Lakewood Ranch, FL
Flood risk No data
- FEMA flood zone
- —
- Chance of flooding over 30 yrs
- —
- Est. flood insurance / yr
- —
Fire risk No data
- Est. fire insurance / yr
- —
Heat risk No data
- Hot days now (above threshold)
- —
- Hot days in 30 yrs
- —
Wind risk No data
- Chance of severe wind over 30 yrs
- —
Air-quality risk No data
- Unhealthy air days now
- —
- Unhealthy air days in 30 yrs
- —
Risk factors via First Street. Map © Google.
Why this score? — see what drove the D grade
The composite is a weighted blend of 9 inputs, each scored 0–100. Each bar is that input's sub-score; the figure is the points it added to the 100-point composite (weight × sub-score).
- Cash flow +14.5/30.0
- ARV discount +7.5/15.0
- DSCR +4.4/10.0
- Schools +4.4/10.0
- 1% rule +4.0/10.0
- Livability +2.5/5.0
- Condition / age +2.5/5.0
- Rent growth +2.3/5.0
- Appreciation +0.0/10.0
$315,990
🖨 Deal sheet 📄 Offer letter ✓ Due diligence
Listing remarks
Welcome to the Archer II, a thoughtfully designed single-story home offering the perfect blend of comfort, functionality, and modern style. Upon entry, you're welcomed into a spacious foyer leading to two well-sized bedrooms and a full bathroom, perfect for guests or a growing family. The open-concept kitchen features a large island with seating, quartz countertops, and a generous walk-in pantry-all overlooking the bright great room and cozy dining area, ideal for entertaining. The primary bedroom is tucked away at the rear of the home and features a large walk-in closet and en-suite bath with dual sinks and quartz countertops. Enjoy indoor-outdoor living with a rear patio accessed through
Key facts
- Open-concept kitchen
- Rear patio
- 2 garage spots
Tags
Property features AI
Finance
- Other: Listing status: Active; Last modified: 2026-05-25
- Financial info: List price $315,990
Exterior
- Parking: 2 parking spaces; 2-car garage
- Home design: New construction plan; Single-story (Plan)
- Exterior features: Address: Archer II Plan, Parrish, FL 34219
Interior
- Bedrooms: 3 bedrooms
- Bathrooms: 2 full bathrooms
- Interior features: Open living area of 1328; Plan: Archer II
Neighborhood map
What this means for you Summary
Snapshot
- This is a 3-bed/2.0-bath single-family listed at $316k.
Deal economics
- At list price, monthly cash flow is $68 ($819/yr) — positive.
- To cash-flow at today's rent, offer at most $309k (2.3% below list).
- To meet the 1% rule (rent ≥ 1% of price), the offer needs to be $270k (14.5% below list).
- Recommended offer: $270k (14.5% below list) — sets the bar for 1% rule.
- Cap rate 6.6% vs local median 3.3% in Lakewood Ranch — top-decile yield for the area; either an underpriced asset or a hidden risk that comps aren't pricing in. Stress-test before assuming the spread holds.
Location & tenants
- Location reads: area grade D — affects rentability + tenant quality, not the cash-flow math above.
- Manatee (suburban): math 54% / reading 50% proficiency, ranked #26 of 73 in FL (top 36%) — acceptable for families but not a draw, mixed tenant base, ~2y average lease.
- Market conditions: Rents soft (-0.9%/yr); 2170 active listings in the ZIP; 3 comparable units currently listed for rent nearby; rentals at typical pace (median 15d on market — plan ~3-4 weeks tenant-placement turnaround); high-income renter base; 7,472 units permitted in Manatee County in 2024 (1,782 in 5+ unit buildings).
Forward outlook
- Local home prices are declining (-3.0%/yr); year-one equity from $2k of loan paydown is wiped out by about $9k of value loss. Plan a longer hold.
- Manatee County population projected at +43% by 2050 — long-run rental-demand tailwind backs the buy-and-hold thesis.
Negotiation context
- It's been on market 138 days — a 12% lower offer ($278k) is reasonable based on typical stale-listing flexibility.
Questions for the listing agent
- It's been on market 138 days. Have you received any prior offers? Is the seller open to a 15% concession, seller financing, or rate buy-down credit?
- Why hasn't it sold? Are there any deal-killer items the seller is aware of (foundation, flood, title, zoning, code violations)?
- Is there a deadline driving the sale (1031 exchange, divorce, estate, relocation)? That informs how much negotiation room exists.
- The area grade is low — what's the realistic commute time and amenity access for the typical tenant pool here? Any planned neighborhood developments (good or bad) we should know about?
- What's the average days-on-market for RENTAL listings here right now (not sales)? A rising rental-DOM trend means longer vacancies and softer asking-rent achievability than the comps imply.
- What's the recent tenant-quality profile in this submarket — average credit score on applications, eviction rate, late-payment / NSF rate, and stable-employment percentage? A property-management company in the area should have these aggregated.
- How much new for-sale + rental construction is in the pipeline within 1–3 miles? Heavy new supply typically softens prices + rents 12–24 months out; constrained supply supports both.
Investment metrics
- 1% rule
- 0.90% ✗
- Cap rate
- 6.57%
- Cash-on-cash
- 0.98%
- DSCR
- 1.04
- GRM
- 9.2
CMA / ARV
- ARV (on-the-fly)
- $298,800
- Comps found
- 12
Show comp detail 12 sales within ~0.75 mi
| Address | Dist | Beds/Ba | Sqft | Sold | Price | $/sf | Match |
|---|---|---|---|---|---|---|---|
| 17929 Wheat Stack Ct | 0.62mi | 3/2.0 | 1,328 (0%) | 0mo | $314,000 | $236 | 71 |
| 17917 Wheat Stack Ct | 0.62mi | 3/2.0 | 1,328 (0%) | 1mo | $314,000 | $236 | 70 |
| 17947 Wheat Stack Ct | 0.62mi | 3/2.0 | 1,328 (0%) | 2mo | $329,000 | $248 | 70 |
| 17415 Whiskey Creek Trl | 0.14mi | 3/2.0 | 1,504 (+13%) | 3mo | $315,560 | $210 | 69 |
| 17411 Whiskey Creek Trl | 0.13mi | 3/2.0 | 1,504 (+13%) | 4mo | $319,225 | $212 | 68 |
| 17404 Whiskey Creek Trl | 0.11mi | 3/2.0 | 1,504 (+13%) | 6mo | $332,350 | $221 | 68 |
| 17427 Whiskey Creek Trl | 0.16mi | 3/2.0 | 1,504 (+13%) | 3mo | $317,500 | $211 | 68 |
| 17423 Whiskey Creek Trl | 0.15mi | 3/2.0 | 1,504 (+13%) | 4mo | $337,740 | $225 | 68 |
| 17412 Whiskey Creek Trl | 0.12mi | 3/2.0 | 1,504 (+13%) | 6mo | $334,500 | $222 | 68 |
| 17397 Whiskey Creek Trl | 0.11mi | 3/2.0 | 1,504 (+13%) | 7mo | $339,265 | $226 | 67 |
| 17909 Wheat Stack Ct | 0.62mi | 4/2.0 (+1) | 1,498 (+13%) | 1mo | $329,000 | $220 | 44 |
| 17921 Wheat Stack Ct | 0.62mi | 4/2.0 (+1) | 1,498 (+13%) | 1mo | $339,000 | $226 | 44 |
Match score weights: distance 35% · size 25% · config 20% · recency 20%. Top-matched comps best support the ARV.
Projected returns pro-forma
-3.0% appreciation · 0.0% rent growth · sell at horizon
- IRR
- -18.2%
- Equity multiple
- 0.38×
- Total profit
- $-51,946
- Equity at exit
- $44,552
- IRR
- -17.7%
- Equity multiple
- 0.16×
- Total profit
- $-70,055
- Equity at exit
- $25,835
Cash invested: $83,664 (down + closing). Projections, not guarantees.
Landlord ↔ Tenant lean methodology
- Overall (STATE)
- 87 Strongly Landlord-Friendly
- State Florida
- 87 Strongly Landlord-Friendly · R+3
- County
- — inherits STATE
- City
- — inherits STATE
ZIP-level market 34219
- Home prices YoY
- -23.7%
- Rents YoY
- -0.9%
- Active inventory
- 2170
- Price-to-rent
- 9.8×
Monthly cashflow live
- Estimated rent
- $2,700 medium interval (Pro) →
- Mortgage (P&I)
- −$1,567
- Tax est. 1.5%
- −$374 /mo · $4,482/yr
- Insurance
- −$124
- HOA
- −$0
- Vacancy / Maint / Mgmt
- −$567
- Net cashflow
- $68
Break-even live
UW: 25.0% down · 7.5% · 30yr · 1.5% tax · 5.0% vac · 8.0% maint · 8.0% mgmt
Financing live
Cash to close
- Down payment
- $74,700
- Closing costs
- $8,964
- Reserves months
- —
- Total cash needed
- —
Loan-product check · same deal, 3 products live
Conventional
25% down · 7.5% · 30yr
- Down + closing
- —
- Monthly P&I
- —
- Monthly cashflow
- —
- DSCR
- —
- Eligible?
- —
Personal DTI + credit; lowest rate.
DSCR
20% down · 8.5% · 30yr
- Down + closing
- —
- Monthly P&I
- —
- Monthly cashflow
- —
- DSCR
- —
- Eligible?
- —
No personal income docs; deal must DSCR.
Hard money
10% down · 12.0% · 12mo
- Down + closing
- —
- Monthly P&I
- —
- Monthly cashflow
- —
- DSCR
- —
- Eligible?
- —
Short-term bridge; refi at stabilization.
Rent comps 3 comps
| Address | Beds | Baths | Sqft | Rent | $/sqft | DOM | Units | Dist |
|---|---|---|---|---|---|---|---|---|
| 16823 Destrehen Ct Parrish, FL | 3.0 | 2.0 | 1744 | $2,490 | $1.43 | 3d | 1 | 0.54mi |
| 923 Hagle Park Rd Unit 925 Bradenton, FL | 3.0 | 2.0 | 1100 | $2,175 | $1.98 | 20d | 1 | 1.27mi |
| 15769 High Bell Pl Bradenton, FL | 4.0 | 2.0 | 1828 | $2,500 | $1.37 | 14d | 1 | 1.36mi |
Listing history 14 events
-
2026-06-18days on market $315,990 Active 138 DOM
-
2026-06-17days on market $315,990 Active 137 DOM
-
2026-06-16days on market $315,990 Active 136 DOM
-
2026-06-15days on market $315,990 Active 135 DOM
-
2026-06-13days on market $315,990 Active 133 DOM
-
2026-06-13days on market $315,990 Active 132 DOM
-
2026-06-10days on market $315,990 Active 130 DOM
-
2026-06-09days on market $315,990 Active 129 DOM
-
2026-06-08days on market $315,990 Active 128 DOM
-
2026-06-08days on market $315,990 Active 127 DOM
-
2026-06-03days on market $315,990 Active 123 DOM
-
2026-06-02days on market $315,990 Active 122 DOM
-
2026-06-01days on market $315,990 Active 121 DOM
-
2026-05-31days on market $315,990 Active 120 DOM
ⓘ Source: listings_history table (triggers on properties + properties_extension) + one-shot
backfill from property_details.listing_events for pre-trigger history.
Nearby sold comps map
Loading sold comps map…
Walkable amenities ~0.75 mi
Loading nearby amenities…
Taxation est. · year 1
- Rental income
- $32,402
- − Mortgage interest
- −$16,737
- − Property taxes
- −$4,482
- − Insurance
- −$1,494
- − Repairs & maintenance
- −$2,592
- − Management
- −$2,592
- − Depreciation
- −$8,692
- Taxable loss
- −$4,188
- Est. tax savings @ 24.0%
- +$1,005
- After-tax cash flow
- $1,824/yr
For passive investors: Depreciation is non-cash, so a rental often shows a tax loss while cash-flowing — sheltering income. Rental losses are passive: they offset passive income freely, and up to $25,000/yr can offset ordinary (W-2) income if you actively participate and your MAGI is under $100k (phasing out to $0 by $150k); unused losses carry forward. On sale, claimed depreciation is recaptured at up to 25%, and gains may owe capital-gains tax (a 1031 exchange can defer both). Figures are a year-1 estimate at your 24.0% rate — not tax advice; consult a CPA.
Schools (NCES district)
- District
- Manatee
- NCES district ID
- 1201230
- Math proficiency
- 54% ▼ -6.00%
- Reading proficiency
- 50% ▼ -2.00%
- Median HH income
- $49,607
- Composite
- 44.43/100
- National rank
- #2806
- State rank
- #26 of 73 in FL
Livability — Lakewood Ranch
No livability data for this city. (Only ~50 U.S. cities are tracked.)
Census & demographics
- County
- Manatee County · 416,364 people
- City population
- 52,177
- Metro
- North Port-Sarasota-Bradenton, FL
- Population (ZIP)
- 33,296
- Household income
- $113,773
- Rent vs Own
- Severe rent burden
- 219.0
Population outlook (Manatee County) Hauer SSP2
- Today (2025)
- 447,342 people
- By 2030
- 488,911 · +9.3%
- By 2040
- 567,934 · +27.0%
- By 2050
- 637,995 · +42.6%
- By 2075
- 781,970 · +74.8%
- By 2100
- 848,272 · +89.6%
Race, ethnicity, and origin ACS 2023
- Neighborhood character
- Predominantly White (75%)
- Race & ethnicity
- White 75% Hispanic / Latino 11% Two or more races 8% Black 8% Asian 2%
- Hispanic origin (detail)
- Mexican 2% Puerto Rican 3%
- Common ancestry
- Romanian 4% Hispanic 2% Russian 2%
- Foreign-born
- 10% · Canada, Dominican Republic, Jamaica
- Languages at home
- 88% English-only · Spanish 7% French/Haitian/Cajun 2% Other Asian/Pacific 1%
Political lean MEDSL · Manatee
- 2024 margin
- Strong R (+23.5) · D 37.9% · R 61.4%
- 2008→2024 swing
- -16.5pp toward R · 2008: -7.0pp · 2024: -23.5pp
- All cycles
- 2024: R+23.5 2020: R+16.1 2016: R+17.1 2012: R+12.5 2008: R+7.0
Not yet ingested
- Civics
- —
Market trends
- HPI YoY
- ▼ -84.45%
- Current HPI
- 271.7131
- Rent YoY
- ▼ -0.95%
- Metro
- North Port-Sarasota-Bradenton, FL
- State GDP YoY
- ▲ 3.28%
- F500 in state
- 36
Industry mix (Fortune 500 HQ in FL)
| Industry | F500 HQs | Revenue |
|---|---|---|
| Industrial Technology | 2 | $29B |
|
||
| Insurance | 2 | $17B |
|
||
| Retail | 1 | $60B |
|
||
| Technology Distribution | 1 | $58B |
|
||
| Homebuilding | 1 | $35B |
|
||
| Technology Manufacturing | 1 | $35B |
|
||
Cash-flow waterfall
monthlySold comps — $/sqft
last 12 mo · ≤1 miLoading sold comps…