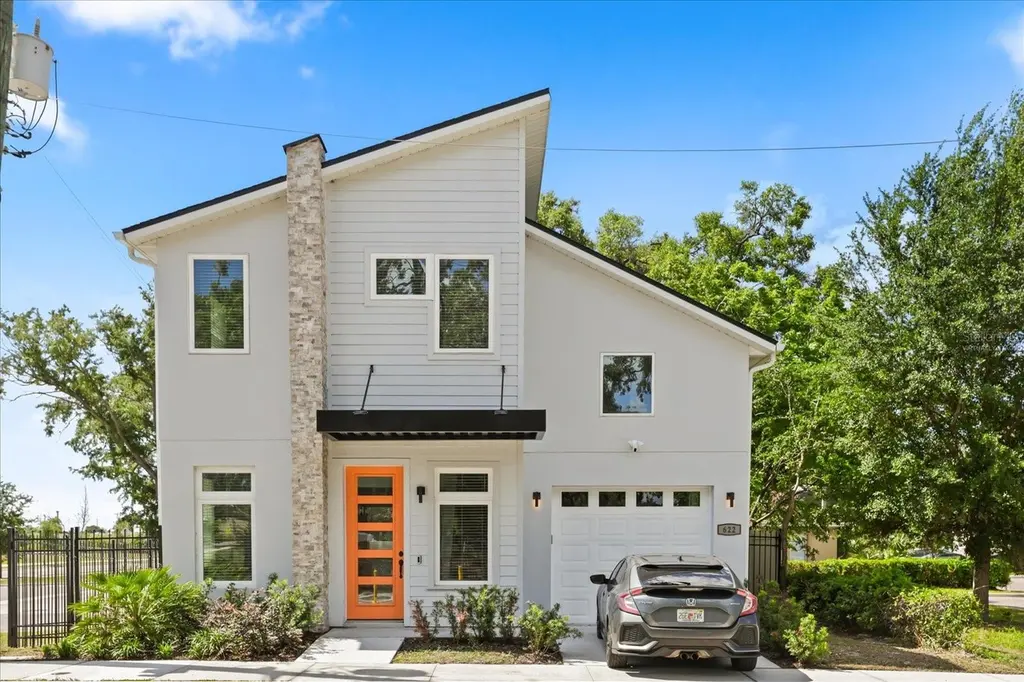
622 Conley St · Orlando, FL
Flood risk 1/10 · Minimal
- FEMA flood zone
- X (unshaded)
- Chance of flooding over 30 yrs
- 0.0%
- Est. flood insurance / yr
- $507 – $1,088
Fire risk 1/10 · Minimal
- Est. fire insurance / yr
- $947 – $1,759
Heat risk 8/10 · Major
- Hot days now (above 107°F)
- 6 days/yr
- Hot days in 30 yrs
- 19 days/yr
Wind risk 9/10 · Severe
- Chance of severe wind over 30 yrs
- 99.0%
Air-quality risk 1/10 · Minimal
- Unhealthy air days now
- 0 days/yr
- Unhealthy air days in 30 yrs
- 0 days/yr
Risk factors via First Street. Map © Google.
Why this score? — see what drove the D grade
The composite is a weighted blend of 9 inputs, each scored 0–100. Each bar is that input's sub-score; the figure is the points it added to the 100-point composite (weight × sub-score).
- ARV discount +12.0/15.0
- Cash flow +10.8/30.0
- Livability +4.3/5.0
- Schools +4.1/10.0
- 1% rule +3.2/10.0
- DSCR +3.1/10.0
- Rent growth +2.9/5.0
- Condition / age +2.5/5.0
- Appreciation +0.0/10.0
$380,000
🖨 Deal sheet 📄 Offer letter ✓ Due diligence
Listing remarks
One or more photo(s) has been virtually staged. Welcome to your brand new home in Orlando's historic Parramore community! This two-story, contemporary style home offers three bedrooms, two full bathrooms, one half bathroom, an open concept kitchen/living/dining space, and a one-car garage. Notable features include high ceilings, 6" base boards, tile flooring, and modern finishes. Green upgrades include Energy Star hybrid pump water heater and full kitchen appliance package. Kitchen boasts granite countertops, bar-style island, soft close cabinets, and laundry closet with stackable Profile washer and dryer units. First floor primary bedroom with ensuite bathroom features a walk-in close
Key facts
- Bar style island
- Soft close cabinets
- Walk in closet
Tags
Property features AI
Finance
- Other: Zoning: R-2B/T/PH; Lot about 0.1 acre (approx. 43 x 100); Public maintained paved road; Living area reported by owner: 1,581; Building area reported by owner: 1,781; Green features: energy-efficient appliances and water heater
- HOA & community: Street lights; Pets allowed
Exterior
- Parking: Attached garage (1 car); Garage; Driveway; Curb parking; On-street parking; Ground-level parking
- Security: Security lights; Security system; Smoke detectors
- Utilities: Public water; Public sewer; Electricity connected; Sewer connected; Water connected; BB/HS internet available; Cable available; Phone available
- Home design: Single-family residence; Residential property; Completed condition; Two levels; North-facing
- Construction: Block construction; Shingle roof; Slab foundation; New construction
- Exterior features: Patio; Exterior lighting; Rain gutters; Sidewalk; Vinyl fencing; Other fencing; Trees and landscaped yard; Florida-friendly/native landscaping; Corner lot; City limits; Near public transit; Paved surfaces
Interior
- Kitchen: Dishwasher; Disposal; Microwave; Range; Refrigerator; Electric water heater; Eat-in kitchen
- Bedrooms: 3 bedrooms
- Flooring: Carpet; Tile
- Bathrooms: 2 full baths; 1 half bath
- Heating & cooling: Central heating (electric); Central air
- Interior features: Ceiling fans; Eat-in kitchen; Living room/dining room combo; Thermostat; Walk-in closets; Blinds; Bonus room
- Laundry & utility: Washer hookup; Dryer hookup (electric); Laundry closet; Laundry in kitchen
Neighborhood map
What this means for you Summary
Snapshot
- This is a 3-bed/2.5-bath single-family listed at $380k.
Deal economics
- At list price, monthly cash flow is $-170 ($-2k/yr) — negative.
- To cash-flow at today's rent, offer at most $355k (6.5% below list).
- To meet the 1% rule (rent ≥ 1% of price), the offer needs to be $311k (18.2% below list).
- Recommended offer: $311k (18.2% below list) — sets the bar for 1% rule.
- Cap rate 5.8% vs local median 3.0% in Orlando — top-decile yield for the area; either an underpriced asset or a hidden risk that comps aren't pricing in. Stress-test before assuming the spread holds.
Location & tenants
- Location reads 86/100 on livability (#12 in FL, #360 nationally) — a professional / high-income tenant draw. Strengths: amenities A+, commute A+, housing A+.
- Orange (suburban): math 46% / reading 51% proficiency, ranked #43 of 73 in FL (top 59%) — families likely to look elsewhere, expect single-tenant / working-renter base with shorter leases.
- Zoned schools: Jones High (math 9% / reading 25%, grade F, #597 of 667 statewide, top 90%, 1,672 students, 75% FRL) — zoned schools average 75% FRL vs 56% district-wide (19 pts higher); higher-poverty schools than district average — tighter screening recommended.
- Zoned-school proficiency averages 17% at this address vs 48% district-wide (-32 pts) — the specific schools serving this property underperform the Orange average; the district grade overstates school quality for this exact location.
- Market conditions: Rents rising (+1.4%/yr); 140 active listings in the ZIP; 40 comparable units currently listed for rent nearby; rentals at typical pace (median 21d on market — plan ~3-4 weeks tenant-placement turnaround); lower-income renter base — watch delinquency; 8,053 units permitted in Orange County in 2024 (3,133 in 5+ unit buildings).
- At $3,108/mo this rent would consume 92% of the median local household income ($41k/yr) (locally 1597% of renters already pay >50% of income on rent) — very limited rent-growth headroom before tenants either downsize or default.
Forward outlook
- Local home prices are declining (-3.0%/yr); year-one equity from $3k of loan paydown is wiped out by about $11k of value loss. Plan a longer hold.
- Orange County population projected at +52% by 2050 — long-run rental-demand tailwind backs the buy-and-hold thesis.
Negotiation context
- It's been on market 31 days — a 3% lower offer ($369k) is reasonable based on typical stale-listing flexibility.
Risks & watch-outs
- Climate carrying-cost: severe wind risk, 99% chance of damaging wind over 30y; extreme-heat days projected 6→19/yr by 2055 (HVAC capex compounding) — expect insurance premiums to compound above CPI over the hold.
Questions for the listing agent
- What do current leases actually rent for vs. the listed asking? Can we see a recent rent roll and the last 12 months of T-12 income?
- It's been on market 31 days. Have you received any prior offers? Is the seller open to a 18% concession, seller financing, or rate buy-down credit?
- Is there a deadline driving the sale (1031 exchange, divorce, estate, relocation)? That informs how much negotiation room exists.
- Schools are B-rated — typically a magnet for longer-tenancy family renters. What's the average tenant stay here, and is there a school-zone premium baked into asking?
- The area grade is low — what's the realistic commute time and amenity access for the typical tenant pool here? Any planned neighborhood developments (good or bad) we should know about?
- What's the average days-on-market for RENTAL listings here right now (not sales)? A rising rental-DOM trend means longer vacancies and softer asking-rent achievability than the comps imply.
- What's the recent tenant-quality profile in this submarket — average credit score on applications, eviction rate, late-payment / NSF rate, and stable-employment percentage? A property-management company in the area should have these aggregated.
- How much new for-sale + rental construction is in the pipeline within 1–3 miles? Heavy new supply typically softens prices + rents 12–24 months out; constrained supply supports both.
Investment metrics
- 1% rule
- 0.82% ✗
- Cap rate
- 5.75%
- Cash-on-cash
- -1.92%
- DSCR
- 0.91
- GRM
- 10.2
CMA / ARV
- ARV (on-the-fly)
- $422,127
- Comps found
- 2
Show comp detail 2 sales within ~0.75 mi
| Address | Dist | Beds/Ba | Sqft | Sold | Price | $/sf | Match |
|---|---|---|---|---|---|---|---|
| 1005 Randall St | 0.44mi | 3/2.5 | 1,720 (+9%) | 13mo | $460,000 | $267 | 54 |
| 621 18th St | 0.67mi | 3/2.0 | 1,788 (+13%) | 1mo | $240,000 | $134 | 44 |
Match score weights: distance 35% · size 25% · config 20% · recency 20%. Top-matched comps best support the ARV.
Projected returns pro-forma
-3.0% appreciation · 1.42% rent growth · sell at horizon
- IRR
- -21.2%
- Equity multiple
- 0.27×
- Total profit
- $-77,254
- Equity at exit
- $56,659
- IRR
- -18.9%
- Equity multiple
- 0.06×
- Total profit
- $-100,403
- Equity at exit
- $32,855
Cash invested: $106,400 (down + closing). Projections, not guarantees.
Landlord ↔ Tenant lean methodology
- Overall (STATE)
- 87 Strongly Landlord-Friendly
- State Florida
- 87 Strongly Landlord-Friendly · R+3
- County
- — inherits STATE
- City
- — inherits STATE
ZIP-level market 32805
- Home prices YoY
- -7.6%
- Rents YoY
- 1.4%
- Active inventory
- 140
- Price-to-rent
- 10.2×
Monthly cashflow live
- Estimated rent
- $3,108 high interval (Pro) →
- Mortgage (P&I)
- −$1,993
- Tax est. 1.5%
- −$475 /mo · $5,700/yr
- Insurance
- −$158
- HOA
- −$0
- Vacancy / Maint / Mgmt
- −$653
- Net cashflow
- $-170
Break-even live
UW: 25.0% down · 7.5% · 30yr · 1.5% tax · 5.0% vac · 8.0% maint · 8.0% mgmt
Financing live
Cash to close
- Down payment
- $95,000
- Closing costs
- $11,400
- Reserves months
- —
- Total cash needed
- —
Loan-product check · same deal, 3 products live
Conventional
25% down · 7.5% · 30yr
- Down + closing
- —
- Monthly P&I
- —
- Monthly cashflow
- —
- DSCR
- —
- Eligible?
- —
Personal DTI + credit; lowest rate.
DSCR
20% down · 8.5% · 30yr
- Down + closing
- —
- Monthly P&I
- —
- Monthly cashflow
- —
- DSCR
- —
- Eligible?
- —
No personal income docs; deal must DSCR.
Hard money
10% down · 12.0% · 12mo
- Down + closing
- —
- Monthly P&I
- —
- Monthly cashflow
- —
- DSCR
- —
- Eligible?
- —
Short-term bridge; refi at stabilization.
Rent comps 40 comps
| Address | Beds | Baths | Sqft | Rent | $/sqft | DOM | Units | Dist |
|---|---|---|---|---|---|---|---|---|
| 732 S Lee Ave Orlando, FL | 3.0 | 2.5 | 1914 | $2,295 | $1.20 | 18d | 1 | 0.22mi |
| 638 Columbia St Orlando, FL | 4.0 | 1.0 | 1500 | $1,500 | $1.00 | 24d | 1 | 0.40mi |
| 728 Columbia St Unit A Orlando, FL | 3.0 | 1.0 | 1500 | $1,500 | $1.00 | 24d | 1 | 0.42mi |
| 728 Columbia St Orlando, FL | 3.0 | 1.0 | 1500 | $1,500 | $1.00 | 15d | 1 | 0.42mi |
| 644 Indiana St Orlando, FL | 3.0 | 2.0 | 1308 | $2,200 | $1.68 | 24d | 1 | 0.52mi |
| 733 Main Ln Orlando, FL | 3.0 | 1.0–2.0 | 1044 | $3,014 | $2.89 | 2d | 25 | 0.66mi |
| 930 18th St Unit A Orlando, FL | 4.0 | 1.0 | 1500 | $1,500 | $1.00 | 24d | 1 | 0.78mi |
| 204 E South St Orlando, FL | 2.0 | 2.0 | 1169 | $2,200 | $1.88 | 24d | 2 | 0.81mi |
| 1045 Polk St Unit 1049B Orlando, FL | 3.0 | 1.0 | 1062 | $1,650 | $1.55 | 24d | 1 | 0.89mi |
| 125 E Pine St Orlando, FL | 2.0 | 2.0 | 1237 | $3,150 | $2.55 | 24d | 1 | 0.93mi |
| 812 W Livingston St Unit A Orlando, FL | 3.0 | 2.0 | 1299 | $1,595 | $1.23 | 24d | 1 | 1.02mi |
| 1401 19th St Orlando, FL | 3.0 | 1.0 | 1100 | $1,800 | $1.64 | 24d | 1 | 1.03mi |
| 151 E Washington St Orlando, FL | 2.0 | 2.0 | 1507 | $3,250 | $2.16 | 24d | 2 | 1.03mi |
| 100 Lake Ave Orlando, FL | 2.0 | 2.0 | 1075 | $2,800 | $2.60 | 24d | 1 | 1.06mi |
| 322 E Central Blvd Orlando, FL | 2.0 | 2.0 | 1152 | $2,398 | $2.08 | 14d | 2 | 1.07mi |
| 322 E Central Blvd #1413 Orlando, FL | 2.0 | 2.0 | 1157 | $2,800 | $2.42 | 24d | 1 | 1.08mi |
| 101 Lake Ave Orlando, FL | 3.0 | 2.0 | 1706 | $4,000 | $2.34 | 24d | 1 | 1.08mi |
| 260 S Osceola Ave Orlando, FL | 2.0 | 2.0–2.5 | 1882 | $4,350 | $2.31 | 16d | 2 | 1.09mi |
| 260 S Osceola Ave #1106 Orlando, FL | 2.0 | 2.5 | 2000 | $4,750 | $2.38 | 24d | 1 | 1.09mi |
| 505 Chatham Ave Orlando, FL | 3.0 | 1.0–2.0 | 1022 | $3,144 | $3.08 | 3d | 27 | 1.09mi |
| 420 E Church St Orlando, FL | 1.0–3.0 | 1.0–2.0 | 1086 | $3,289 | $3.03 | 3d | 12 | 1.09mi |
| 150 E Robinson St Unit 31B Orlando, FL | 2.0 | 2.0 | 1237 | $3,400 | $2.75 | 18d | 1 | 1.10mi |
| 413 E Pine St Orlando, FL | 3.0 | 2.0 | 1743 | $3,485 | $2.00 | 24d | 1 | 1.10mi |
| 150 E Robinson St Orlando, FL | 2.0 | 1.0–2.0 | 829 | $3,650 | $4.40 | 14d | 6 | 1.11mi |
| 150 E Robinson St Orlando, FL | 2.0 | 1.0–2.0 | 829 | $3,650 | $4.40 | 3d | 9 | 1.11mi |
| 904 24th St Orlando, FL | 3.0 | 2.0 | 1088 | $1,800 | $1.65 | 20d | 1 | 1.11mi |
| 1907 S Rio Grande Ave Orlando, FL | 3.0 | 2.0 | 1130 | $1,600 | $1.42 | 24d | 1 | 1.11mi |
| 151 E Robinson St Orlando, FL | 4.0 | 1.0–3.5 | 1815 | $7,950 | $4.38 | 15d | 2 | 1.12mi |
| 480 N Terry Ave Orlando, FL | 3.0 | 1.0–2.0 | 841 | $2,709 | $3.22 | 3d | 29 | 1.13mi |
| 1829 Hollenbeck Dr #1 Orlando, FL | 3.0 | 1.0 | 1136 | $3,300 | $2.90 | 20d | 1 | 1.13mi |
| 415 E Pine St Orlando, FL | 2.0 | 2.0 | 1471 | $2,595 | $1.76 | 15d | 1 | 1.13mi |
| 410 N Orange Ave Orlando, FL | 3.0 | 1.0–3.0 | 854 | $4,725 | $5.53 | 2d | 181 | 1.15mi |
| 525 E Jackson St Unit P4 Orlando, FL | 2.0 | 2.0 | 1691 | $6,400 | $3.78 | 24d | 1 | 1.16mi |
| 525 E Jackson St Unit P3 Orlando, FL | 2.0 | 2.0 | 1644 | $6,200 | $3.77 | 24d | 1 | 1.16mi |
| 659 W Amelia St Orlando, FL | 1.0–3.0 | 1.0–2.0 | 849 | $2,282 | $2.69 | 2d | 27 | 1.16mi |
| 520 E Church St Orlando, FL | 1.0–3.0 | 1.0–2.0 | 1108 | $3,829 | $3.45 | 3d | 14 | 1.17mi |
| 525 E Jackson St Orlando, FL | 1.0–3.0 | 1.0–2.0 | 1540 | $6,500 | $4.22 | 14d | 6 | 1.17mi |
| 335 N Magnolia Ave Orlando, FL | 3.0 | 1.0–3.0 | 1041 | $2,640 | $2.54 | 2d | 35 | 1.17mi |
| 431 E Central Blvd Orlando, FL | 3.0 | 1.0–3.0 | 1228 | $3,420 | $2.79 | 2d | 24 | 1.20mi |
| 100 S Eola Dr #607 Orlando, FL | 2.0 | 2.0 | 1970 | $3,795 | $1.93 | 11d | 1 | 1.21mi |
Listing history 3 events
-
2026-06-02days on market $380,000 Active 31 DOM
-
2026-05-31days on market $380,000 Active 30 DOM
-
2026-05-01$380,000 Active
ⓘ Source: listings_history table (triggers on properties + properties_extension) + one-shot
backfill from property_details.listing_events for pre-trigger history.
Climate risk First Street
- Flood 1/10 Low FEMA zone X (unshaded) · 0% chance over 30 yrs
- Wildfire 1/10 Low
- Heat 8/10 Severe 6 d/yr ≥107°F today · 19 d/yr by 30 yrs out
- Wind 9/10 Extreme 99% chance of damaging wind over 30 yrs
- Air quality 1/10 Low 0 unhealthy d/yr today · 0 by 30 yrs out
Nearby sold comps map
Loading sold comps map…
Walkable amenities ~0.75 mi
Loading nearby amenities…
Taxation est. · year 1
- Rental income
- $37,300
- − Mortgage interest
- −$21,286
- − Property taxes
- −$5,700
- − Insurance
- −$1,900
- − Repairs & maintenance
- −$2,984
- − Management
- −$2,984
- − Depreciation
- −$11,055
- Taxable loss
- −$8,608
- Est. tax savings @ 24.0%
- +$2,066
- After-tax cash flow
- $20/yr
For passive investors: Depreciation is non-cash, so a rental often shows a tax loss while cash-flowing — sheltering income. Rental losses are passive: they offset passive income freely, and up to $25,000/yr can offset ordinary (W-2) income if you actively participate and your MAGI is under $100k (phasing out to $0 by $150k); unused losses carry forward. On sale, claimed depreciation is recaptured at up to 25%, and gains may owe capital-gains tax (a 1031 exchange can defer both). Figures are a year-1 estimate at your 24.0% rate — not tax advice; consult a CPA.
Schools (NCES district)
- District
- Orange
- NCES district ID
- 1201440
- Math proficiency
- 46% ▼ -9.00%
- Reading proficiency
- 51% ▼ -2.00%
- Median HH income
- $49,350
- Composite
- 41.47/100
- National rank
- #3461
- State rank
- #43 of 73 in FL
Livability — Orlando
- Score
- 86/100
- State rank
- #12
- US rank
- #360
Category grades
Schools grade is shown separately in the Schools card above.
Census & demographics
- Census place
- Orlando, FL
- County
- Orange County · 1,471,359 people
- City population
- 964,969
- Metro
- Orlando-Kissimmee-Sanford, FL
- Population (ZIP)
- 19,294
- Household income
- $40,515
- Rent vs Own
- Severe rent burden
- 1597.0
Population outlook (Orange County) Hauer SSP2
- Today (2025)
- 1,618,226 people
- By 2030
- 1,787,404 · +10.5%
- By 2040
- 2,125,621 · +31.4%
- By 2050
- 2,454,016 · +51.6%
- By 2075
- 3,173,711 · +96.1%
- By 2100
- 3,607,781 · +122.9%
Race, ethnicity, and origin ACS 2023
- Neighborhood character
- Predominantly Black (70%)
- Race & ethnicity
- Black 70% Hispanic / Latino 15% White 13% Two or more races 8%
- Hispanic origin (detail)
- Mexican 3% Puerto Rican 4% Cuban 1% Dominican 3%
- Common ancestry
- Hispanic 9% Russian 1%
- Foreign-born
- 16% · Canada, Jamaica
- Languages at home
- 80% English-only · Spanish 11% French/Haitian/Cajun 8%
Political lean MEDSL · Orange
- 2024 margin
- D (+13.6) · D 56.1% · R 42.5% · Other 1.3%
- 2008→2024 swing
- -5.0pp toward R · 2008: 18.6pp · 2024: 13.6pp
- All cycles
- 2024: D+13.6 2020: D+23.1 2016: D+24.6 2012: D+18.2 2008: D+18.6
Not yet ingested
- Civics
- —
Market trends
- HPI YoY
- ▼ -35.19%
- Current HPI
- 429.3242
- Rent YoY
- ▲ 1.42%
- Metro
- Orlando-Kissimmee-Sanford, FL
- State GDP YoY
- ▲ 3.28%
- F500 in state
- 36
Industry mix (Fortune 500 HQ in FL)
| Industry | F500 HQs | Revenue |
|---|---|---|
| Industrial Technology | 2 | $29B |
|
||
| Insurance | 2 | $17B |
|
||
| Retail | 1 | $60B |
|
||
| Technology Distribution | 1 | $58B |
|
||
| Homebuilding | 1 | $35B |
|
||
| Technology Manufacturing | 1 | $35B |
|
||
Price history
1 event — show timeline
- 2026-05-01 Listed $380,000 Stellar MLS as Distributed by MLS Grid
Property tax history
-7.4%/yrLatest (2025): $111 · +25.0% YoY. Source: county tax records.
Cash-flow waterfall
monthlySold comps — $/sqft
last 12 mo · ≤1 miLoading sold comps…